the Creative Commons Attribution 4.0 License.
the Creative Commons Attribution 4.0 License.
 | 31 May 2018
The tidal measurements of James Cook during the voyage of the Endeavour
The main priority of the first of James Cook's famous voyages of discovery was the observation of the transit of Venus at Tahiti. Following that, he was ordered to embark on a search for new lands in the South Pacific Ocean. Cook had instructions to record as many aspects of the environment as possible at each place that he visited, including the character of the tide. This paper makes an assessment of the quality of Cook's tidal observations using modern knowledge of the tide, and with an assumption that no major tidal changes have taken place during the past two and half centuries. We conclude that Cook's tidal measurements were accurate in general to about 0.5 ft (15 cm) in height and 0.5 h in time. Those of his findings which are less consistent with modern insight can be explained by the short stays of the Endeavour at some places. Cook's measurements were good enough (or unique enough) to be included in global compilations of tidal information in the 18th century and were used in the 19th century in the construction of the first worldwide tidal atlases. In most cases, they support Cook's reputation as a good observer of the environment.
- Article
(2082 KB) - Full-text XML
-
Supplement
(154 KB) - BibTeX
- EndNote


The years 2018–2021 mark the 250th anniversary of the famous voyage of Lt James Cook aboard HM Bark Endeavour. Following his observation of the transit of Venus at Tahiti, Cook embarked on a remarkable set of discoveries in the SW Pacific, including the first landing by Europeans in New Zealand and the first survey of the east coast of Australia. The findings of Cook and others on the Endeavour, notably Joseph Banks, have been discussed in detail by Beaglehole (1955) and by many other authors.
Cook carried two sets of orders, both marked “secret”. The first set ordered him to proceed to Tahiti, which had been selected by the Royal Society as a suitable site to observe the transit of Venus on 3 June 1769. Tahiti had been discovered shortly before (June 1767) by Lt Samuel Wallis aboard HMS Dolphin and named “King George the Third's Island”. The second set of orders instructed Cook, once the transit had been observed, to embark on a search for the great southern continent (Terra Australis), which had been included speculatively on maps of the world for hundreds of years. He was then to head westward between 35 and 40∘ S
until you discover it [Terra Australis], or fall in with the Eastern side of the land discover'd by Tasman and now called New Zeland.
Cook was told to make many observations during the voyage, including detailed observations of flora and fauna, the nature of soils and minerals, etc. More conventionally for someone in command of a vessel in the Royal Navy, he was ordered to observe
the Variation of the Needle, bearings of Head Lands, Height, direction and Course of the Tides and Currents, Depths and Soundings of the Sea, Shoals, Rocks &ca and also surveying and making Charts, and taking Views of Such Bays, Harbours and Parts of the Coasts as may be useful to Navigation.
Any natives were to be treated well.
Cook already had an excellent reputation as a marine surveyor, a fact which had been important in his selection as captain of the Endeavour (Skelton, 1954; Ritchie, 1978). He was also a skilled scientific observer who, for example, took responsibility for the astronomical measurements of the transit alongside the official astronomer Charles Green (Badger, 1970; Orchiston, 2004). In addition, as might be expected, the daily entries in his journal often include observations of tides, weather, appearance of coastlines and environmental conditions. Literal transcriptions of the copies of the journals of Cook and Banks held by the National Library of Australia are freely available at http://southseas.nla.gov.au/ (see Beaglehole, 1955, for an explanation of the differences between the various copies of Cook's journal).
In this paper, we consider one particular aspect of Cook's observations – those to do with the tides. These included the heights and times of the ocean tide at the places he visited and of the tidal streams he encountered during the voyage. The former are taken largely from observations noted in the daily entries and summarised in a table which Cook later passed to Nevil Maskelyne, the Astronomer Royal, who had them published in Philosophical Transactions (Cook, 1772). There are some other observations of tidal elevations in the daily entries not in the publication, which we refer to below. Further aspects of the tides are mentioned in Cook and Green (1771) and Cook (1776).
Cook and Green (1771) is particularly interesting, in that it is the only publication (as far as we know) to include the original observations of the tides, from which the summary in Cook (1772) was derived (at Tahiti in this case). In many of the cases reported in Cook (1772), the Endeavour was present at that location for only a day or so. Therefore, we expect that in those examples there were no detailed observations at all, and that the values reported in Cook (1772) were based simply on his general impressions as a skilled observer.
Cook was probably responsible himself for all the tidal measurements during the Endeavour voyage. For example, the entry in his journal for 5 December 1769 refers to the “few observations I have been able to make of the tides”, and his later publications (Cook, 1772, 1776) refer to “my observations on the tides”. Deacon (1971) suggests that Cook shared the tidal work with Green, based on Cook and Green (1771) being a summary of measurements by them both at Tahiti. However, while they both contributed to measurements of the transit (Orchiston, 2004, 2017), there is no evidence that Green contributed to the tides. This situation contrasts with Cook's second voyage of discovery. David (1992) explains how William Wales, the astronomer of the Resolution, and William Bayly on the Adventure had the responsibility for tidal measurements during the second voyage. Both of them used a type of tide gauge called a stilling well, consisting of a long narrow vertical tube with an aperture in the bottom to admit the water. By contrast, there is no information on how Cook's tidal measurements on the Endeavour voyage were made.
Our assessment of the quality of Cook's tidal observations has been made by comparison to those by modern tide gauges, with an assumption that there has been no significant change in the tide during the past 250 years. In fact, small secular tidal changes are known to have occurred at other locations, but they are too small to be of importance to the present investigation (e.g. Woodworth, 2010). Other processes, such as storm surges or seiches, might also have contributed to sea level variation on similar timescales to the tide during Cook's observation periods. However, we have no way of modelling them, and the assumption has to be that any “tide” observed by him was simply the astronomical tide.
To our knowledge, only one assessment of Cook's tides has been made before. David (1988) made use of tidal information provided by the UK Hydrographic Office (UKHO), but for locations in Australia only, not at Tahiti or New Zealand. In the discussion below we comment on this previous UKHO comparison.
Table 1The 14 locations where Cook estimated the timing (high water, hours and minutes) and range (rise and fall, feet and inches) of the tide at new and full moon, adapted from the table in Cook (1772). Latitudes and longitudes are as stated by Cook (1772), except for Thirsty Sound (station 12), which is given as 25∘05′ S in Cook (1772). This is an obvious typographical error, with his journal entry of 30 May 1770 being 22∘05′ S. (See the comments on the general quality of Cook's longitudes in the text.) Rise and fall was not estimated at Lagoon Island (station 2). For Endeavour River (station 13), high water of 9:15 has been assumed, as given in Cook (1776) instead of 9:30 in Cook (1772). The final column shows the approximate number of days that the Endeavour spent at each location as inferred from the daily entries in Cook's journal.
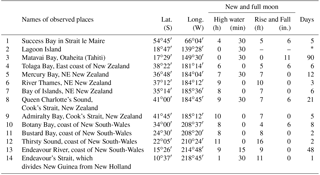
* for Lagoon Island indicates a stay of only a few hours (see text).
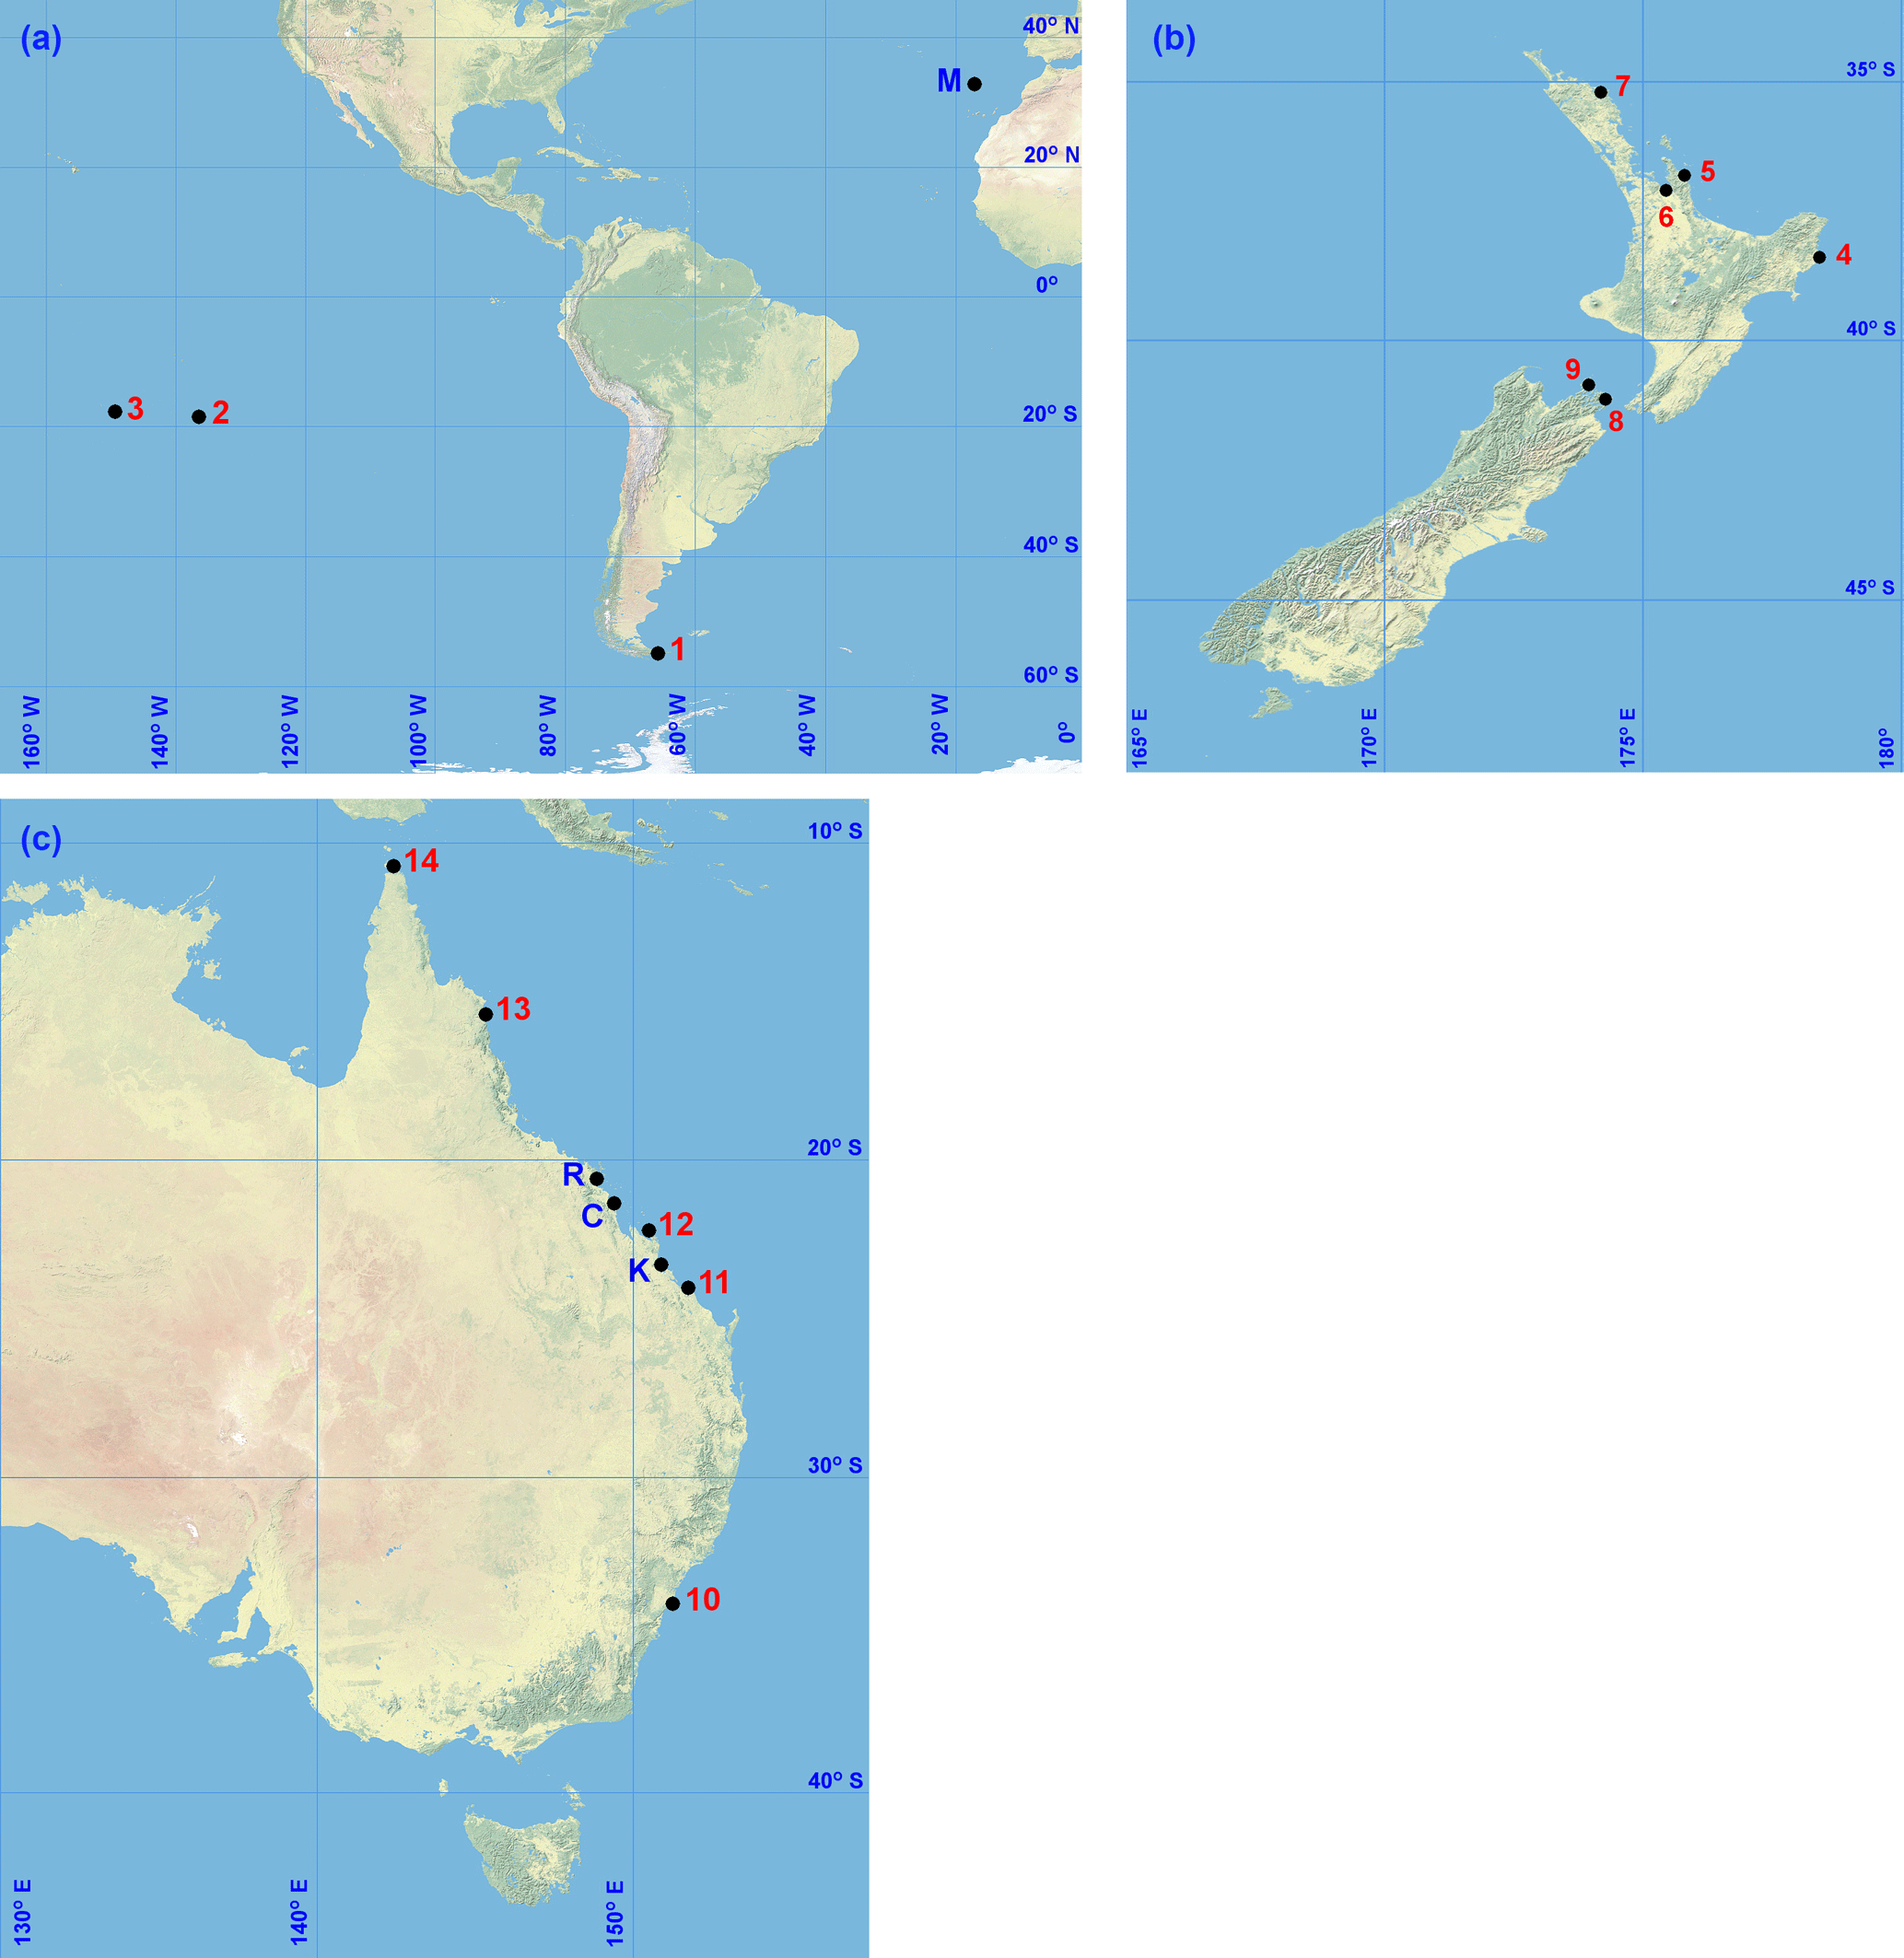
Figure 1Locations of Cook's tidal observations: (a) before New Zealand, (b) New Zealand and (c) Australia. Stations 1–14 are listed in Table 1 and stations M, K, C and R in Appendix B. Maps are made using Natural Earth free vector and raster map data (http://www.naturalearthdata.com).
2.1 Measurements of tidal establishment
Table 1 is taken from Cook (1772) and claims to show the range and timing of the tide at new and full moons at 14 locations during the Endeavour voyage (Fig. 1). Anyone interested in tides in the 18th century would have interpreted this table as follows.
The range (Cook calls this “Rise and Fall”) would have been taken to be the difference in height between high and low tide at new and full moon. This quantity would have been known to be almost the same as the range at spring tides. However, springs do not always coincide with new and full moons, and in most parts of the world they occur about 1–2 days later. This lag is called the age of the tide, a term coined by William Whewell (Cartwright, 1999). Consequently, the range at new and full moon is slightly smaller than at springs.
The timing would have been assumed to be a quantity called high water full and change (HWFC), later called establishment by Lubbock (1831), and subsequently vulgar or common establishment by Whewell (1833). Cartwright (1999) gives a history of how Lubbock and Whewell came to use these terms. HWFC represents the lag between the moon's transit of the meridian at the location in question and the next occurrence of high tide, at times when the moon, earth and sun are aligned (syzygy). Because we define time with respect to the sun, HWFC also corresponds to the time of day that high tide occurs, measured at that meridian and on the day of new and full moon.
Spring tidal range and HWFC were widely used during the 18th century as the two parameters with which to characterise the tide at any location. They had both practical and scientific importance. Seafarers would have known how they varied along a coastline, so aiding safe navigation (Lalande, 1781, refers to a Manuel du Pilote, which contains such information for the 60 principal ports in Europe). They were also the parameters used by researchers of the tides, who were eager to have similar information from further afield (Lalande, 1781). These simple parameters were devised in Europe, with its predominantly semidiurnal tidal regime. HWFC was expressed in the range 0–12 h and so had an inherent precision of ∼ 25 min for prediction of the time of any particular morning or afternoon semidiurnal tide (which is why Whewell, 1859, described establishment as a “loose parameter”).
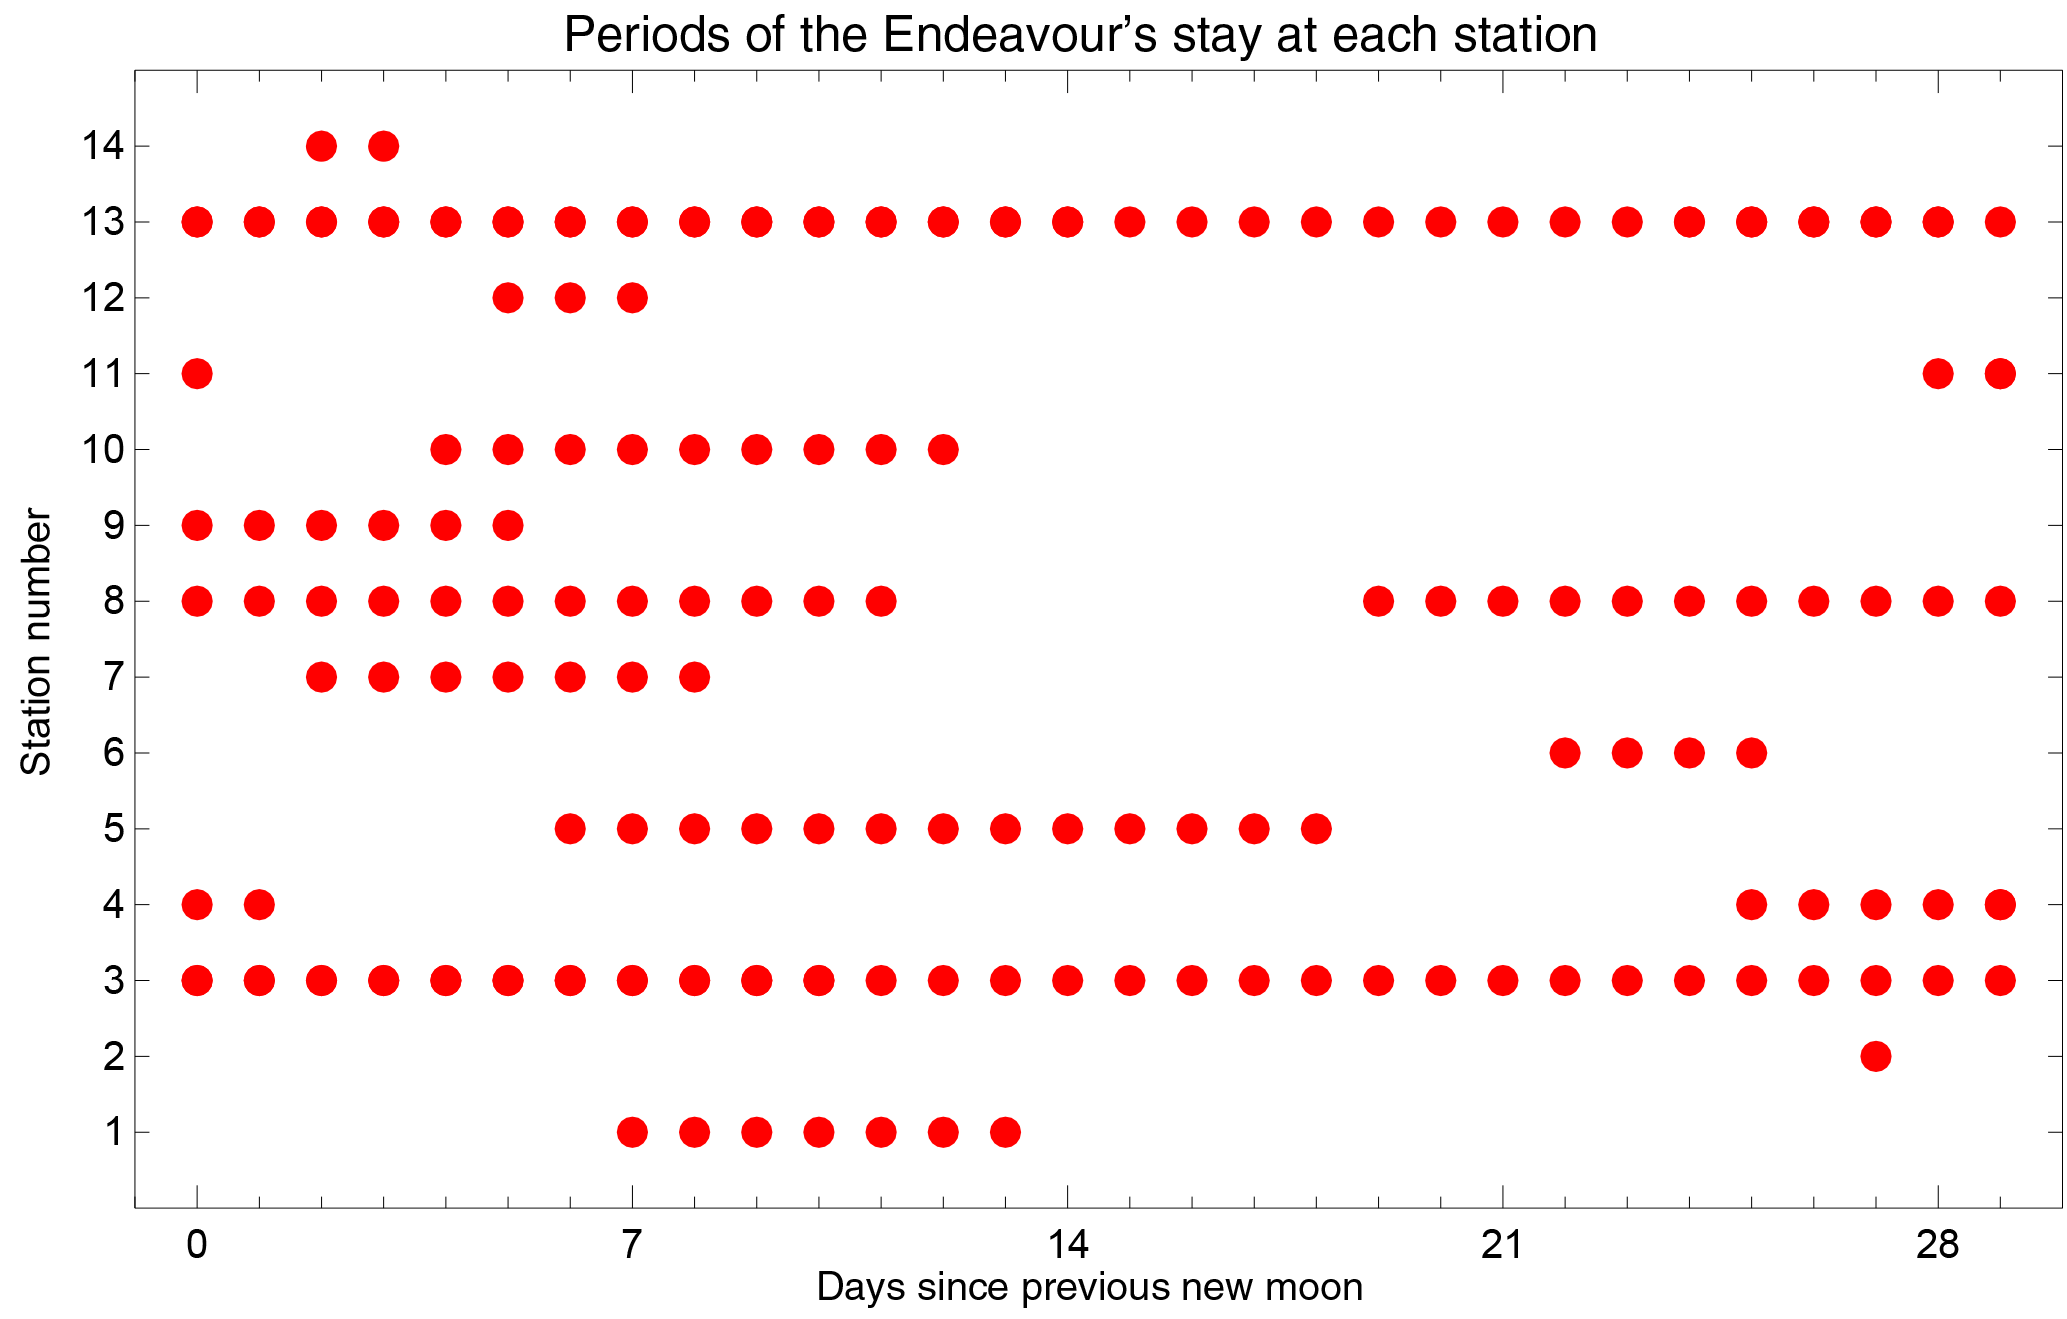
Figure 2A schematic summary of the periods of the Endeavour's stay at each station in Table 1 expressed as days since the last new moon at Greenwich.
If the tide consisted of only a semidiurnal lunar component (called M2), then the lag between lunar transit and high water would be the same for every tide. However, the existence also of a semidiurnal solar component (S2) results in the lag between lunar transit and high water varying over the spring–neap cycle by typically ±30–60 min. This variation is known as “priming” and “lagging” and the amplitude of the variation depends on the magnitude of S2 relative to M2. Consequently, HWFC can differ significantly from the average lag that occurs between lunar transit and high tide, called the mean high water interval (MHWI). MHWI was much preferred as a tidal parameter by Whewell, who called it the corrected or mean establishment (Whewell, 1833, 1859; Cartwright, 1999). In the later nomenclature of harmonic tidal constituents, one can express MHWI as
where κ(M2) is the phase lag of M2 and s(M2) is its angular speed. The difference between HWFC and MHWI depends upon the age of the tide, with the difference being approximately 30 min for parts of the world's coastline where the tide's age is about 2 days. Appendix A provides more information on the relationships between these quantities.
The compilation of Lalande (1781) contains many values of HWFC and tidal range from locations around the world. Most of these were from ports where it would have been straightforward to make observations of timing of the tide on the actual days of new and full moon. However, how did Cook (or other captains in the 18th century) estimate HWFC from observations of the tide at newly discovered locations during short stays in between new and full moon? Figure 2 gives a summary of the periods of Cook's stay at each of the stations in Table 1 with respect to the days since new moon. At many stations he was present for new (or full) moon, but at others such as River Thames1 (station 6) and Bay of Islands (7) in New Zealand or Thirsty Sound (12) in Australia his visit took the form of a short stay in between new and full moons.
We have not found any publication which provides a satisfactory answer to this question. However, the only possibility is that a rough correction would have been applied to the time of high water observed on a particular day, assuming that the time of high tide advances by 50 min per day and knowing the number of days that had elapsed since the last new (or full) moon (the moon's age). In fact, one can show that, in the case of a simple tide consisting of M2 and S2, if one knows the exact time of day when new moon occurs, then the difference between that and the time of the high tide on a particular day provides a perfect correction for obtaining HWFC.
David (1988) suggests that Cook must have used a procedure similar to that given by Moore (1800), who states,
Find the time of the moon's southing2 on that day, and subtract from it the time of high water at the given place, if you can, and the remainder will be the time of high water on the full and change days of the moon.
This is the same procedure explained by Whewell (1859) for obtaining the corrected establishment (MHWI), once small corrections for priming and lagging have been made.
It is just about plausible that Cook could also have worked this way. He would have had a copy of The Nautical Almanac (first published in 1767), from which he could have computed the local time of lunar transit to adequate accuracy for subtraction from the time of high water. The local time of transit could be estimated readily from the published time of transit at Greenwich by adding 2 min for every hour of longitude west of Greenwich. He would not have been able to make priming and lagging corrections. However, how would such a busy man as Cook have had time to make such calculations? Cook would have had time once he arrived home. However, the values in Cook (1772) are direct copies of the values in the daily entries of his journal, so they must have been the numbers that he decided upon at the time. Anyway, as explained above, the result of any such calculation involving The Nautical Almanac, as in Moore (1800), would have provided a quantity closer to MHWI than to HWFC.
Therefore, we do not believe that Cook and other captains worked this way at this time, and certainly most of them would not have had copies of The Nautical Almanac at this point in the 18th century. We suspect that Cook made a more rough-and-ready correction to obtain HWFC, as explained above. We show below a comparison of his findings to a modern calculation of HWFC using formulae given by Doodson and Warburg (1941) in the case of an idealised tide containing M2 and S2 constituents only (see Appendix A). It will be seen that, at locations where differences between HWFC and MHWI are largest (i.e. where the age of the tide is largest, which applies to several New Zealand stations), Cook's values are indeed closer to the computed HWFC than to MHWI.
However, the real ocean tide is never a simple combination of M2 and S2. Even where the tide is predominantly semidiurnal, such as at most of the locations discussed here, there are other constituents which can be important. For example, New Zealand has predominantly semidiurnal tides, with the largest amplitudes on the north-west coasts (Walters et al., 2001). However, N2 (the constituent which describes the variation of the semidiurnal tide over a month) has an amplitude several times that of S2 along parts of the east coast. At these locations, the semidiurnal tide varies primarily over a month instead of a fortnight. Then, there are locations where diurnal constituents can have comparable magnitude to semidiurnal constituents, such as along the coasts of NE Australia.
Consequently, there are two aspects to our examination of Cook's tidal measurements. One concerns whether his estimates of range and timing are consistent with the average values of those quantities derived from modern measurements of M2 and S2 and therefore whether they have value as representative of longer-term knowledge of the tide. A second aspect is to consider whether any differences can be explained by the Endeavour's short stays and the existence of tidal constituents additional to M2 and S2. In the case of a significant contribution from other constituents, Cook (or any other captain) can hardly be criticised for having made estimates of range and HWFC that differ from their long-term average values.
2.2 Aspects of Cook's tidal measurements
Before making a detailed comparison to modern information, it is worth considering how accurate Cook's measurements might have been, especially at locations where the Endeavour stayed for only a short time. If one looks for tidal information in the daily entries, one finds statements such as at Queen Charlotte's Sound, New Zealand, on 6 February 1770:
In sailing in or out of this Sound with little wind attention must be had to the Tides which flows 9 or 10 oClock at the full and change of the Moon and rises and falls upon a perpendicular 7 or 8 feet.
This statement converts to the stated timing of 9:30 and range of 7 ft 6 in. given in Table 1. Similarly, at Botany Bay, New South Wales, on 6 May 1770:
I had almost forgot to mention that the tide in∧it is high water in this Harbour∧Bay flowes at the full and change of the Moon about 8 o' Clock and rises and falls upon a perpendicular about 4 or 5 feet,
which converts to 8:00 and 4 ft 6 in. given in Table 1. Therefore, in most cases an accuracy (akin to a standard error) is implied of ∼ 0.5 h and ∼ 0.5 ft in timing and range respectively.
A second consideration with regard to timing is that Cook worked throughout using apparent (sun dial) time. The Endeavour did not carry an accurate chronometer which would have provided mean time. Cook had only a small watch that had to be adjusted regularly to apparent time using sextant observations of the local noon (Keir, 2010). Apparent time was anyway appropriate with regard to the Endeavour's navigation, given that the astronomical information in The Nautical Almanac was also given in apparent time (but according to the astronomical day which begins at noon on the civil day). However, modern estimates of the tide are calculated in mean time, which differs from apparent time by ±16 min depending on the day in the year (the equation of time, see Hughes et al., 1989). Therefore, in principle, any comparison of times of the tide by Cook and from modern measurements should be made using mean time throughout. We decided to ignore this complication for present purposes given the larger uncertainties mentioned above.
There are further considerations to do with the way that Cook recorded dates. As was standard practice in the Royal Navy at that time, Cook's daily entries are given according to the naval day (ship time). In that system, the naval day begins at noon on the preceding civil day and ends at noon on the civil day in question, rather than at midnight (and so the naval day is 1 day ahead of the astronomical day). Therefore, statements of PM or “afternoon” appear in the journal entry before those of AM or “morning”. An uncertainty of a day can clearly be important when considering tidal information. It should also be noted that during the extended stay at Tahiti for the transit of Venus, Cook reverted to the use of the civil day.
A second aspect to keep in mind is that Cook did not make an adjustment of +1 day to his dates when the Endeavour crossed the 180∘ meridian (in effect, the modern International Date Line) when travelling west across the Pacific towards New Zealand. Instead, he incremented his dates by one when he arrived at Batavia (now known as Jakarta, capital of Indonesia) on 10 October 1770. These complications are straightforward to deal with once they are realised, with any of Cook's dates converted to civil ones before comparison to modern tidal information.
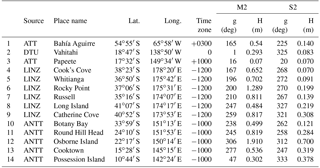
Table 2Locations with modern tidal measurements, as near as possible to those reported by Cook in Table 1. The final columns give the tidal constants for the M2 and S2 constituents (phase lag (g) in degrees and amplitude (H) in metres) as computed in the time zone shown (the number of hours west of Greenwich × 100). The constants were obtained from the Admiralty Tide Tables (ATT), Australian National Tide Tables (ANTT), Land Information New Zealand (LINZ), and the global tide model of Cheng and Andersen (2010) from the Technical University of Denmark (DTU).
Finally, one should note that the values of longitude reported by Cook were often highly inaccurate (Keir, 2010), partly due to the lack of an accurate chronometer. Any uncertainty in longitude can enter into a comparison of Cook's tides to modern tidal information via the use of the phase lags of tidal constituents (κ), such as given for M2 above. Phase lags are now stored in catalogues such as the Admiralty Tide Tables as Greenwich phase lags (G), or as phase lags (g) in a given time zone west (TZW) of Greenwich (e.g. TZW = −1200 h for New Zealand). κ, G and g are related via
where λ is longitude west of Greenwich; n=1 and 2 for a diurnal and semidiurnal constituent respectively; and s is the angular speed of the constituent (e.g. 28.9841∘ h−1 for M2, 30∘ h−1 for S2). Therefore, an error in λ propagates into an error in κ. Consequently, any comparison of tide times has to employ modern estimates of longitude and disregard those given by Cook.
2.3 Modern tidal information
The modern tidal information used in this paper is in the form of predictions of the height and time of the tide based on harmonic constants (amplitudes and phase lags) derived from extensive observations by tide gauges located as near as possible to the sites in Table 1 where Cook made his own measurements. Table 2 lists the 14 modern tide gauge stations that were chosen.
In the case of New Zealand stations, we used sets of constants computed by Land Information New Zealand (LINZ) containing between 9 and 26 constituents depending on the station. For most Australian and other locations, the four main constants (M2, S2, K1 and O1) were considered to be sufficient for an adequate description of the tide. These were taken from either the Admiralty Tide Tables (ATT) (UKHO, 2017a, b) or the Australian National Tide Tables (ANTT) (AHS, 2018). ATT and ANTT values are almost identical. For Lagoon Island (Vahitahi, Tuamotu Archipelago, French Polynesia), the four main constants were taken from the global tide model of the Technical University of Denmark (Cheng and Andersen, 2010) as no sets of constants from tide gauges were available. These Vahitahi values have been confirmed to be almost identical to those in two other state-of-the-art global tide models (Richard Ray, Goddard Space Flight Center, personal communication, 2017).
Two sets of tidal prediction software were used: one from LINZ based on that of Foreman (1977, updated 2004) and another from the National Oceanography Centre (NOC) based on Bell et al. (1996), with the two sets providing almost identical information. Time series of 1 min values of the tide were generated for each station spanning 1769–1770, from which the heights and times of high and low waters were extracted for comparison to Cook's findings.
3.1 Tidal range reported in Cook (1772)
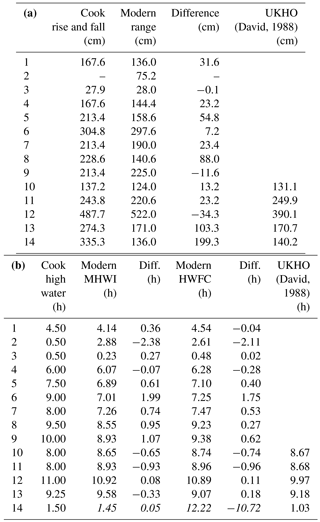
A first comparison is of spring tidal range. Table 3a shows the Cook values from Table 1, converted to centimetres, compared to twice the sum of the amplitudes of M2 and S2 from Table 2. At most places, the difference is within the expected uncertainty, but with an evident bias towards over-estimation of the range by Cook.
Of the New Zealand stations, the range was significantly over-estimated by Cook at Mercury Bay (station 5) and Queen Charlotte's Sound (8). The over-estimation was about 3 ft at Queen Charlotte's Sound (i.e. 7.5 ft in Table 1 compared to 4.6 ft inferred from Table 2), which is surprising given that Cook spent 3 weeks there.
Table 3(a) Range of the tide at new and full moon (from Cook) or at springs (from modern constants), and their difference. Modern range reported for Australian stations in David (1988). Unit: cm. (b) The time of high tide at new and full moon (from Cook), MHWI (from modern constants) and their difference from Cook, HWFC (from modern constants) and their difference from Cook. HWFC reported for Australian stations in David (1988). Unit: hours. Modern MHWI and HWFC for Possession Island (station 14) are shown in italics as they are not meaningful quantities at this location (see Sect. 3.5).
A previous assessment of Cook's tides at the five Australian locations (stations 10–14) was made by Cdr Nisbet Glen of the UKHO and published in David (1988, p. xxxvii). The stations used for their modern tidal comparisons were not given. They must have been close to, or the same as, the stations we have used. However, without knowing exactly which ones, and without their tidal constants, we cannot make a complete check on the previous findings.
Nevertheless, the conclusions from David (1988) and in the present study are similar (Table 3a). Cook estimated the spring range well at Botany Bay (station 10) and Bustard Bay (11). He rather over-estimated it at Endeavour River (13). Considering that he spent about 7 weeks there (or three spring–neap cycles), it is hard to see why he over-estimated the range by so much (see Sect. 3.4 for further discussion). He also appears to have considerably over-estimated the range at Possession Island (14) (but see Sect. 3.5). In the case of Thirsty Sound (12), David (1988) suggests that Cook over-estimated the range (16 ft in Cook 17723) compared to 12.8 ft from (unspecified) modern measurements. Banks also reckoned,
The tide rose very much, how high was not measured, but I think I may venture to guess not less at spring tides than 18 or twenty feet, perhaps much more
(Beaglehole, 1963). In this case, David (1988) seems to have made an unsuitable choice of modern station. Our use of Osborne Island gives a spring range of 17.1 ft that is reasonably close to Cook's estimate.
Cook (1772) does not give an estimate for rise and fall at Lagoon Island (Vahitahi, station 2), from which a reader might conclude that the range there was negligible. On the other hand, modern information (Cheng and Andersen, 2010) tells us that there would have been a semidiurnal range of about 80 cm on the day that Cook passed the island (4 April 1769).
This contradiction can be explained as follows. The island was spotted from the Endeavour at about 10:30 a.m. when the ship was several miles away and during clear weather (Beaglehole, 1955). Cook sailed parallel to the coast, under observation all the way by apparently hostile natives. He did not land. By this time, Cook was hell-bent on arriving at Tahiti as soon as possible (Hough, 1994), and by about 1:00 p.m. on the same day he was ready to sail on to the next island. High tide on 4 April would have been shortly before 1:00 p.m. Therefore, he was at Lagoon Island for a few hours at most, just before and around high tide, during which there would have been little vertical variation in the tide.
3.2 Times of high water reported in Cook (1772)
3.2.1 Before New Zealand
Table 3b shows HWFC as given by Cook, compared to MHWI computed from modern constants using Eq. (1) and also to HWFC computed as explained in Appendix A. Cook's HWFC compares acceptably with both MHWI and modern HWFC at Success Bay, Tierra del Fuego (station 1), although there is a better agreement with the latter.
The largest difference in Table 3b, of over 2 h, is found at Vahitahi (Lagoon Island, station 2). However, Cook's HWFC estimate, based on a stay of a few hours at an island where he did not even land, is of little value. Timing of the tide is acceptable at Tahiti (station 3), which is discussed in more detail in Sect. 3.3.
3.2.2 New Zealand
Large differences between Cook's HWFC and MHWI are found at most New Zealand stations. All have positive difference values except for −4 min at Tolaga Bay (station 4), with values of about 1 h or more at River Thames (6), Queen Charlotte's Sound (8) and Admiralty Bay (9). All differences, except for Tolaga Bay, which is already acceptable, reduce when modern HWFC is considered instead of MHWI.
An explanation for this improvement, which also applies to Success Bay (station 1), can be understood from Appendix A. It is partly due to the large age of the tide at some locations, being 62 h at station 1 and 87, 63, 57, 44, 67 and 49 h at stations 4–9 respectively, and also to the varying relative magnitude of S2 compared to M2. The improvement of using modern HWFC rather than MHWI is particularly marked at Queen Charlotte's Sound.
This improvement provides further evidence that Cook's high water times were indeed HWFC, rather than the MHWI implied by the statements in Moore (1800) and David (1988). Nevertheless, in spite of the improvement, all the differences between Cook's HWFC and the modern values are still positive, with the exception of Tolaga Bay.
We have investigated whether this positive difference could be an artefact of other tidal constituents around New Zealand, including especially N2 as mentioned above, but also the diurnal tides. As an example, Fig. 3 shows in red the predicted tide for 19–23 November 1769 at Rocky Point at the southern end of the Coromandel Peninsula at the head of what is now called the Firth of Thames. Cook was at the River Thames from the morning of 20 November to the afternoon of 23 November (civil dates). The red curve has been computed using 26 tidal constituents including N2. The contribution of the diurnal terms can be seen from the small amount of diurnal inequality. By contrast, the blue curve shows the predicted tide using just M2. There are large differences between the red and blue curves in the magnitudes of high waters. However, in spite of the importance of the other constituents, they are not large enough to make major changes in the predicted times of high tide.
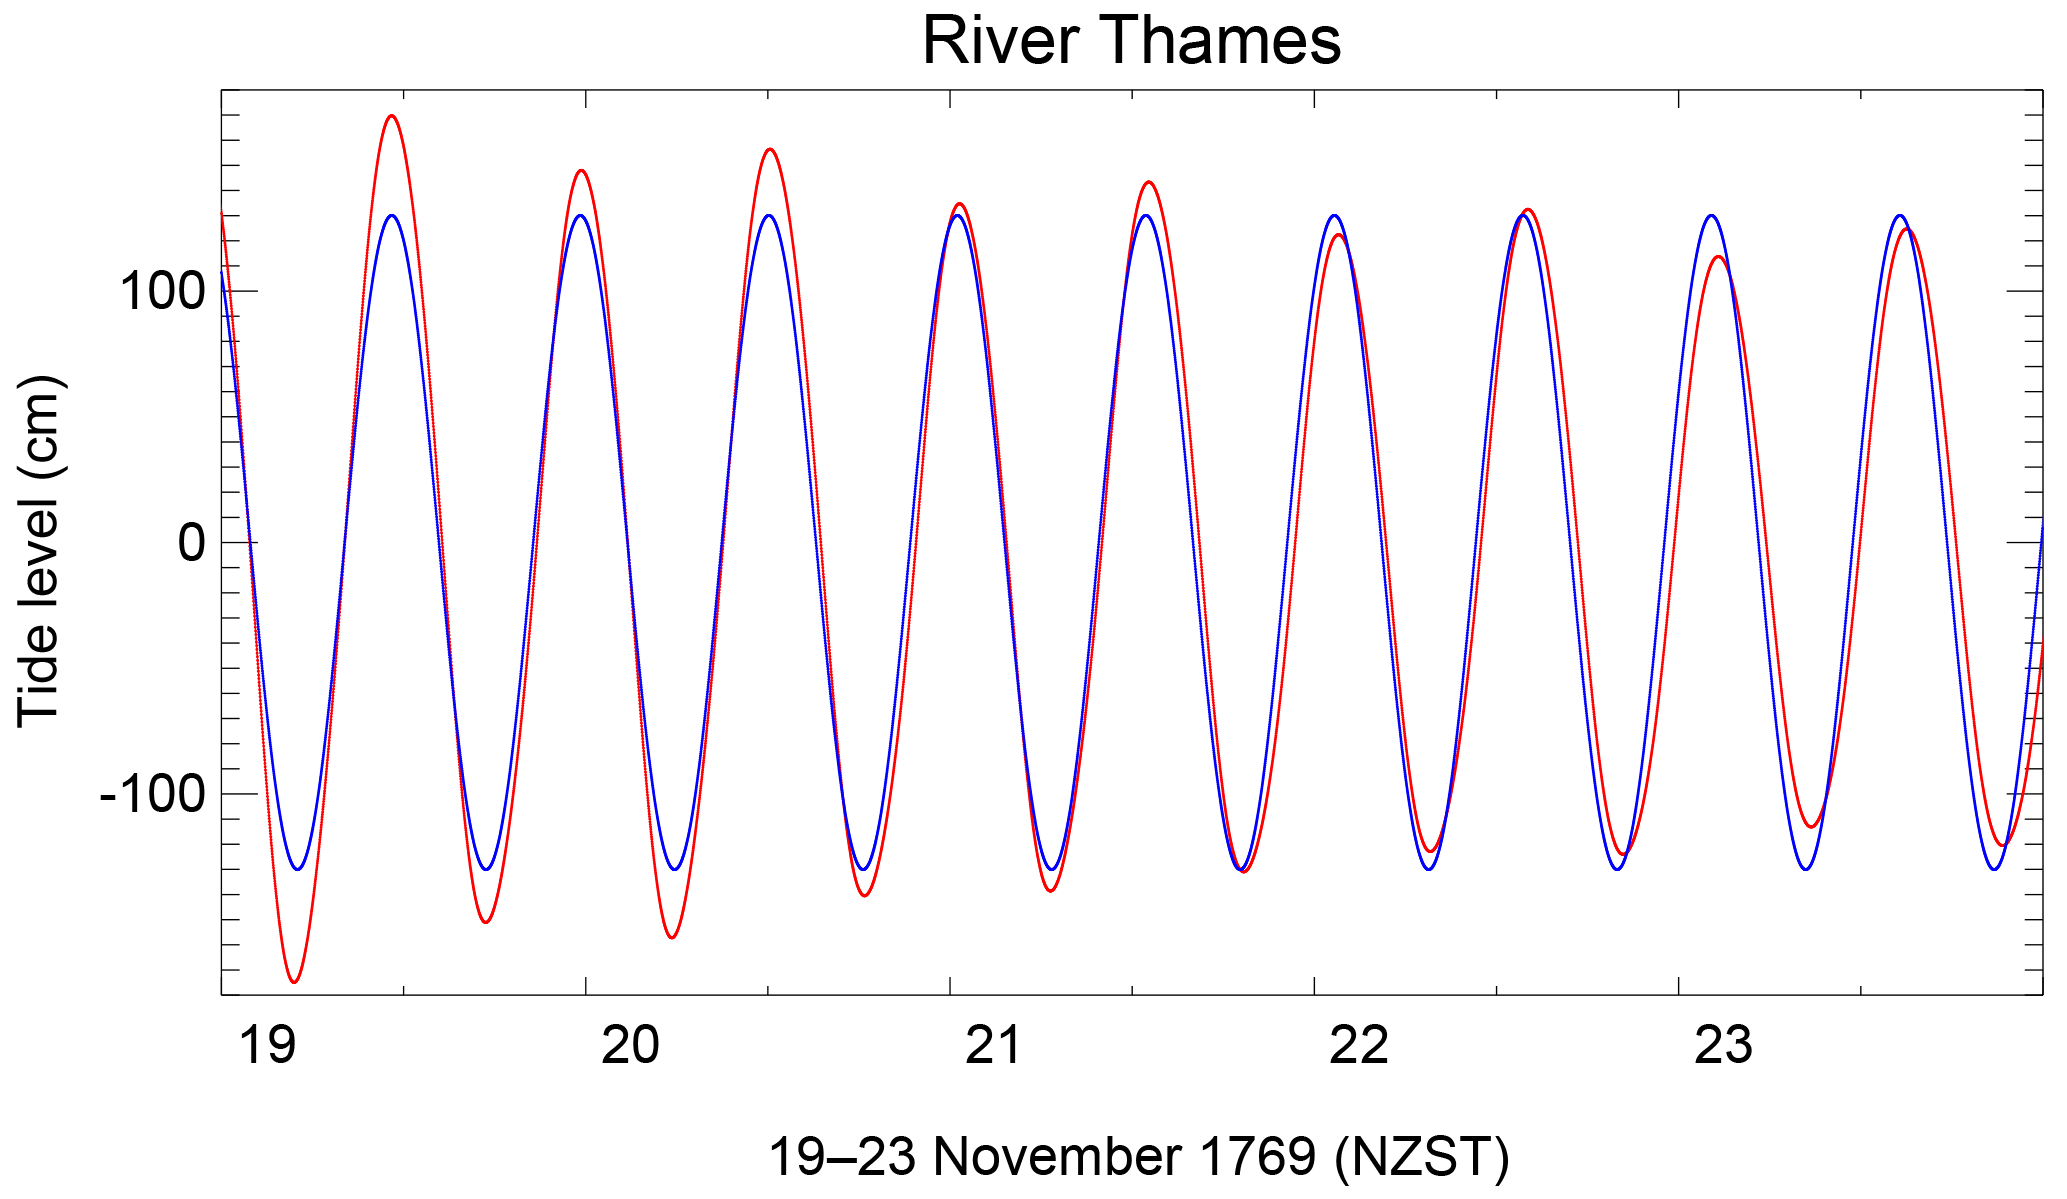
Figure 3The predicted tide during 19–23 November 1769 at Rocky Point at the head of the River Thames, New Zealand, using a full set of tidal constituents (red) or the M2 constituent only (blue). Mean time at this longitude (175∘31′ E) is 18 min behind New Zealand standard time (NZST), which is 12 h east of Greenwich.
If one computes the average difference between the times of high tide using the full set of constituents and those using M2 only, for the days that Cook was known to have been present, then one obtains values of ∼ 0.1 h for the six New Zealand stations. The average difference at River Thames is 5 min, within a range of −6 to +18 min for individual high tides. The largest average difference is at Bay of Islands (station 7), being −23 min within a range of −43 to +12 min for individual high tides. The average value has the opposite sign for explaining part of the positive difference between Cook's HWFC and the modern values.
Of course, Cook cannot have measured high water times continuously during his stay at each location, and probably his estimates will have been based on impressions on single days. However, without further details of when those observations were made, all we can say is that the existence of other tidal constituents cannot have been a major factor in the systematically positive differences.
Figure 3 can be used as a case study of the method we suggest Cook (and other captains) used to determine HWFC. For example, there was a high tide at 13.1 h on 21 November (NZST), which would have been 12.8 h mean time at the longitude of River Thames. This occurred just over 7 days since a full moon on 14 November. Therefore, 7×50 min gives about 5.8 h, which we have to subtract from 12.8 giving 7.0 h for estimated HWFC. This corresponds nicely to the value for HWFC computed “properly” in Table 3b.
Consequently, we do not understand why the HWFC reported by Cook is almost 2 h later than expected at River Thames, while the differences (also mostly positive) for the other New Zealand locations are more acceptable given that, as mentioned above, HWFC is a parameter that is anyway inherently accurate to only 25 min.
A part (perhaps ∼ 10 min) of the remaining difference at Mercury Bay, River Thames and Bay of Islands might be explained by Cook's measurements having been made in November and early December when the equation of time (the difference between apparent and mean time) would have introduced a small positive bias. In addition, spatial gradients in the tide (e.g. at Cook Strait, Bowman et al., 1980), and the fact that our modern stations will not have been located exactly at Cook's positions, will have introduced some differences. However, these are small factors compared to the estimated uncertainties in Cook's measurements, as shown above.
3.2.3 Australia
There is agreement within the anticipated uncertainties between Cook's HWFC and either MHWI or HWFC from modern constituents at most of the Australian stations (10–14). The age of the tide is closer to zero for the Australian stations, so the two modern parameters are similar. Bustard Bay (11) is the only one in Table 3b with a difference of about 1 h. Our values of MHWI and HWFC are similar to those reported by David (1988) at all five Australian sites, with the exception again of Thirsty Sound (12), where our value is in closer agreement with Cook's HWFC. Endeavour River (13) and Possession Island (14) are discussed in more detail below (Sect. 3.4 and 3.5).
3.3 Tahiti
At the end of Cook and Green (1771), there is a table that lists the heights and times of 16 high and 18 low waters at Matavai Bay on the north coast of Tahiti. This is the only publication we know of in which actual tidal observations are recorded. Therefore, there is some interest in taking a closer look at them.
Cook remarked that “The tides are perhaps as inconsiderable in these Seas as in any part of the world”. They were certainly small in comparison to, for example, the tides around the UK. However, there are many other locations in the Pacific with tides that are as small, or smaller, than those at Tahiti. The amplitudes of M2 and S2 at this location are both 7 cm, giving a spring range of 28 cm, which was just about measurable.
The 34 highs and lows in the table were obtained on 22 individual days within the period 4 June–5 July 1769, following completion of the observations of the transit of Venus. They were not measured every day but appear to have been obtained primarily on days when the small tide at Tahiti was at its largest (a range of ∼ 10 in., or 25 cm). For each of the 22 days, the times of lunar transit of the meridian are given, calculated by the Astronomer Royal Nevil Maskelyne, as shown by the initials N. M. following a paragraph below the table.
It is not stated explicitly whether the dates and times of lunar transit and of the high and low waters are according to local civil time, rather than using the naval or astronomical days. Therefore, a first task was to check the lunar transit times with the use of The Nautical Almanac (1769). For 20 of the days, the given times and our own calculations, expressed in local apparent time at Matavai Bay, agree to a couple of minutes, confirming that N. M.'s values are also in civil time. Two values on 19 and 20 June disagree by 23 and 8 min respectively, which we assume to have been errors by N. M. These errors have no impact on our conclusions below.
It is a bit harder to decide whether the high and low waters given in the table were also reported in civil time, rather than using the naval day (we disregard the possibility that the astronomical day was used for these). All the low waters were measured in the morning (AM) and, as explained above, dates for morning times are the same in the naval and civil day, so the low water measurements cannot help us decide between them. On the other hand, all except two of the high waters were made in the afternoon (PM), and so there is an uncertainty of 1 day for them, or say ∼ 50 min in the time of the tide.
Two simple things lead us to conclude that the high and low waters are also expressed in civil time. One is that the daily entry in Cook's journal for 13 April 1769 states,
as the Most material transactions at this Island must happen in the Day time … I shall during our stay at this Island but no longer reckon the day according to the civil account, that is to begin and end at midnight.
The other comes from inspection of the time difference between high waters when a tide in the morning or noon is followed by one in the afternoon, as occurs for 18/19 June and 2/3 July. In each case, an assumption of ship time would have two high tides separated by half an hour, which makes no sense.
A further test is to make use of tidal predictions of high and low waters for Matavai Bay in 1769 using modern tidal constants for Papeete. Constants for the four main constituents were taken from the ATT, and extra ones for K2 and N2 were inferred assuming equilibrium relationships to S2 and M2 respectively (Pugh and Woodworth, 2014). The extra ones allow for a slightly more complete description of the small tide at this location. These constants refer to time zone +1000 (i.e. 150∘ W), which is fortuitously almost the same as mean time at the longitude of Papeete (149∘34′ W) (a time difference less than 2 min). A comparison can then be made to the times reported in Cook and Green (1771), assuming that they are either in ship or civil time. The additional complication of Cook not incrementing his dates by one when he passed the 180∘ meridian is not relevant, as the meridian was not crossed until after visiting Tahiti.

Figure 4(a) Times of day of high (red) and low (blue) waters measured at Matavai Bay, Tahiti, by Cook and as predicted using modern tidal constants for Papeete, assuming the dates in Cook and Green (1771) had been reported using the civil day. Points with a circle indicate small predicted tides within 7.5 cm of mean sea level. (b) As (a) but assuming the dates were reported using the naval day (ship time). Note that the change between civil and naval day results in a different association of Cook times and predicted values, and as a result the set of encircled points in (a) and (b) is not exactly the same.
Figure 4a shows how the times of the tide measured by Cook correspond to predicted times, if one assumes that the former are in civil time. Low waters shown in blue are all in the morning, while high waters in red are mostly in the afternoon. The seven encircled points are when the predicted high or low waters are within 7.5 cm of mean sea level or, in other words, when that particular tide was so small that any estimate of its timing obtained by visual measurements is likely to have been highly imprecise. Maskelyne noted that
The times of high and low water seem to be subject to great irregularity on particular days; no doubt owing to the small rise of the water … which renders it more liable to be disturbed by the action of the winds and other causes: part of the irregularity may be attributed to the difficulty of observing the time of flood or ebb, with any degree of certainty.
If the morning and afternoon tides are considered together, then one could say that Fig. 4a shows a good correspondence between Cook's data and modern information. Most of the low waters lie below the diagonal. However, as mentioned above, all of them were made in the morning, for which there was no difference between the civil and naval days at Tahiti. Most of the high waters lie on or above the diagonal. The high water on 12 June, reportedly measured at 5:00 p.m. by Cook, is an obvious outlier, and in fact all three high waters measured late in the afternoon were obtained on days with little tide. Therefore, it would have been even more difficult to estimate the times of the turning points by eye on those days, especially in the presence of large waves.
It is interesting that a similar figure, assuming ship time used for the measurements, has most of the red dots move closer to the diagonal by about half an hour, resulting in a better fit with regard to high waters alone (Fig. 4b). However, in that case, when highs and lows are considered together, the mean difference between Cook and predicted times increases, resulting in poorer correspondence with modern information. Therefore, one concludes that, although the comparison is not as sensitive as one would like, it does once again support the measurements in the table of Cook and Green (1771) having civil dates and times.
Maskelyne made his own analysis of the data in the table. He appears to have assumed (as we have concluded) that civil times were used throughout and to have subtracted the lunar transit times from the times of high and low waters (i.e. as described by Moore, 1800). He concluded that high water came before lunar passage by about 45 min on average. We believe this to be essentially correct arithmetically (we calculated an average of 35 min). However, Maskelyne would not have appreciated that, given that the amplitudes of M2 and S2 are the same at Tahiti, priming and lagging of approximately ±3 h would have introduced a considerable uncertainty into any average time of high water relative to transit (see Appendix A). His estimate is confirmed by Fig. 4a, which has many of the red dots above the diagonal, with an average difference between Cook and predicted times of about half an hour. In other words, Cook's times of high water were too early. Similarly, the blue dots show most of Cook's reported times of low water as being too late.
So how did Cook arrive at a value for HWFC of half an hour after transit at new and full moons, as shown in Table 1? It seems that he had not arrived at this conclusion when at Tahiti, as (unusually) there is no mention of the range and time of the tide in his daily entries. One can speculate that he came to this conclusion back home. He knew full moon had been on 18 June and new moon on 3 July, and a selection from the small number of high water measurements around those dates could indeed support an estimate of half an hour after transit, within some scatter.
In summary, Maskelyne's conclusions from the available data were arithmetically sound. However, his findings on average timings would have been highly imprecise due to the priming and lagging. Somehow, Cook decided independently upon a value for HWFC that was different to Maskelyne's and was in fact closer to our modern knowledge of the tide at Tahiti. Presumably Maskelyne did not object to (or did not spot) Cook's Tahiti estimate when the table was sent to him for publication in Cook (1772).
3.4 Endeavour Reef and River
As the Endeavour sailed north along the coast of New South Wales and Queensland, it moved into waters where the diurnal components of the tide are more important than the semidiurnal components. The amplitude of the K1 constituent is 30, 28 and 19 % of M2 at the southern stations 10–12 respectively, but is 58 % at Cooktown (13) and 168 % at Possession Island (14). The diurnal tide was to play an important part in one of the most important events in the Endeavour's voyage, when the ship struck the Endeavour Reef a few minutes before 11:00 p.m. on 11 June 1770 (civil or naval date) at about high tide.
Cook lightened the ship by throwing water, cannon and other equipment overboard and waited for the next expected high tide at around 11:00 a.m. the following morning. The Endeavour failed to float, so he continued to lighten the ship and waited for the next high tide in the evening of 12 June. Finally, the Endeavour refloated at 10:20 p.m., just before the next high water, and sailed north along the coast for about 50 km until finding Endeavour River (station 13, modern Cooktown), where temporary repairs could be made (Beaglehole, 1955; Wikipedia, 2017).
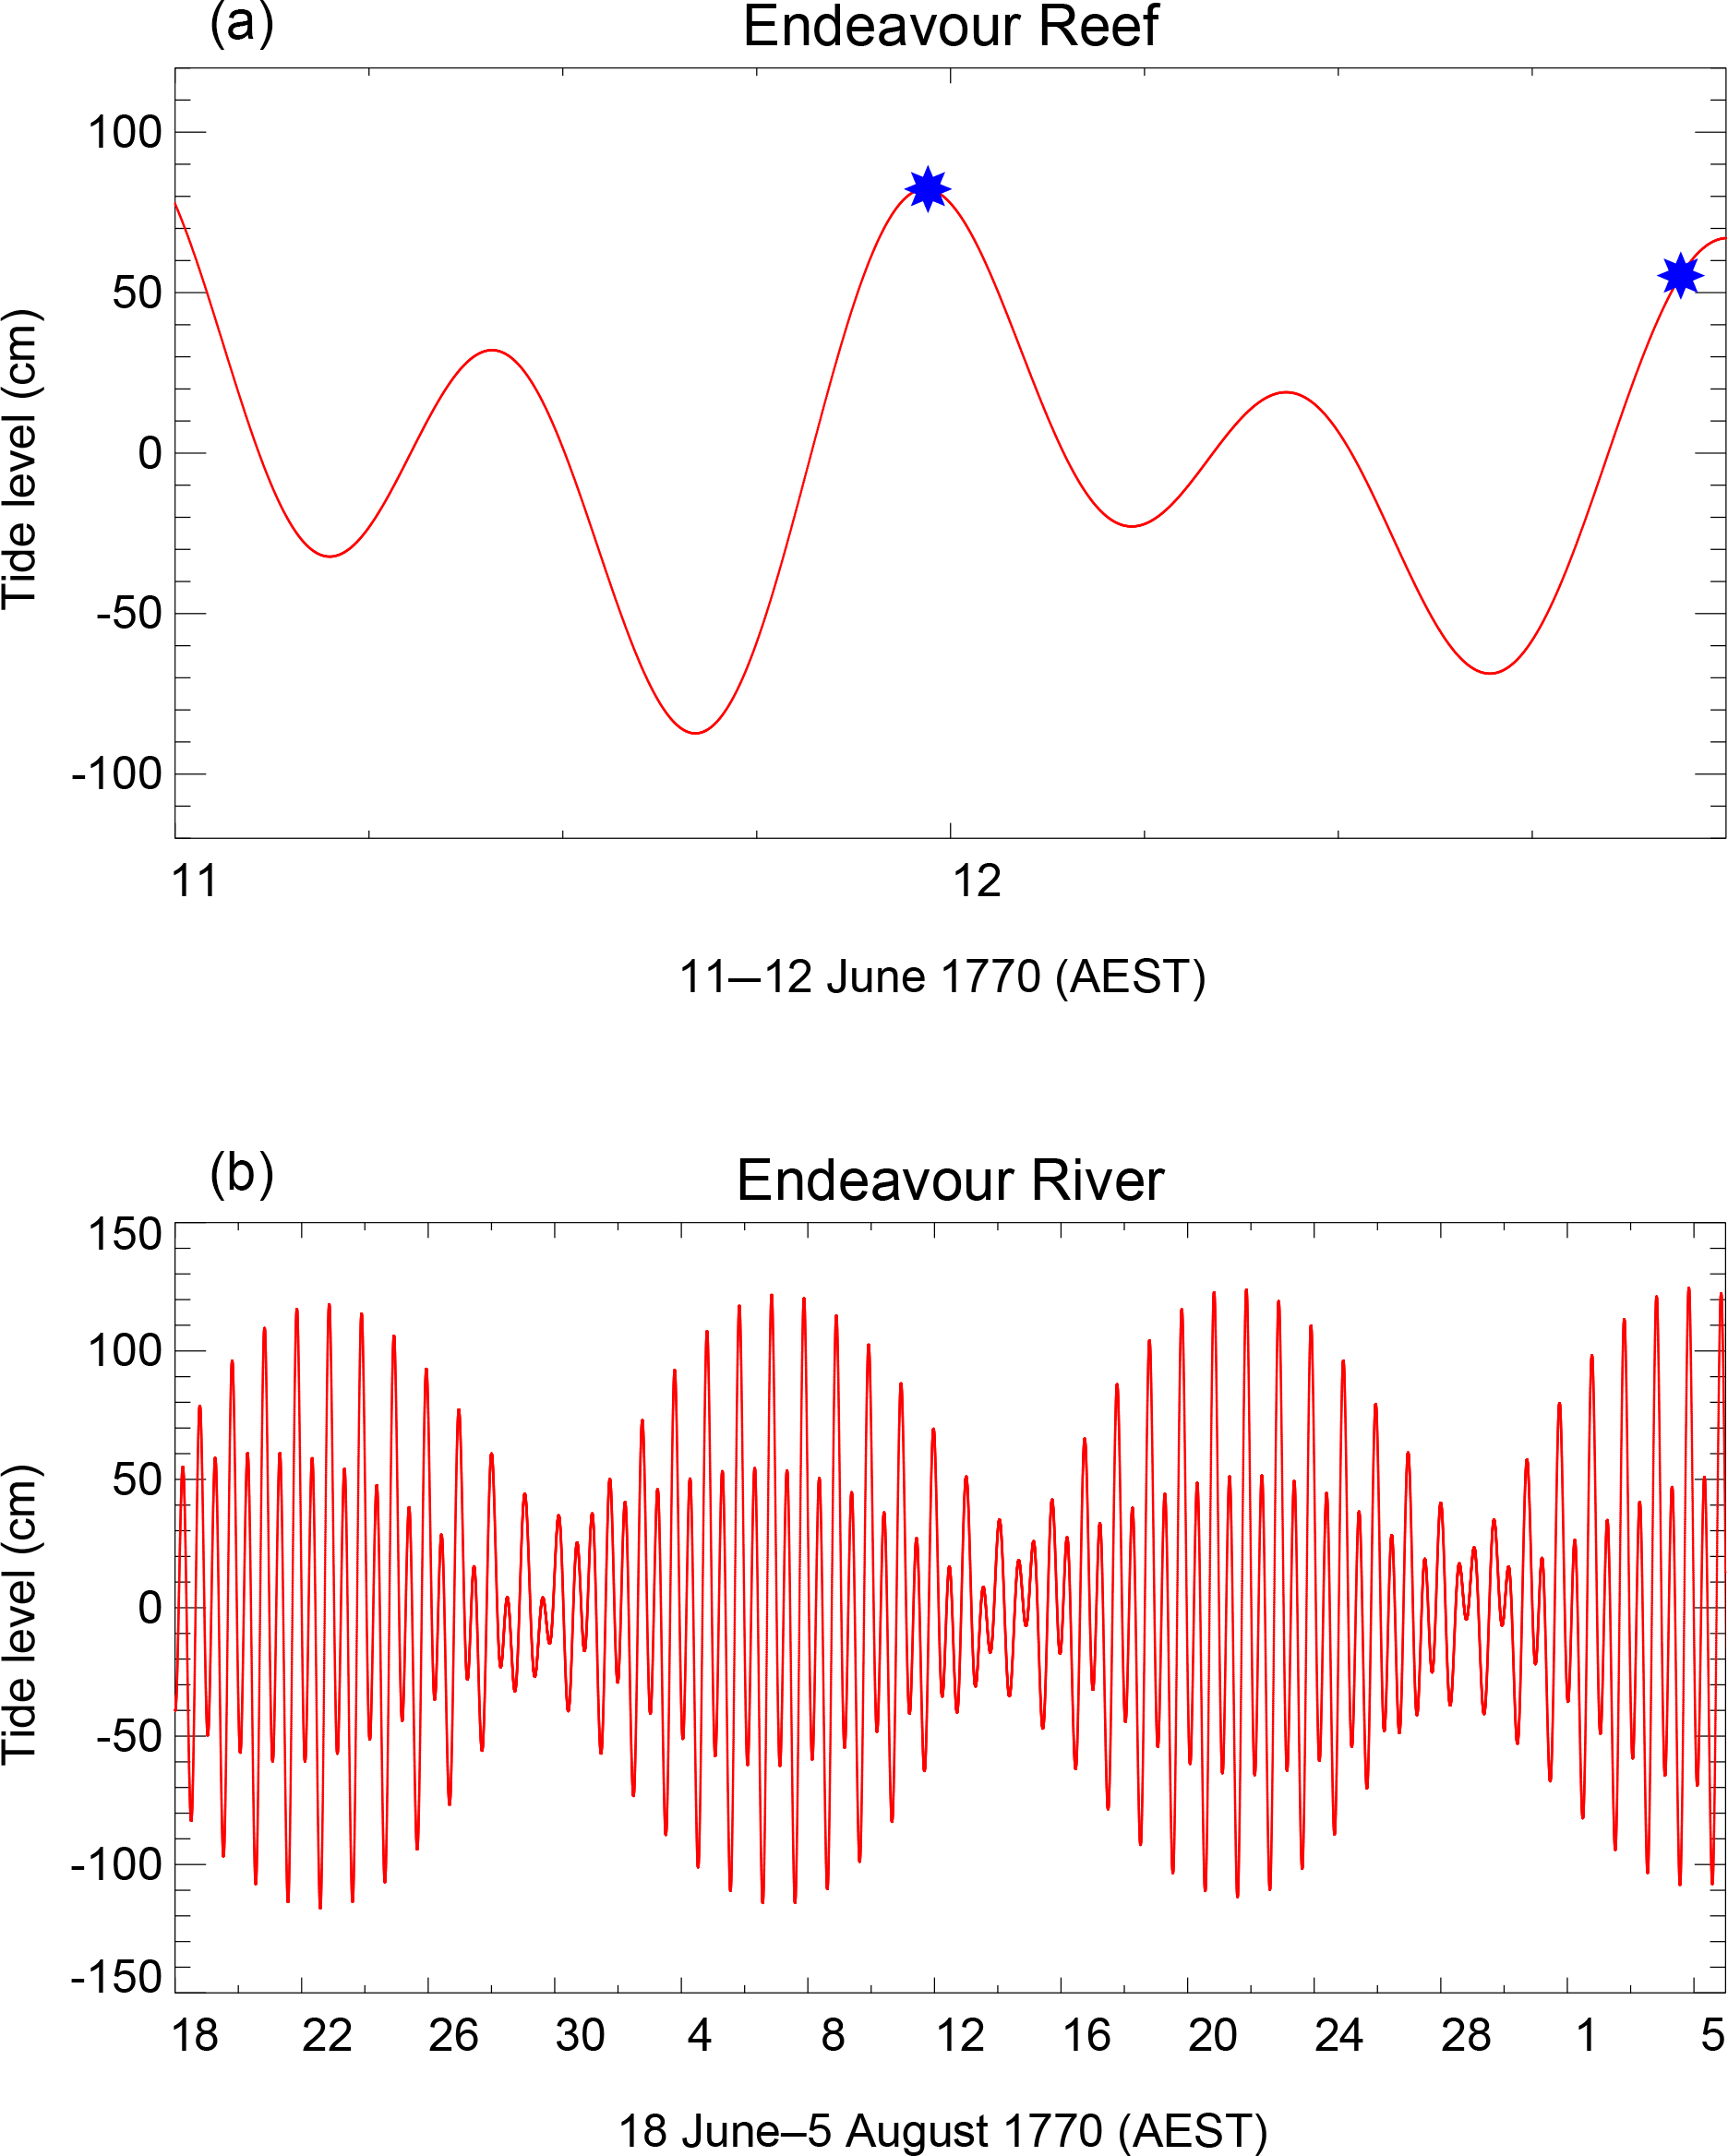
Figure 5(a) The tide at Endeavour Reef on 11–12 June 1770 using tidal constants from Cooktown. Mean time at this longitude (approximately 145.5∘ E) is 18 min behind Australian eastern standard time (AEST), which is 10 h east of Greenwich. The blue stars indicate when the Endeavour struck the reef and was refloated. (b) The tide at Endeavour River (Cooktown) during 18 June–5 August 1770.
Cook reported on these events, and on subsequent observations of the tide at Endeavour River, in a letter to Sir John Pringle, published in edited form in Cook (1776) (see also Beaglehole, 1955). He remarked that the 11:00 a.m. tide had failed to rise as much as expected by about 2 ft and that they now had no hope but to rely on the evening tide, which was
only founded on the generally received opinion among seamen, that the night tide rises higher than the day tide.
In the event, the seamen's opinion was correct for this location and this time of year (although not correct generally), and the ship refloated a “full hour before high water”.
The state of the tide during 11–12 June can be demonstrated using modern tidal constants. Figure 5a shows that a contributing factor in the ship not floating on the 11:00 a.m. tide was what became known as “diurnal inequality”, in which a larger/smaller semidiurnal high water tends to be followed by a smaller/larger high water. Figure 5a indicates that the morning tide was 63 cm (2.1 ft) less than the preceding evening one, confirming Cook's estimate of 2 ft. There are also differences between high tides separated by a day, and Fig. 5a shows that high water at midnight on 12–13 June was in fact 15 cm (6 in.) less than the day before, when the Endeavour had struck. Of course, the ship was by now much lighter.
Cook pursued his interest in diurnal inequality during the stay at Endeavour River during 18 June–5 August, spanning more than three spring–neap cycles. He remarked that HWFC was about 9 h, 15 min, and that the “height” (range) of the evening tide at springs was about 9 ft (274 cm) but the morning tide was “scarce 7 ft” (213 cm). At neap tides there was no perceptible difference between the morning and evening tides. Figure 5b shows that these observations were qualitatively correct (for spring tides at least).
Badger (1970) uses Cook's interest in diurnal inequality at Endeavour River as an example of “Cook the scientist”. The reasons for diurnal inequality were not fully appreciated at the time, although 18th century tide table makers knew that the seamen's belief was incorrect and that the difference between morning and evening tides had a seasonal dependence (Woodworth, 2002). Researchers began to appreciate the role of lunar declination in producing diurnal tides and the reasons for their seasonal variation via solar declination (Thomson, 1819), and diurnal inequality was to become one of the main tidal research topics of the 19th century (Whewell, 1848; Cartwright, 1999).
3.5 Possession Island
Possession Island (station 14) is located in Torres Strait, off the north coast of Queensland. This is the location where Cook took formal possession of the whole east coast of Australia in the name of King George the Third just before sunset on 22 August 1770. The tides in this area vary considerably spatially. However, only one set of constants is available from near the landing site from which we can make a modern comparison to Cook's tidal information. This set originated from the UKHO in 1925 and is still included in the catalogues of constants in the ATT and ANTT. A version of this set was provided to us by the National Tidal Unit of the Australian Bureau of Meteorology and consists of constants for seven constituents (M2, S2, N2, K2, K1, O1 and P1). The largest amplitude is that of K1 (51 cm), compared to 30 cm for M2, and that of S2 (38 cm) is also larger than M2. It was almost certainly the same set of constants used by the UKHO, reported in David (1988), as can be seen by comparison of the modern range and UKHO columns of Table 3a.

Figure 6The tide at Possession Island at the end of August 1770. Mean time at the longitude of Possession Island (142∘42′ E) is half an hour behind AEST.
It will be recalled that the “modern range” in Table 3a is calculated from M2 and S2 amplitudes only. However, the tide at the end of August, computed using all seven constituents, will have looked more like Fig. 6, which demonstrates the relative importance of the diurnal terms. David (1988) reported that the tide rose 5.5 ft (168 cm) on the day Cook landed (22 August); that is not too different from our own calculation of 159 cm in Fig. 6. New moon had occurred the day before, so one might have expected Cook to report a rise and fall of about 5.2 ft (160 cm). However, Cook instead reported a value of 11 ft (335 cm). David (1988) suggests that
being an astute observer, he could well have noticed that the tide actually rose considerably less than tide marks on the rocks and adjusted his observations accordingly to a value closer to the extreme rise of tide given by the tide marks.
The daily entries do not confirm that this is indeed what happened. However, this suggestion is consistent with the total tide predicted for only a couple of days before (Fig. 6), when the range had a value of 303 cm (or almost 10 ft), and which could well have been the reason for any such tide marks.
The character of the predicted tide around 19 August demonstrates again the importance of the diurnal constituents in this area, with diurnals becoming even more dominant as one travels SW into the Gulf of Carpentaria (Pugh and Woodworth, 2014, chap. 1). Possession Island serves as a further example of the limitations of describing the tide simply in terms of spring range and HWFC in parts of the world where the tidal regime is not predominantly semidiurnal.
3.6 Other tidal mentions in Cook's daily entries
The daily entries in Cook's journal contain several other mentions of the magnitude of the tide at Madeira (M) and three locations in Queensland (Keppel Bay, K; between Cape Palmerston and Cape Hillsborough, C; and Repulse Bay, R), which are shown in Fig. 1. Each mention is given in Appendix B, together with comments based on modern knowledge of the tide. Cook's measurements can be seen to be in reasonable agreement with modern information.
The daily entries in Cook's journal contain several mentions of major currents, which form part of the global ocean circulation, and many references to tidal currents, although few of them could be said to have quantitative scientific value. For example, on 25 January 1769, when the Endeavour was south of Cape Horn passing east to west through the Drake Passage:
Between Strait Le Maire and Cape Horn we found a Current Seting generally pretty Strong to the N. E. when we was in with the Shore but when 15 or 20 Leagues off we was not sencable of any.
This was probably an observation of a northern branch of the Antarctic Circumpolar Current (Meredith et al., 2011). A few days earlier, on 13–14 January 1769, Cook had commented on difficulties with tidal currents in passing through the Le Maire Strait between Staten Island and Tierra del Fuego.
There are many more examples from when the Endeavour was at New Zealand and Australia. On 5 December 1769, when at the Bay of Islands on the NE coast of North Island, New Zealand, Cook remarked,
I have lately had reasons to think that there is a Current which comes from the westward and sets along shore to the SE ∧or SSE as the Land lays.,
and when slightly further north, on 18 December 1769, Cook remarked,
and the Ship ∧fell fast to leeward occasioned as we thought by a Current seting to the Eastward.
These remarks were consistent with observations of the East Auckland Current, which originates from tropical waters driven by the wind down the east coast of Australia and then flows in an eastward direction across the Tasman Sea (see Fig. 2 of Lumpkin and Johnson, 2013). The current flows south-east along the north-east coast of New Zealand with speeds up to 50 cm per sec (∼ 1 kn) (Te Ara, 2017).
As Table 2 shows, the tides around New Zealand are modest compared to those around the UK, for example. Tidal currents are generally about 2 km h−1 (1 kn) with the major exception of Cook Strait, where tidal currents can be stronger (RNZN, 1993; LINZ, 2017; Te Ara, 2017). For example, when at Queen Charlotte's Sound on 6 February 1770, and about to sail east through Cook Strait, he remarked,
In sailing in or out of this Sound with little wind attention must be had to the Tides which flows 9 or 10 oClock at the full and change of the Moon and rises and falls upon a perpendicular 7 or 8 feet. The flood comes in through the Strait f∧rom the SE and sets strong over upon the NW head and the reef laying off it, the Ebb sets with great rapidity to the SE over upon the Islands and rocks lying off the SE head.
There was a more dramatic entry in Banks' journal:
now we were sensible of the force of the tide which roard like a mill stream and ran at 4 knotts at least when it came in its strongest pushes, for it varied much.
After the entry for 23 August 1770 in Cook's journal, when the Endeavour had passed through Torres Strait, summaries of his experiences along the east coast of Australia can be found. These include remarks on the appearance of the country, its soil and produce, any plants, animals, birds and fish, and the people and their language. The summaries conclude with remarks on the tides and the currents that had been encountered along this coastline.
Cook remarked that, between 32∘ and 24∘46′ S (roughly between Botany Bay and Bustard Bay),
We constantly found a Current setting to the Southward at a rate of about 10 or 15 Miles per day more or less according to the distance we were from the land, for it runs stronger in shore than in the offing: all this time I had not been able to satisfy my self whether the Flood Tide came from the Southward Eastward or Northward but judged it to come from the SE.
This was an observation of the East Australian Current, the western boundary current of the Tasman Sea, which at some locations flows at speeds up to 90 cm per sec (78 km or 48 miles per day) according to Ridgway and Dunn (2003). AHS (2017) suggests a slightly stronger current, flowing south from the Coral Sea along the edge of the continental shelf at about 0.5 kn, increasing to 2–3 kn along most of its length. The strength is reduced south of 32∘ S by branches into the easterly flow across the Tasman Sea.
There followed a somewhat inconclusive set of remarks on the spatially varying character of the direction of tidal streams (“flood tides”). He commented on the anomalous flood tides that can be experienced in inlets and river estuaries, as well as within the reefs rather than in deeper water. Cook had relatively little difficulty in Torres Strait, one of the most complex areas in the world for tidal streams, where currents of about 8 kn can occur and long- and short-term fluctuations of mean sea level gradient through the strait result in variability in mean flows (AHS, 2017).
Cook's summaries concluded with remarks on the diurnal character of the tide at Endeavour River,
the difference between the perpendicular Rise of the Night and Day Tides is not less than 3 feet … perhaps it is more so to the Northward than to the southward,
which we have discussed above. In this northern part of the coast, he observed that the flood “sets to the NW, to the extremity of New-Wales, from thence West and SW into the India Sea”. These remarks are generally consistent with the increasing importance of diurnal tides in the north of “New-Wales”, and with the propagation of the diurnal tides northward, in the opposite direction to the semidiurnal components. These directions of propagation are characteristic features of the tides of the Tasman Sea between Australia and New Zealand (Ray, 1999; Walters et al., 2001).
As a by-product of our tidal research, and as another test of the care that Cook took with all his measurements, we have also investigated how well Cook's hydrographic measurements compare to modern bathymetric information for several locations in New Zealand. Of course, Cook was already known to have excellent skills in marine surveying (Ritchie, 1978). Our comparisons provide further examples.
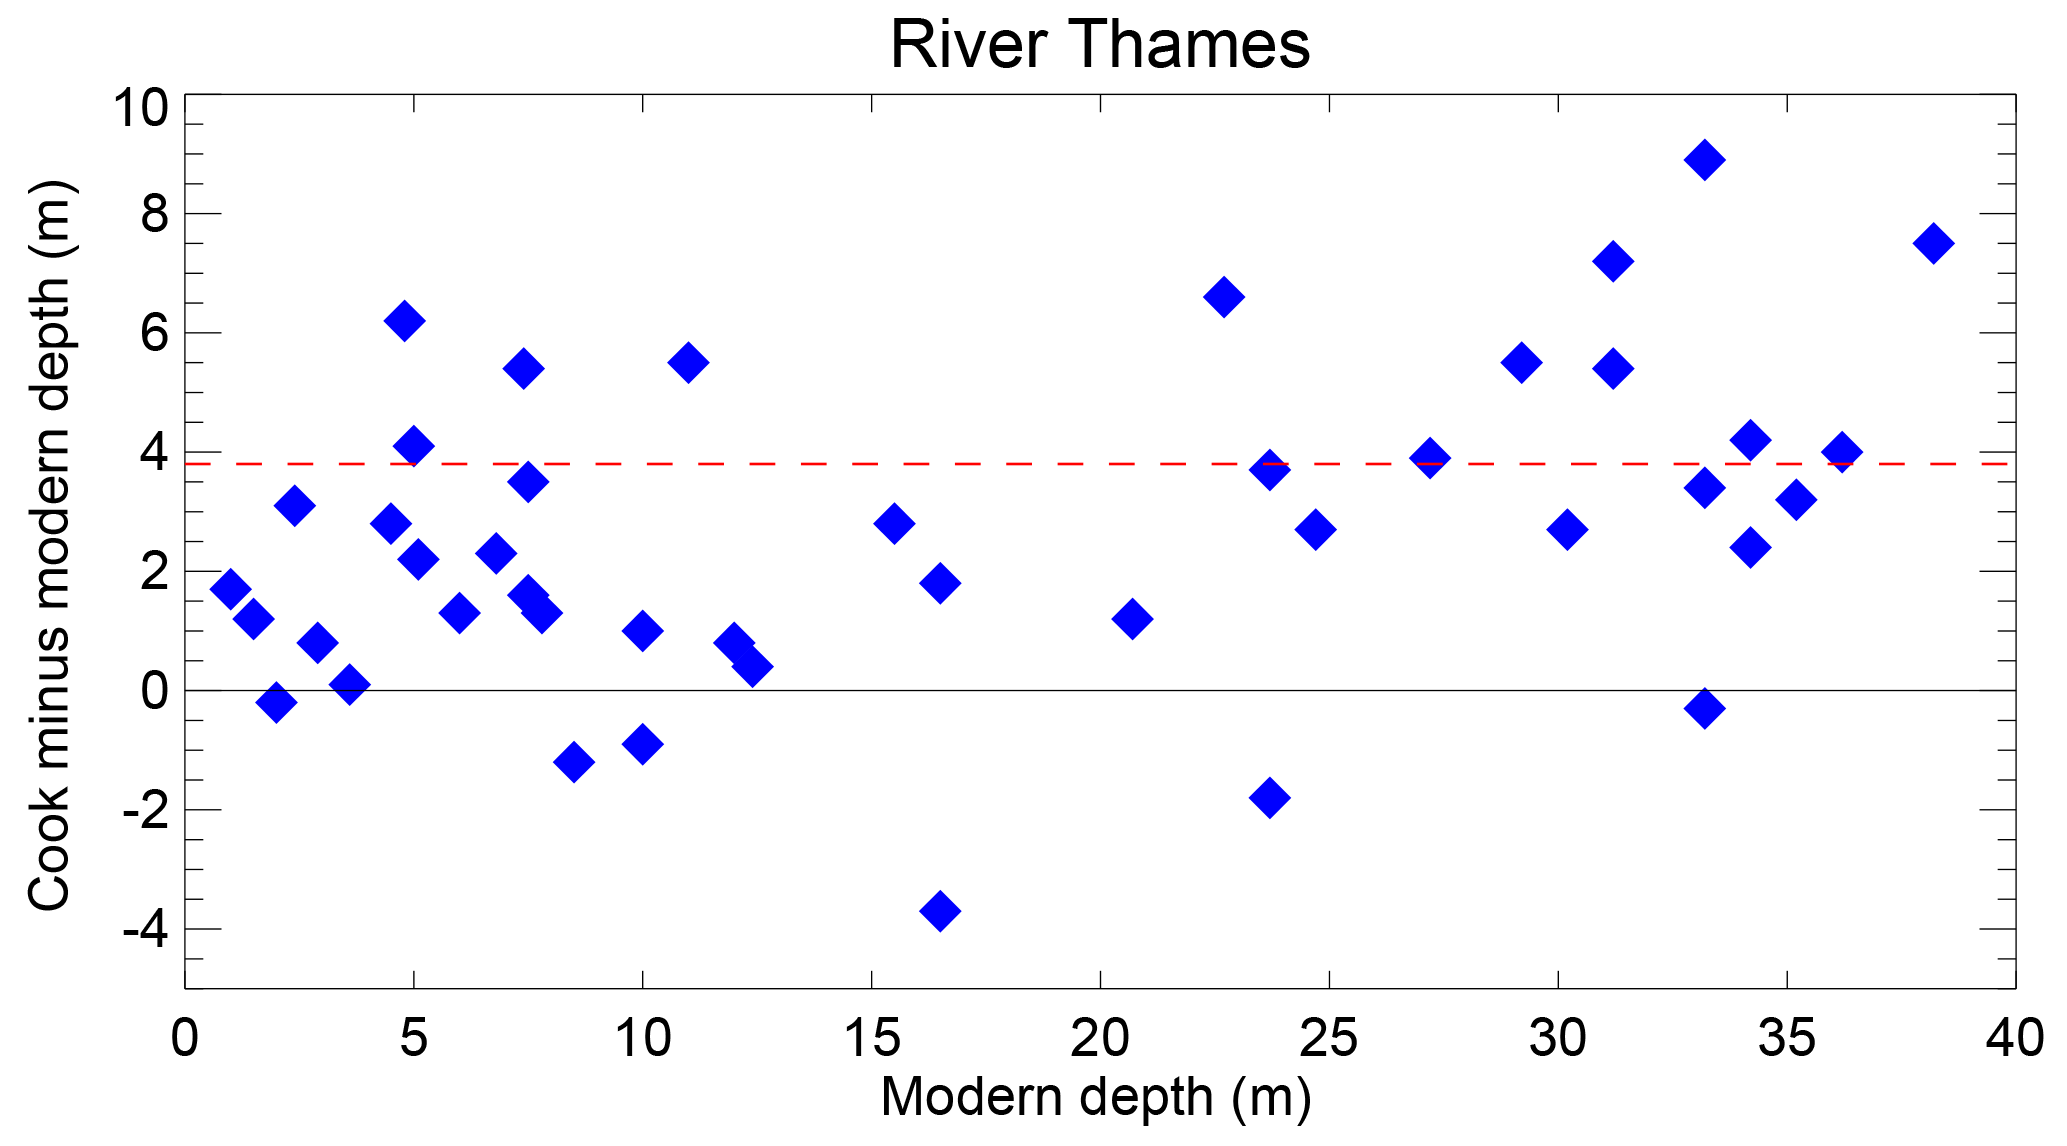
Figure 7Differences between depths measured by Cook and those obtained from modern soundings at River Thames. Positive values indicate that Cook's depths were greater than modern values. Cook's values will have included the height of the tide at the time, whereas the modern depths are expressed relative to sounding datum (within a few centimetres of Lowest Astronomical Tide). The maximum height of the tide above sounding datum during the period that Cook was at River Thames is indicated by the red dashed line.
Figure 7 shows differences between depths measured by Cook at River Thames and those obtained from modern soundings. Cook's values will have included the height of the tide at the time, whereas the modern depths are expressed relative to sounding datum (within a few centimetres of Lowest Astronomical Tide). The maximum height of the tide above sounding datum during the period that Cook was at River Thames is indicated by the red dashed line. Therefore, if there had been no changes in depth between Cook's time and the present, then the differences should in principle fall between zero and the red dashed line. Many values are indeed within this range, with some scatter outside these limits. Overall, one can appreciate that Cook's survey provided excellent information on the shape and depths of River Thames. Further details on methods and findings for four other locations in New Zealand may be found in the Supplement.
We have made an assessment of the quality of Cook's tidal measurements during the Endeavour voyage by comparison to modern measurements, and with an assumption that the tides have not changed materially in the last two and a half centuries. At best, Cook's measurements were accurate to about 0.5 ft in height and 0.5 h in time, although we have pointed to some anomalous measurements which can probably be explained by the short stays of the Endeavour at some places. They were good enough (or unique enough) to be included in compilations of tidal information in the 18th century (Lalande, 1781) and in the construction of the first tidal atlases during the 19th century (Whewell, 1833). In most cases, they support Cook's reputation as a good scientific observer.
The study raised the question of how captains such as Cook, on voyages to remote parts of the world, would have estimated HWFC during short stays at newly discovered locations. We find it hard to see how they would have used the method described by Moore (1800), proposed by David (1988), which would have required access to The Nautical Almanac and some knowledge of how to use it. We believe that the method simply involved adjusting by 50 min for every day since (or until) the last (or next) new or full moon. In addition, it is unclear how Cook and other captains would have estimated spring range reliably, if stays had not lasted a fortnight (although it seems reasonable to assume that any visible tide marks might have been taken into account). These aspects of maritime practice in the 18th century would be good topics for further research. Further work would also include more detailed analyses of the tides recorded during Cook's second and third voyages. These have already been summarised by David (1992, 1997). They included further measurements at Tahiti, in order to better understand the small tide, and observations of the diurnal tides of the North Pacific. These measurements were made by Cook's officers as well as by Cook himself. Therefore, they do not provide a set of information as focused on Cook himself as do those of the Endeavour voyage.
Cook's measurements have little scientific value nowadays, other than in their historical importance. However, one must recall that they were the first from what were very remote locations, and that in fact they were correct within the accuracies that Cook would have claimed for them. At a technical level, they provide useful examples for demonstrating the limitations of the tidal parameters in common use during the 18th century (spring range and HWFC), especially where diurnal and shallow-water components are important. Although Cook's tidal measurements represent only a tiny fraction of his discoveries, and those of Banks and others on the Endeavour, it is appropriate that his measurements be discussed and analysed once again on the 250th anniversary of this remarkable voyage.
All the tidal data discussed in this paper are provided in Tables 1–3. The historic and modern bathymetric data used in Fig. 7 and discussed in the Supplement were obtained from the published sources given.
In this Appendix, we assume the tide to be composed of a semidiurnal lunar tide (M2) and a semidiurnal solar tide (S2). Figure A1 shows the lag between the passage (transit) of the moon across the local meridian and the next high water, compared to the average lag over a spring–neap cycle, assuming a magnitude for S2 relative to M2 of 0.46. The average lag is called the mean high water interval (MHWI) or corrected establishment. In the first part of the plot between springs and neaps, the high tides occur earlier than usual, which is called tidal priming or tidal leading. In the second part, they occur later than usual, which is called tidal lagging. The lags at spring high water and at new moon in this example are shown by the red and blue dots respectively, while time zero is chosen to be at spring tides.
The lag at new moon is called high water full and change (HWFC) or vulgar establishment. HWFC is larger than MHWI by about half an hour if the age of the tide (the time between new moon and spring tides) is about 2 days, which is the situation at many locations around the world.
Following Doodson and Warburg (1941), the various parameters are related as follows:
where κ(M2) is the phase lag of M2 and s(M2) is its angular speed. One then defines
and
A value of D of 0.46 was used for Fig. A1. One can then compute
and then
and
This difference is therefore zero whenever d or D are zero. Finally, we have
It can be seen that the difference between the phase lags of S2 and M2 and the relative values of their amplitudes determine the difference between HWFC and MHWI, while the former alone determines the age of the tide. For more details, see Doodson and Warburg (1941) or Pugh and Woodworth (2014).
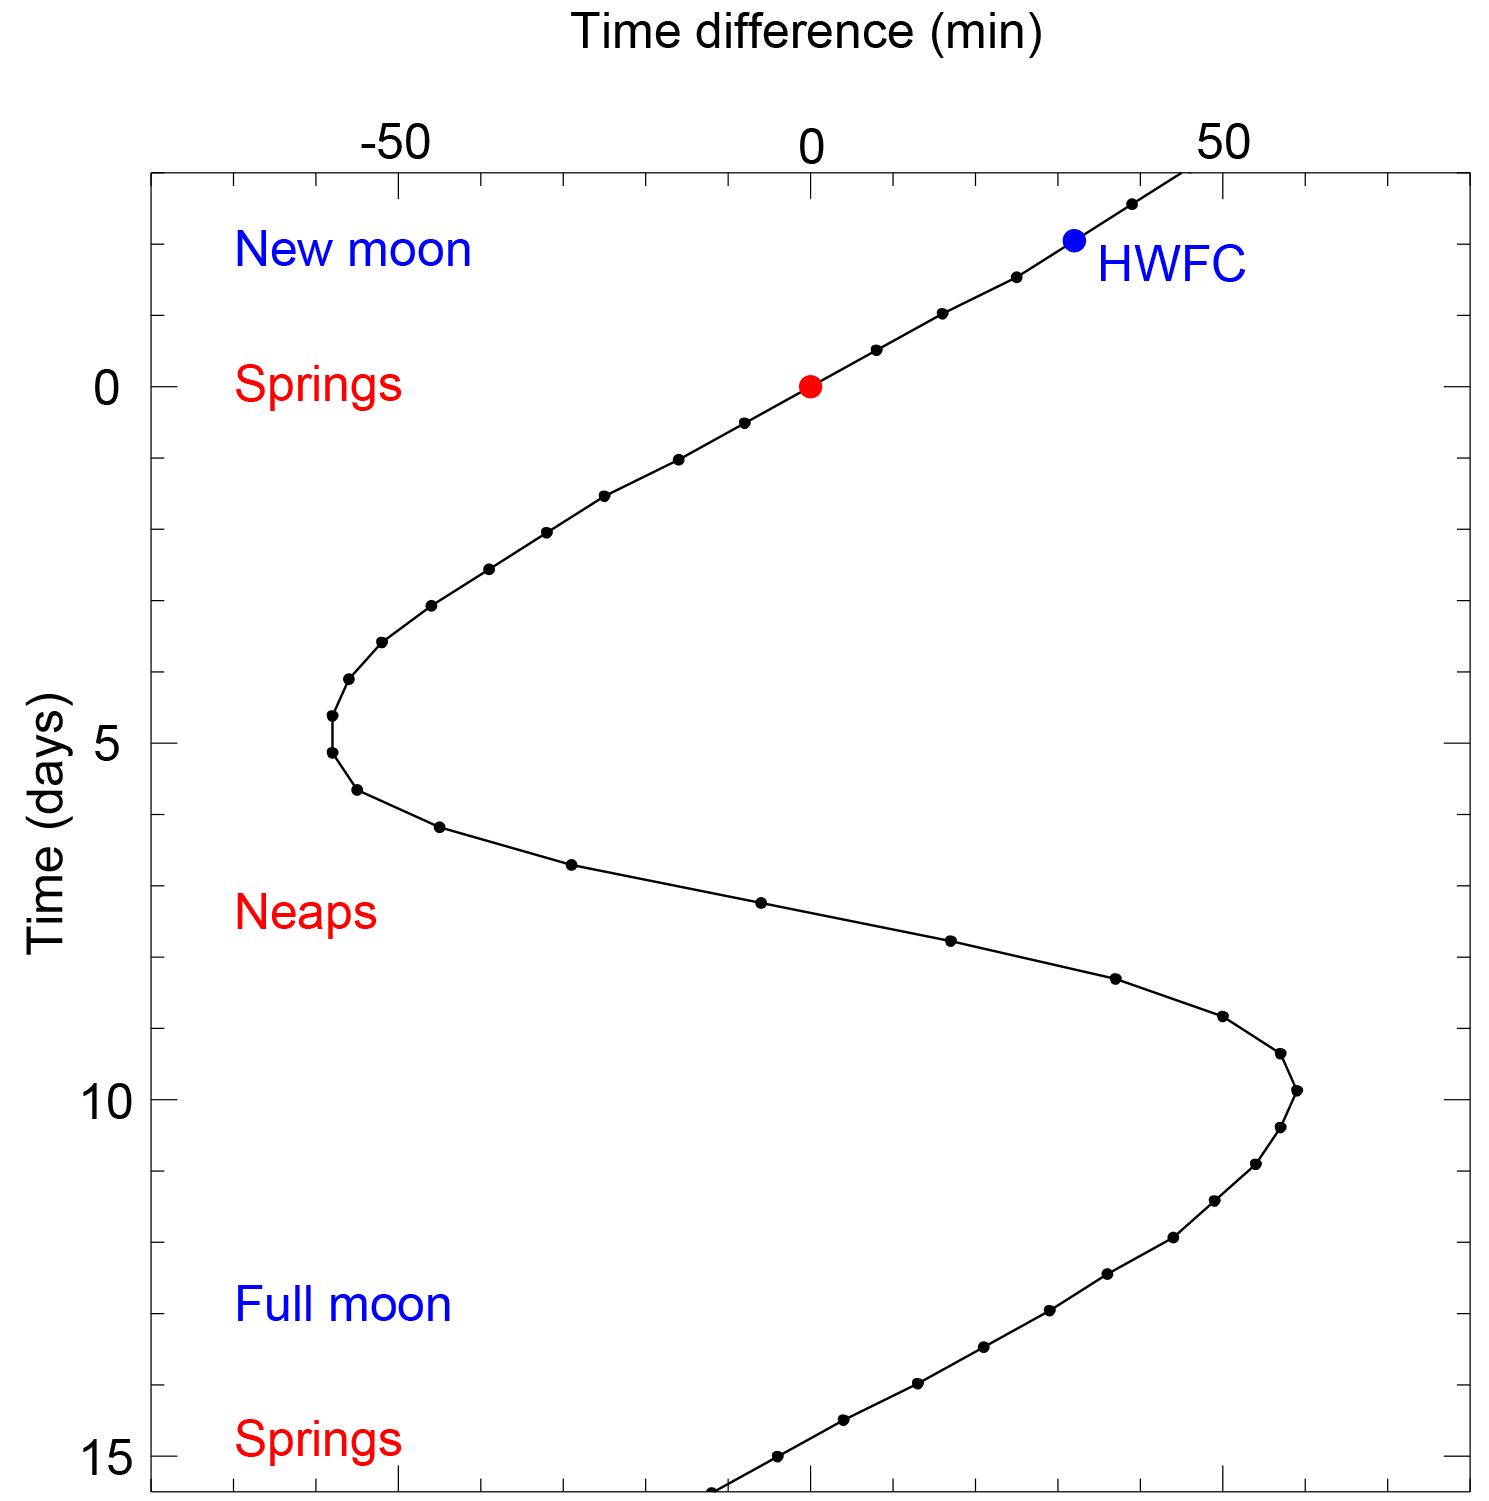
Figure A1The lag between the passage of the moon across the local meridian and the next high water, compared to the average lag over a spring–neap cycle, assuming a magnitude for the semidiurnal solar tide (S2) relative to semidiurnal lunar tide (M2) of 0.46. The red and blue dots show the lags at spring high water and at new moon respectively, while time zero is chosen to be at spring tides. Adapted from Fig. 3.14 of Pugh and Woodworth (2014).
Dates given below are civil dates. The locations M, K, C and R are shown in Fig. 1.
B1 Fenchal Road (Funchal, Madeira) (M)
Cook's journal entry for 18 September 1768 states, “The Tide … rises perpendicular 7 feet at spring Tides and 4 feet at Neep-tides”, i.e. 213 and 122 cm respectively. ATT constants for Funchal have M2 and S2 amplitudes of 72 and 27 cm respectively, giving spring and neap ranges of 198 and 90 cm.
B2 Keppel Bay (central Queensland at the mouth of the Fitzroy River) (K)
The journal entry for the night of 26/27 May 1770 states “In the night we found the tide to rise and fall near 7 feet”. The Endeavour
Anchor'd in 12 fathom water, Cape Capricorn bearing S 54∘ East distant 4 Leagues having the Main land and Islands in a manner all round us,
which places the anchorage off the north coast of Camp Island. Tidal predictions using ATT constants for Cape Capricorn show high tide at about 10:00 p.m. (AEST) on 26 May with the next low tide around 4:30 a.m. on 27 May. High to low water was about 10.7 ft. This is a little more than Cook observed, assuming his rise and fall really meant the range from high to low.
B3 Between Cape Palmerston and Cape Hillsborough (central Queensland) (C)
The journal entry for the night of 2/3 June 1770 states the following:
At 1 oClock it was Slack ∧or low water and at 1∕2 past 2 oClock the Ship tended to the Eastward and rode so untill 6 at which time the tide had risen 11 feet.
Tidal predictions using ATT constants for Mackay show low tide at about 1:00 a.m. (AEST) on 3 June with the next high tide around 7:00 a.m. on 3 June. Low to high water was about 8.5 ft, which is similar to Cook's observation.
B4 Repulse Bay (central Queensland) (R)
The journal entry for the night of 3/4 June 1770 states the following:
we at 8 oClock came too an Anchor in 10 fathom a muddy bottom. Two hours after this we had a tide seting to the nortward and at 2 oClock it had fell fall∧en 7 9 feet and a half sence the time we anchor'd.
Tidal predictions using ATT constants for East Repulse Island show high tide at about 7:00 p.m. (AEST) on 3 June with the next low tide around 1:00 a.m. on 4 June. High to low water was about 8.6 ft, which is consistent with Cook's observation.
The supplement related to this article is available online at: https://doi.org/10.5194/hgss-9-85-2018-supplement.
The authors declare that they have no conflict of interest.
This article is part of the special issue “Developments in the science and history of tides (OS/ACP/HGSS/NPG/SE inter-journal SI)”. It is not associated with a conference.
We are grateful to Cliff Thornton (former President of the Captain Cook
Society), Wayne Orchiston (University of Southern Queensland) and Andrew
David for information on Cook's voyages. Bill Mitchell from the Australian
Bureau of Meteorology is thanked for tidal information from Australia. This
work was undertaken when Philip Woodworth was an Honorary Research Fellow at the National
Oceanography Centre in Liverpool. Part of this work was supported by UK Natural
Environment Research Council National Capability funding.
Edited by: Mattias Green
Reviewed by:
Christopher Jones and one anonymous referee
AHS: Seafarer's handbook for Australian waters (AHP20), Australian Hydrographic Service, 308 pp., 2017.
AHS: Australian National Tide Tables (AHP11), Australian Hydrographic Service, 2018.
Badger, G. M. (Ed.): Cook the scientist, in: Captain Cook Navigator and Scientist, Canberra, Australian National University Press, 30–49, 1970.
Beaglehole, J. C.: The journals of Captain James Cook on his voyages of discovery: I. The voyage of the Endeavour 1768–71, London, The Hakluyt Society, 684 pp., 1955.
Beaglehole, J. C.: The Endeavour journal of Joseph Banks, 1768–1771 (two volumes), 2nd edn., Sydney, The Trustees of the Public Library of New South Wales in association with Angus and Robertson, 1963.
Bell, C., Vassie, J. M., and Woodworth, P. L.: The Tidal Analysis Software Kit (TASK Package), TASK-2000 version dated December 1998, Liverpool, National Oceanography Centre, 1996.
Bowman, M. J., Kibblewhite, A. C., and Ash, D. E.: M2 tidal effects in greater Cook Strait, New Zealand, J. Geophys. Res.-Oceans, 85, 2728–2742, https://doi.org/10.1029/JC085iC05p02728, 1980.
Cartwright, D. E.: Tides: a scientific history, Cambridge, Cambridge University Press, 292 pp., 1999.
Cheng, Y. and Andersen, O. B.: Improvement in global ocean tide model in shallow water regions, Ocean Surface Topography Science Team Meeting, Lisbon, Portugal, 18–22, October 2010, Poster, SV.1-68 45, 2010.
Cook, J.: An account of the flowing of the tides in the South Sea, as observed on board His Majesty's Bark the Endeavour, by Lieut. J. Cook, Commander, in a Letter to Nevil Maskelyne, Astronomer Royal, and F. R. S., Philos. T. R. Soc., 62, 357–358, https://doi.org/10.1098/rstl.1772.0026, 1772.
Cook, J.: Of the tides in the South Seas, Philos. T. R. Soc., 66, 447–449, https://doi.org/10.1098/rstl.1776.0028, 1776.
Cook, J. and Green, C.: Observations made, by appointment of the Royal Society, at King George's Island in the South Sea, Philos. T. R. Soc., 61, 397–421, https://doi.org/10.1098/rstl.1771.0044, 1771.
David, A. (Ed.): The charts and coastal views of Captain Cook's voyages, vol. 1: The voyage of the Endeavour 1768–1771, London, The Hakluyt Society, 328 pp., 1988.
David, A. (Ed.): The charts and coastal views of Captain Cook's voyages, vol. 2: The voyage of the “Resolution” and “Adventure”, 1772–1775, London, The Hakluyt Society, 332 pp., 1992.
David, A. (Ed.): The charts and coastal views of Captain Cook's voyages, vol. 3: The voyage of the “Resolution” and “Discovery”, 1776–1780, London, The Hakluyt Society, 456 pp., 1997.
Deacon, M.: Scientists and the sea, 1650–1900: a study of marine science, London, Academic Press, 445 pp., 1971.
Doodson, A. T. and Warburg, H. D.: Admiralty manual of tides, London, His Majesty's Stationery Office, 270 pp., 1941.
Foreman, M. G. G.: Manual for tidal heights analysis and prediction, Pacific Marine Science Report 77-10, Institute of Ocean Sciences, Patricia Bay, Sidney, B.C., 58 pp., 1977 (updated 2004).
Hough, R.: Captain James Cook: a biography, London, Hodder and Stoughton, 398 pp., 1994.
Hughes, D. W., Yallop, B. D., and Hohenkerk, C. Y.: The equation of time, Mon. Not. R. Astron. Soc., 238, 1529–1535, https://doi.org/10.1093/mnras/238.4.1529, 1989.
Keir, B.: Captain Cook's longitude determinations and the transit of Mercury – common assumptions questioned, J. Roy. Soc. New Zeal., 40, 27–38, https://doi.org/10.1080/03036758.2010.482971, 2010.
Lalande, J. J.: Traité du flux et du reflux de la mer, Astronomie, Tome 4, Chez la veuve Desaint, Paris, 348 pp., 1781.
Land Information New Zealand web site (LINZ): https://www.linz.govt.nz/sea/tides (last access: January 2018), 2017.
Lubbock, J. W.: On the tides in the port of London, Philos. T. R. Soc., 121, 379–415, https://doi.org/10.1098/rstl.1831.0022, 1831.
Lumpkin, R. and Johnson, G. C.: Global ocean surface velocities from drifters: Mean, variance, El Nino–Southern Oscillation response, and seasonal cycle, J. Geophys. Res.-Oceans, 118, 2992–3006, https://doi.org/10.1002/jgrc.20210, 2013.
Meredith, M. P., Woodworth, P. L., Chereskin, T. K., Marshall, D. P., Allison, L. C., Bigg, G. R., Donohue, K., Heywood, K. J., Hughes, C. W., Hibbert, A., Hogg, A. C., Johnson, H. L., King, B. A., Leach, H., Lenn, Y.-D., Morales Maqueda, M. A., Munday, D. R., Naveira Garabato, A. C., Provost, C., and Sprintall, J.: Sustained monitoring of the Southern Ocean at Drake Passage: past achievements and future priorities, Rev. Geophys., 49, RG4005, https://doi.org/10.1029/2010RG000348, 2011.
Moore, J. H.: The new practical navigator, 15th edn., London, printed by: Crowder, J., 550 pp., 1800.
Nautical Almanac: The nautical almanac and astronomical ephemeris for 1769, Published by order of the Commissions of Longitude, London, printed by: Richardson, W. and Clark, S., 225 pp., 1769.
Orchiston, W.: James Cook's 1769 transit of Venus expedition to Tahiti, in: Transits of Venus: New Views of the Solar System and Galaxy, edited by: Kurtz, D. W., Proceedings of International Astronomical Union Colloquium No. 196, 52–66, https://doi.org/10.1017/S1743921305001262, 2004.
Orchiston, W.: Cook, Green, Maskelyne and the 1768 transit of Venus: the legacy of the Tahitian observations, J. Astro. Hist. Herit., 20, 35–68, 2017.
Pugh, D. T. and Woodworth, P. L.: Sea-level science: Understanding tides, surges, tsunamis and mean sea-level changes, Cambridge, Cambridge University Press, 408 pp., 2014.
Ray, R. D.: A global ocean tide model from Topex/Poseidon altimetry: GOT992, NASA Technical Memorandum 209478, Goddard Space Flight Center 66, 1999.
Ridgway, K. R. and Dunn, J. R.: Mesoscale structure of the mean East Australian Current System and its relationship with topography, Prog. Oceanogr., 56, 189–222, https://doi.org/10.1016/S0079-6611(03)00004-1, 2003.
Ritchie, G. S.: Captain Cook's influence on hydrographic surveying, Pacific Studies, 1, 78–95, 1978.
RNZN: New Zealand tidal stream atlas, Hydrographic Office, Royal New Zealand Navy, 41 pp., 1993.
Skelton, R. A.: Captain James Cook as a hydrographer, The Mariner's Mirror, 40, 92–119, https://doi.org/10.1080/00253359.1954.10658197, 1954.
Te Ara: Te Ara – the Encyclopedia of New Zealand, Ministry for Culture and Heritage of the New Zealand Government, https://teara.govt.nz/en, 2017.
Thomson, T. (Ed.): On Captain Cook's account of the tides in the Endeavour River, Ann. Philos., 13, 203–209, 1819.
UKHO: Admiralty Tide Tables: South Pacific Ocean (including Tidal Stream Tables), vol. 4, NP204, Taunton, United Kingdom Hydrographic Office, 2017a.
UKHO: Admiralty Tide Tables: South West Atlantic Ocean and South America, vol. 7, NP204, Taunton, United Kingdom Hydrographic Office, 2017b.
Walters, R. A., Goring, D. G., and Bell, R. G.: Ocean tides around New Zealand, New Zeal. J. Mar. Fresh. Res., 35, 567–579, https://doi.org/10.1080/00288330.2001.9517023, 2001.
Whewell, W.: Essay towards a first approximation to a map of cotidal Lines, Philos. T. R. Soc., 123, 147–236, https://doi.org/10.1098/rstl.1833.0013, 1833.
Whewell, W.: The Bakerian Lecture: Researches on the tides, Thirteenth Series, On the tides of the Pacific, and on the diurnal inequality, Philos. T. R. Soc., 138, 1–29, https://doi.org/10.1098/rstl.1848.0001, 1848.
Whewell, W.: Tides, in: A manual of scientific enquiry prepared for officers in Her Majesty's Navy, edited by: Hershel, J. F. W., 3rd edn., London, John Murray, 65–85, 1859.
Wikipedia: HMS Endeavour, available at: https://en.wikipedia.org/wiki/HMS_Endeavour#Shipwreck (last access: January 2018), 2017.
Woodworth, P. L.: Three Georges and one Richard Holden: the Liverpool tide table makers, Trans. Historic Soc. Lancashire Cheshire, 151, 19–51, 2002.
Woodworth, P. L.: A survey of recent changes in the main components of the ocean tide, Cont. Shelf Res., 30, 1680–1691, https://doi.org/10.1016/j.csr.2010.07.002, 2010.
River Thames is the name used by Cook; today this is known as Firth of Thames. The names of several other localities that Cook visited have changed – we use Cook's nomenclature when referring to his work and current names when using modern sources.
An archaic term for the moon's transit of the southern meridian (as seen from the Northern Hemisphere).
But in his journal (30 May 1770) Cook notes: “at Spring tides the tide doth not rise less than 16 or 18 feet”
- Abstract
- Introduction
- Tides past and present
- Comparisons of tidal range and times of high water
- Cook's observations of ocean currents and tidal streams
- Hydrographic surveys in New Zealand
- Conclusions
- Data availability
- Appendix A: Relationships between tidal parameters
- Appendix B: Additional mentions of tidal elevations in Cook's journal not in Cook (1772)
- Competing interests
- Special issue statement
- Acknowledgements
- References
- Supplement