the Creative Commons Attribution 4.0 License.
the Creative Commons Attribution 4.0 License.
 | 02 Apr 2026
A 300-year history of understanding and classifying clouds, from a German language perspective
Peter Winkler
Otto von Guericke was the first who experimentally demonstrated cloud formation by expanding and cooling of compressed air before 1663. Scientists initially grappled with the very question of why clouds float. Early explanations were hampered by limited theory, imprecise instruments, and gaps in meteorological knowledge.
First attempts for distinguishing various cloud types arose towards the end of the 18th century. A key turning point came in 1803 when Howard proposed a first systematic scheme using Latin terminology for different cloud types. This effort laid the cornerstone for what would evolve into today's internationally recognized cloud classification system. The path to accurate understanding was long and iterative; early laboratory work and imprecise instruments produced repeated misjudgements that endured for decades. Manned balloon ascents provided direct measurements of meteorological parameters in the free atmosphere and in clouds, but more reliable and bias-free instruments and advances in theory were necessary to achieve reliable results.
Additional techniques had to be developed to determine cloud altitudes and track their motion, gaining knowledge of vertical temperature and moisture profiles that shape different cloud types. Beginning in the 1890s, large-scale movements in the upper atmosphere were recognised by coordinated international observations.
Contemporary early cloud atlases were published despite the limitations of low-contrast, poor photographs. Alternatives, like paintings or cloud watercolours, were even used to overcome these early hurdles. Coordinated observations using daily pilot balloons, kites, and later weather aircraft allowed researchers to further explain cloud formation both in stable and unstable atmospheric conditions. In addition, stratospheric and mesospheric clouds were discovered.
After many efforts to publish international and national cloud atlases the World Meteorological Organization's founding in 1951 enabled the first modern International Cloud Atlas in 1956, standardising cloud observation practices and nomenclature.
- Article
(27543 KB) - Full-text XML
- BibTeX
- EndNote


Clouds form mainly by convective and dynamical uplift processes that cool air to saturation and by long-wave radiation that modifies temperature lapse rates. Which cloud type develops depends on the vertical distribution of temperature and water vapour and on the stability or instability of the atmospheric stratification across a local layer or the whole troposphere. Additionally, orographic interactions with the atmosphere induce vertical movements (such as mountain waves, foehn winds), generating waves, turbulence, or vortices, which further modify cloud shapes according to the degree of atmospheric stability.
Most clouds occur in the troposphere, but under specific conditions, clouds also form in the stratosphere or mesosphere. Ground-based observation of cloud shapes is limited, particularly because cirrus clouds are only perceived above a certain optical thickness (Koterba and Huu, 2020; Spänkuch et al., 2022). However, thin (subvisible) cirrus clouds can be climatically relevant, although statements on the frequency are often unreliable (Wang et al., 1994). Hazy preliminaries of a forming cloud sometimes are termed as “fumulus” (e. g. Vincent, 1907); this term has no agreed definition in meteorology.
The immense variety of cloud shapes and their rapid changes have led to numerous interpretations and explanations prior to systematic observation during the Enlightenment. In meteorology the pre-scientific era can be interpreted as a magical period in which nature was seen in a pictorially sense before the development of a physical explanation began. Culturally speaking, this phase is comparable to childhood: Natural phenomena were mostly interpreted by religious wisdom and by fantasies. In old woodcuts, we see God's punishing hand coming out of clouds hits the sinner. Battleships, fighting knights, raging horses or dragons and even angels were often fantasized into clouds, as children still like to do today. Printers did good business with such single-sheet prints (Fig. 1), details are found in Berns (2019).
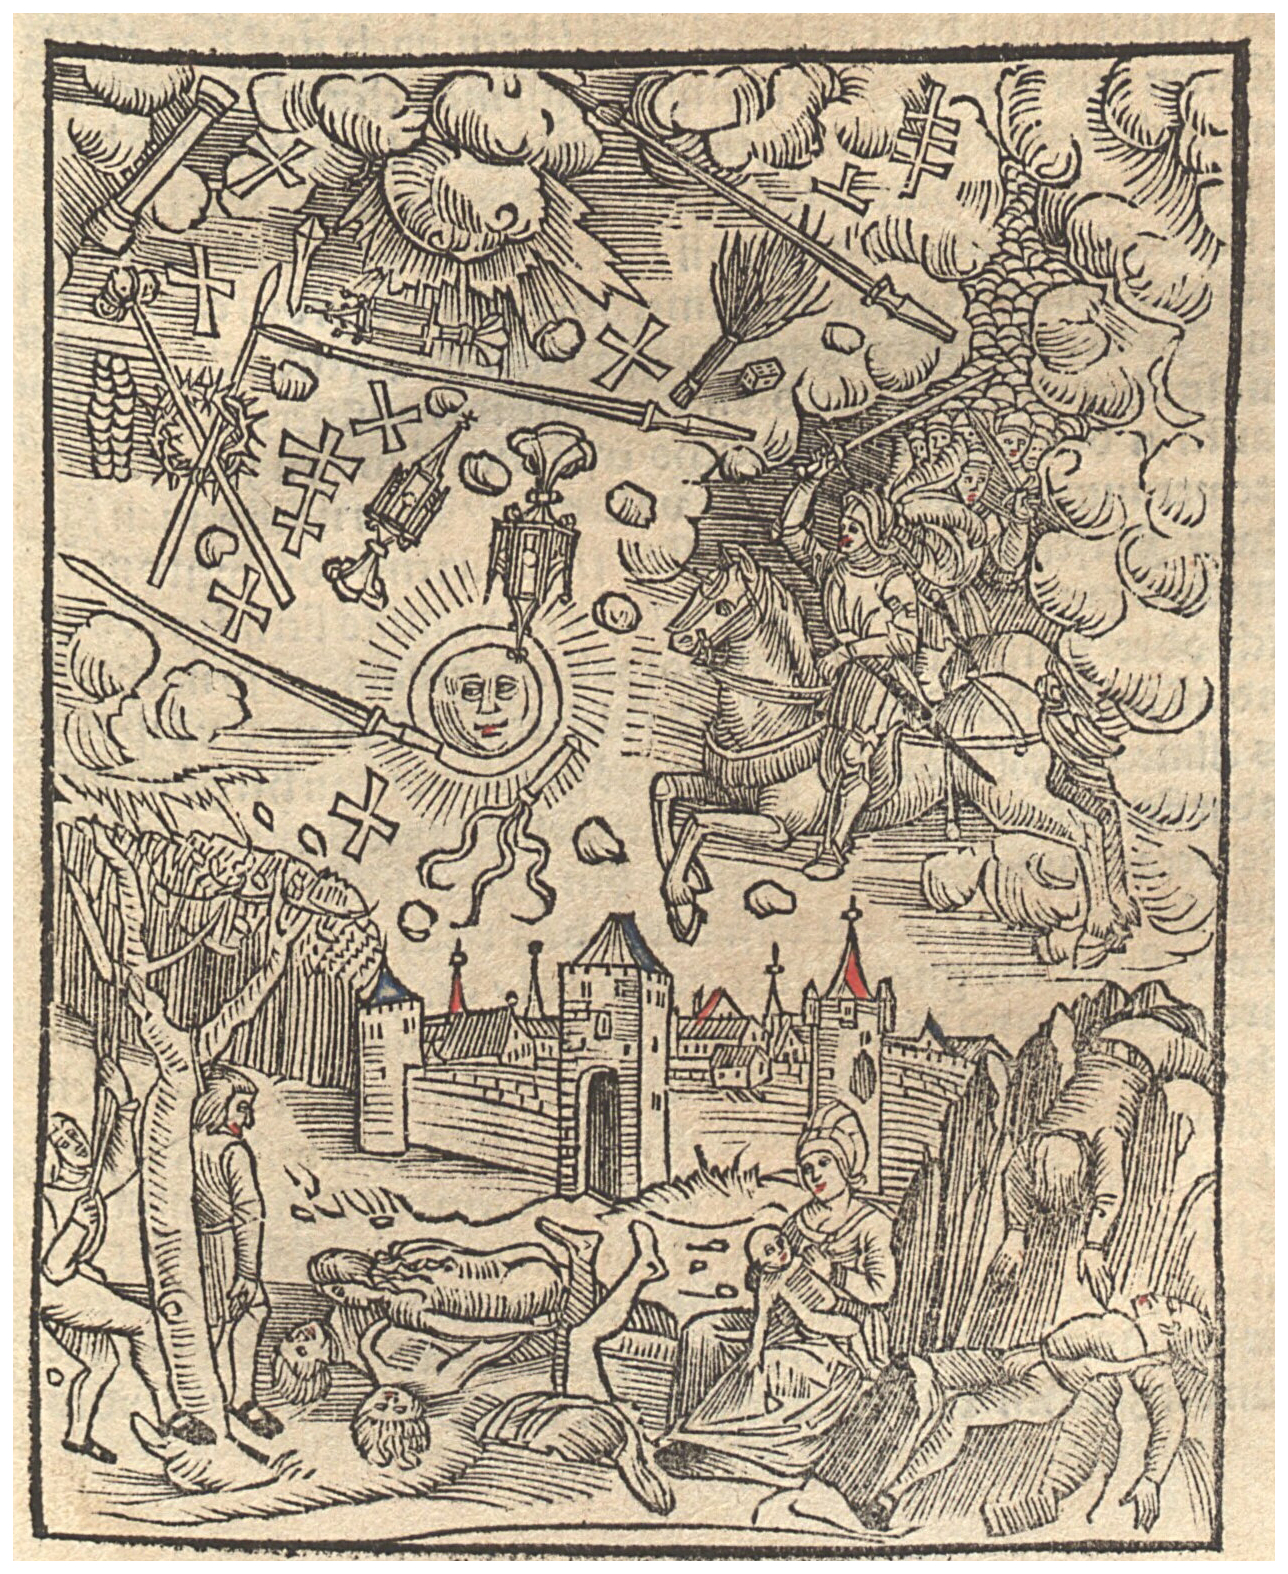
Figure 1Frontispiece of Grünpeck (1515): Ein newe außlegung Der seltzamen wundertzaichen[...], showing a knight on horse and other signs in the clouds as products of exuberant imaginations.
In 1667, Robert Hooke (1635–1702) in England proposed weather observations including cloud height, direction of their movement and shape of the cloud base, being either flat or wavy and irregular (Hooke, 1667). His proposals attracted little attention from contemporaneous scientists; Hooke was far ahead of his time.
Typical cloud types were given figurative and regionally common names such as: fleecy clouds, in England mackerel sky; in sailors' language, cirrus were called wind trees or cat's tails or mare's tails. The term smallpox clouds (mammatus) was customary in the Orkneys (Köppen, 1887; Clayden, 1905, plate 31) and in US fracto-cumulus clouds were designated “scud” (US Hydrographic Office, 1897).
For a long time, people understood clouds as rigid bodies and believed that firing cannons could alter the path of thunderclouds. When clouds rub against each other, electricity is generated (Lampadius, 1806, p. 83). Dove (1803–1879) initiated a new perspective noting that clouds are dynamic processes which are constantly forming and disappearing, so they should be considered as flow rather than a solid object (Dove, 1837, p. 48).
The still widespread scholastic view had to be overcome, since it merely debated arguments for and against a hypothesis without seeking a physical process. For example, a typical explanation was that in the morning terrestrial vapours would rise with warming of the ground by the sun. Such vapours could increase atmospheric electricity aloft, enhanced by cooling. In contrast warm vapours would diminish positive atmospheric electricity. Due to the lack of knowledge about the magnitude of the latent heat amount, the warming of the air during heavy dews was strongly overestimated (Hube, 1790).
Through many decades of research, a physical understanding of atmospheric processes was reached. Initially, clouds were only observed from the ground, but extensive atmospheric studies using manned and instrumented balloon ascents and later aircraft observations were necessary to achieve a uniform cloud classification. The development of an idealised cyclone model, including warm and cold fronts and other pressure patterns in large-scale observation networks, improved the correct observation of cloud shapes by linking air masses, large-scale vertical motion, and stability or instability in specific areas of meteorological structures. Convergent and divergent upper airflows were identified by observing cloud movements, and people have increasingly learned to deduce the sequence of weather development based on cloud types:
-
Luke Howard and his successors introduced a phenomenological cloud classification system that remains in use to this day. However, early descriptions of cloud forms were prone to misinterpretations. Logical conclusions could not prevent erroneous inferences if the underlying assumptions were incorrect.
-
Precise in-situ measurements of relevant physical parameters required advanced aeronautical technologies such as manned balloons, kites, radiosondes, airplanes, as well as meteorological instruments being free of biases.
-
Organizationally, interested scientists from various countries voluntarily joined together in a variety of meteorological and technological commissions, e.g. the International Commission of Cloud Research through the international Meteorological Commission (IMC) from 1894 to 1930; and the WMO (World Meteorological Organisation) since 1951 (MacCracken and Volkert, 2019, p. 124).
The present work compiles key milestones of this evolution from a pure phenomenological perspective to a physical understanding of cloud forms, supplemented by experiments, theoretical advances, and instrument development, while excluding artistic treatments of clouds and microphysics of cloud types and precipitation (e. g. Mason, 1957).
The early research focused on the formation of clouds. Otto von Guericke (1602–1686), inventor of the vacuum pump and mayor of Magdeburg in Germany, conducted numerous experiments and published his results in his work “Experimenta nova” (Guericke, 1672). The manuscript was already completed in 1663 but printed only nine years later. In chapter A of book III, he described an experiment to produce a cloud for the first time (Fig. 2): a large evacuated vessel was connected to a small vessel containing moist air at atmospheric or higher pressure. When the connecting tap was opened, the air expanding into the vacuum cooled adiabatically, and mist droplets became visible that slowly sank down. Guericke assumed these droplets to be hollow vesicles without further reasoning.
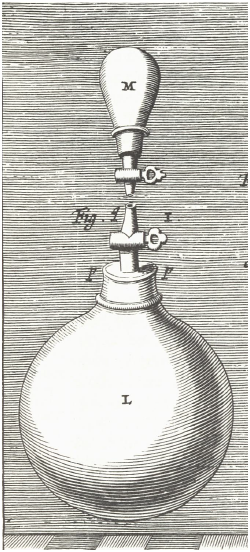
Figure 2Guericke's device for his fog experiment performed before 1663.
Edmond Halley (1656–1742) in London also used the vesicle hypothesis in 1690. Most probably he was inspired by a review of Guericke's book in the Philosophical Transactions. Halley imagined that when water boils, vapour bubbles leave the surface as hollow vesicles filled with a light gas due to the heat effect. Thus, they become specifically lighter and able to float (Halley, 1690): “I have formerly attempted to explain the manner of the rising of vapors by warmth, by showing that if an atom of water were expanded into a shell or bubble, so as to be ten times as large in diameter as when it was water, such an atom would become specifically lighter than air [...].” Atom for him meant particle, not in today's sense as the smallest particle of a chemical element.
Guericke's findings were partly made known earlier to experts by Caspar Schott (1734–1794), a Jesuit at the University of Würzburg, who corresponded with Guericke and quoted from his letters (Schott, 1664, p. 21 ff.; Heinecke et al., 2019). The existence of hollow vapour or fog bubbles could not be verified, nor could the nature of the rarefied gas inside.
The young Gottfried Wilhelm Leibniz (1646–1716) studied Guericke's “Experimenta nova” intensely and corresponded with him in 1671 and 1672 (details in Dannemann, 1889). In 1710, he wrote his treatise ”De elevatione vaporum,” in which he also assumed hollow vesicles that had to be specifically lighter than air (Leibniz, 1710). Leibniz, famously ignoring English-language literature, did not mention Halley's arguments. His theory was considered correct for another 170 years.
Christian Wolff (1679–1754), the philosopher who influenced the development of enlightenment all over Europe, observed droplets appearing white when they crossed a beam of light in a dark room. By analogy with white foam on brown beer, he concluded that the floating droplets must also be hollow vesicles (Wolff, 1722, Sect. 84).
In 1743, Christian Gottlieb Kratzenstein (1723–1795) submitted a treatise on the physical prize question to the Académie des Sciences de Bordeaux entitled “L'élévation des vapeurs et des exhalations” (Kratzenstein, 1743, 1744). He confirmed the vesicle hypothesis with the argument that a rainbow can never be observed in a cloud, and therefore cloud droplets cannot be compact but must be hollow. He received widespread attention. Kratzenstein saw another reason for the rise of vapour vesicles in the adhesion of the surrounding air “molecules”: At low altitudes with high air pressure the cohesion of the surrounding air particles should be strong giving the vesicles an upward buoyancy. At higher altitudes, the cohesion of the air particles decreases due to falling air pressure, causing the buoyancy to come to a standstill, and the vapour vesicles float at this altitude (Fig. 3). He overestimated the size of air particles in relation to water vesicles (really m instead of m in Kratzensteins opinion). Furthermore, Kratzenstein had no knowledge of the vapour pressure dependence on the radius of curvature over small droplets being discovered by Lord Kelvin in 1871. His specious logic of argument convinced many scholars.
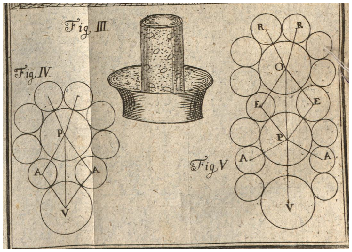
Figure 3Kratzenstein's reasoning for an uplifting motion of water vapour particles (P) due to the cohesion of air particles (A) and its reduction with falling atmospheric pressure.
The dogma of the written word about cloud vesicles had an impact for almost 200 years. Leading scientists like Euler, Saussure, Humboldt, Volta, Kämtz, and Clausius and others held on it; even the philosopher Arthur Schopenhauer (1862, p. 134) regarded cloud vesicles as real.
However, over time, doubts were raised. One of the first was Ludwig Wilhelm Gilbert (1769–1824), who translated Howard's essay ”Modification of clouds” into German in 1805 and stated in the preface that only water vapour could be found inside bubbles (Gilbert, 1805). Vesicles would therefore have to sink downwards and could not stay suspended.
In 1847, Augustus Volney Waller tried to detect vesicles under the microscope but could not confirm them and considered them as “spherules” (Waller, 1847). His work was ignored. He had not examined atmospheric cloud droplets but rather those created by breathing.
Kuhn (1866) observed a strongly coloured rainbow in a fog and concluded the presence of compact droplets. However, he argued that compact droplets could coexist with vesicles to keep open a backdoor.
Only Kober was able to show through microscopic examinations that vesicles did not exist in the atmosphere (Kober, 1871). His dissertation appears to have had little spread and received barely any attention after publication. The vesicle hypothesis ultimately remained in teaching until 1885. In that year, Richard Assmann (1845–1918) examined real cloud droplets on top of the mountain Brocken in Harz Mountains with a microscope and found no evidence of hollow vesicles. This hypothesis was finally refuted with the publication in the Meteorologische Zeitschrift, one of the leading journals at that time (Assmann, 1885). Nevertheless, many articles appeared afterward in which the vesicle hypothesis was still uncritically adhered to.
Clouds are constantly changing their forms and make air movements visible. Their shapes depend on the stability or instability of the air. Radiation and atmospheric dynamics (such as vertical movement and wind shear) also play important roles in forming various shapes. The temperature determines the physical state (liquid or solid phase) of the cloud particles. It is not surprising that many initial cloud names were not physically justified.
The mathematician Friedrich Meister (1724–1788) in Göttingen developed an initial approach to classifying cloud types and he distinguished clouds of
-
bulbous, convex shapes
-
holey, concave shapes
He described clouds as round or long (meaning sheet-cloud), with parts that appear spongy or grainy. These basic forms could combine into various larger cloud structures, governed by certain atmospheric mechanisms rather than randomness (Meister, 1780).
The Societas Meteorologica Palatina focused only on observing cloud coverage, density, and colour, but ignored cloud forms in their observations between 1781 and 1793.
In a next suggestion, Jean Baptiste de Lamarck (1744–1829) distinguished five types of clouds across three atmospheric levels (de Lamarck, 1802), later expanding his system to twelve types. Although the French names for clouds did not gain much attention, his division of the atmosphere into three levels is still used today, being aware that this represents a compromise . The 1939 edition of the 3. International Cloud Atlas offered several speculative reasons: Lamarck's somewhat peculiar French names may not have been readily adopted in other countries, or the paper might have been discredited by appearing alongside forecasts based on astro-meteorological hypothesis. Four of Lamarck's five principal cloud types appear in Howard's naming scheme, but there is no evidence that Howard was aware of Lamarck's research or he was in contact with him.
Luke Howard (1772–1864), a businessman (Fig. 4) who manufactured pharmaceutical chemicals, observed clouds as a hobby, and categorized them into three basic types. He also suggested cloud symbols for quick notation, which later became indispensable in a modified form when constructing weather maps.
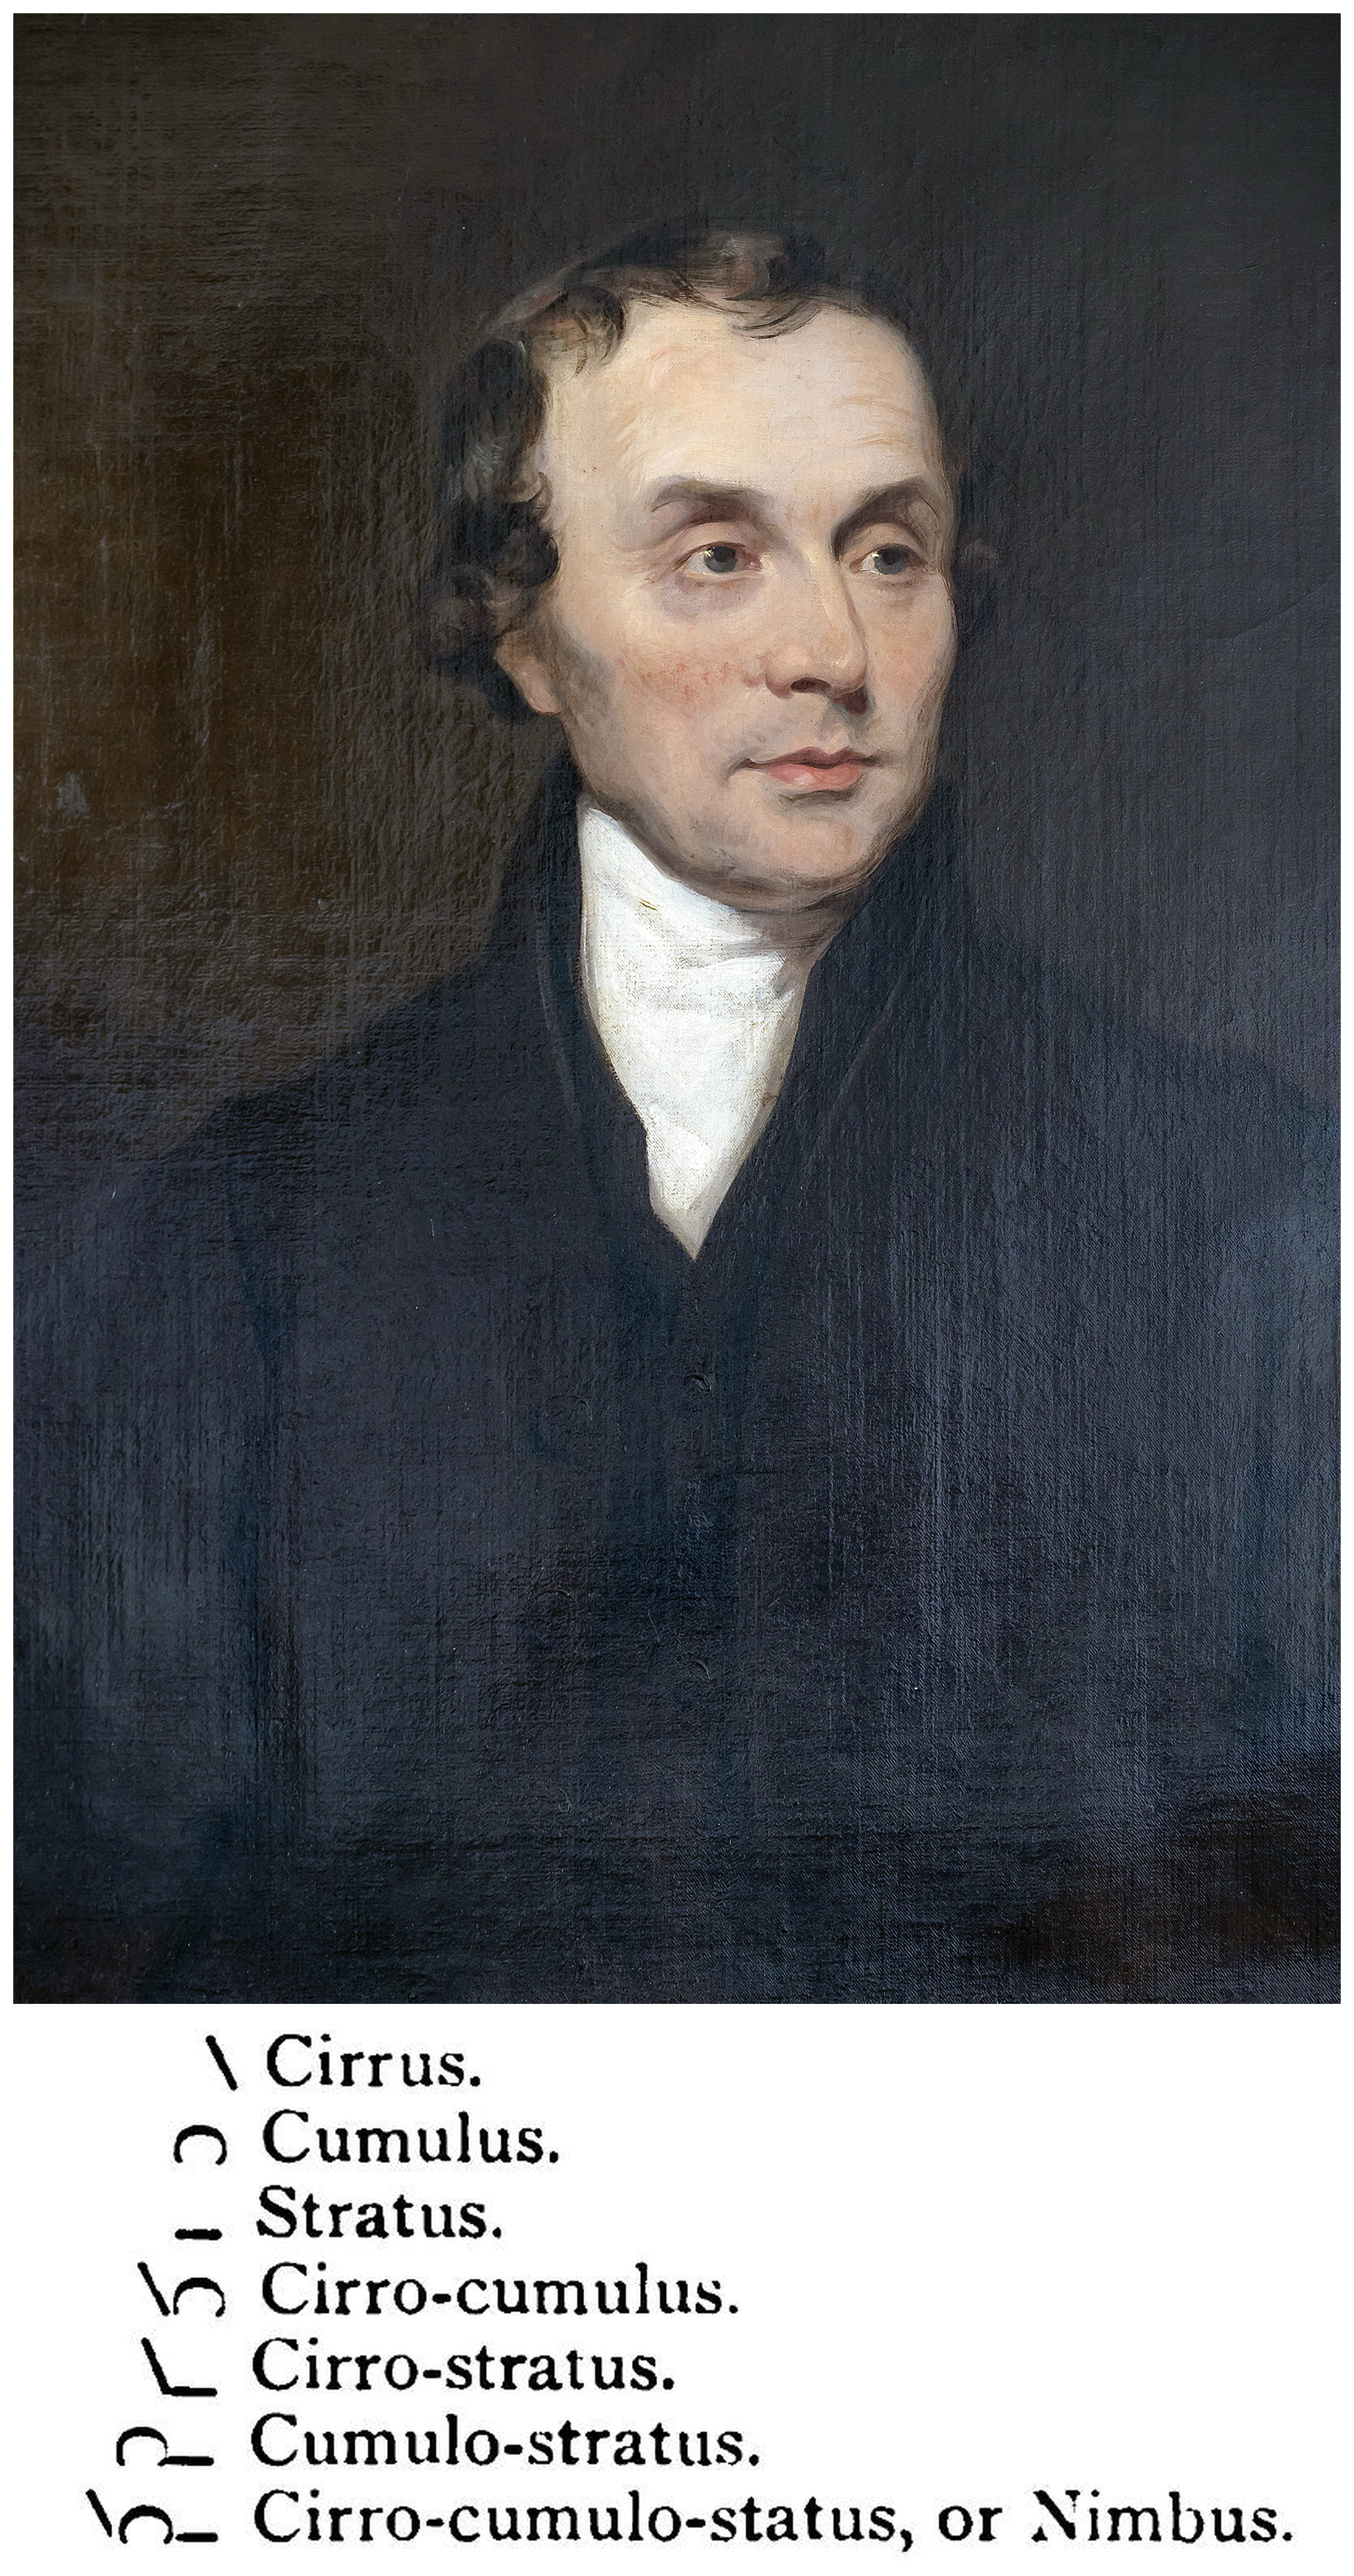
Figure 4Luke Howard, painting by John Opie (credit of the Royal Meteorological Society) and cloud symbols recommended by him.
Howard's significant achievement was the introduction of Latin terms, as Latin was still widely used as a scholarly language, giving his system an international appeal. Thus, he succeeded in eliminating local and trivial cloud names. He introduced three basic types and supplemented them with mixed types, distinguishing seven cloud types in total. Howard assumed only two essential height levels, with the middle and upper areas coinciding (Howard, 1803) based on the implicit assumption that only ice clouds occur above 4000 m.
It should be noted that when later Howard's cloud names were adopted, they were interpreted in a more differentiated manner. When labelling the shapes, he overestimated the role of electricity in the cirrus level. The similarity of cirrus forms to Lichtenberg's dust figures (Fig. 5), generated by static electric fields, led him to assume that strong electric fields must also be present at the cirrus level. The ice crystals would arrange themselves according to the electric fields (Hamanaka, 2015), showing how the “electric fluid” is conducted through the cloud. Even before Howard, Jean André Deluc (1727–1817) noted the similarity between some cirrus varieties and Lichtenberg's figures (Deluc, 1786, Sect. XII). Howard, however, was aware that his conclusion rested on analogy rather than on an inductive chain of reasoning.
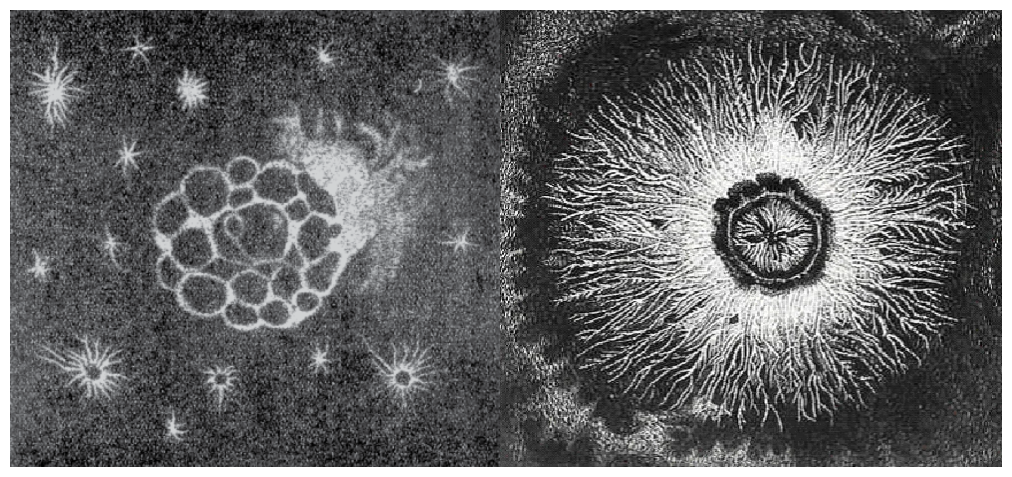
Figure 5Lichtenberg figures. From their similarity to cirrus forms, Howard concluded on a large effect of electricity in the high atmosphere on the cloud shape of cirrus.
In his Berlin Kosmos-lectures in 1827, Alexander von Humboldt (1769–1859) described a striking parallel orientation of polar lights and cloud bands at the cirrus level. He noted:
One often notices really bright clouds. Tienemann1 in Iceland first pointed out that the so-called sheep (Cirrus stratus), which I observed on the Chimboraço at a height of 3–4000 toises above me, may be connected with the Polar Lights. He noticed that they are luminous in some nights. (British naval officer Parry (1790–1855))2
stated that the morning after an aurora borealis he saw clouds oriented in the direction of the arc, leading Humboldt to introduce the term “polar bands” (Parthey, 1828). The assumption that parallel cirrus bands would align with the magnetic field and point towards the magnetic pole was later abandoned (Dorno, 1925). However, Dorno argued that ice plates might systematically align with the sun's rays, and that those warmed by radiation would evaporate while others could cool below the temperature of the surrounding air and persist. Consequently, radiative effects might partially contribute to the formation of polar bands, an unconvincing explanation, as there is no mechanism for a systematic alignment of ice plates. Eventually, all parallel cirrus bands were referred to as polar bands, as they appear to converge at a “pole” in perspective (von Bezold, 1894).
For a long time after Howard, cloud shapes were scarcely the subject of systematic research. Observations focused on the degree of cloud cover and its climatological averages.
3.1 The role of moist adiabatic processes
James Pollard Espy (1785–1860) gave an important impulse to cloud research. He recognized that adiabatic processes occur in the atmosphere due to the conservation of energy. The release of latent heat during condensation drives the formation of thunderstorms and in low-pressure areas (Espy, 1841). Espy conducted experiments with a “nephelescope”, similar to Guericke's apparatus, without knowing about it (Fig. 6). He relied on Dalton's results on total pressure as the sum of partial pressures.
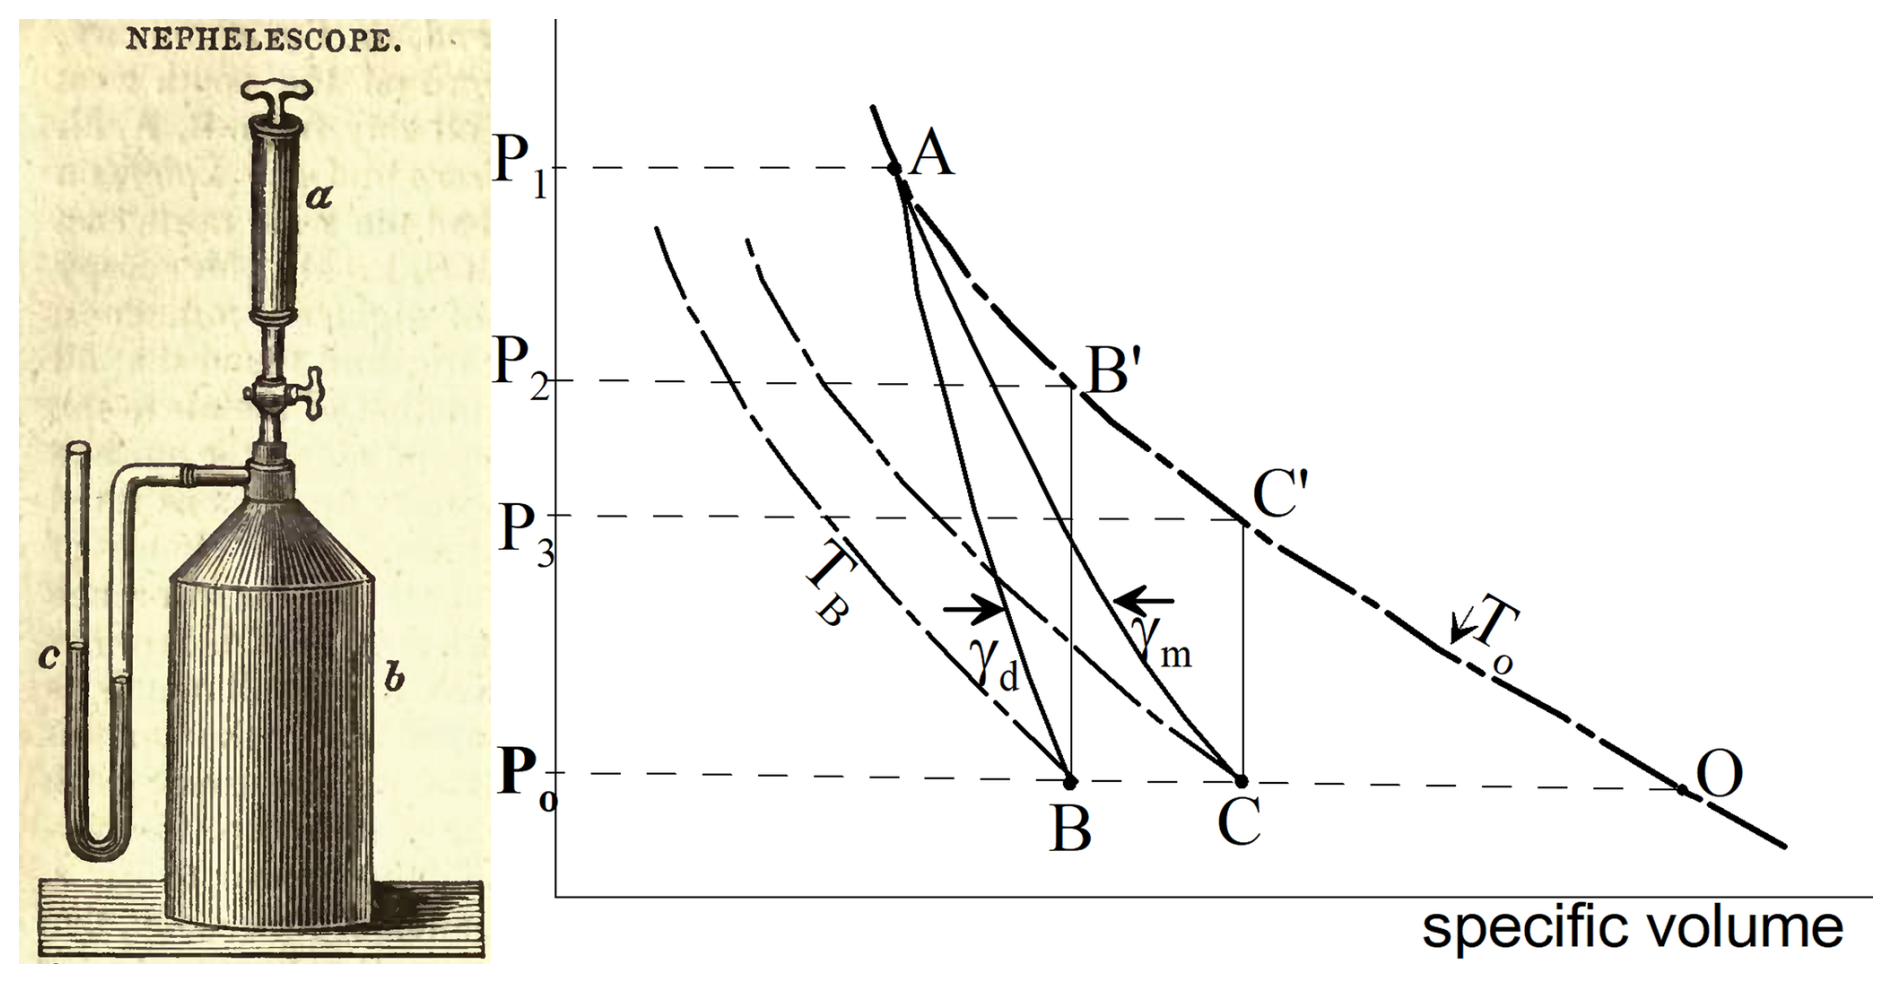
Figure 6Left: Nephelescope of Espy (1841) used to demonstrate the heat gain of air due to condensing water vapor. right: Graphic according to McDonald (1963, p. 638), illustrating the temperature and pressure changes in the nephelescope during dry (γd) and moist adiabatic (γm) expansion.
Espy's vessel b was brought to a higher pressure P1 with the pump a, and temperature equalization with the environment was awaited. After removing the pump and opening the tap, the air cooled dry adiabatically and reached the specific volume B. Once pressure equilibrium prevailed, the tap was closed. As the temperature equalized again (B′), the pressure was increased to P2. With water at the bottom of the vessel, the air could be made saturated after increasing the pressure to P1 again. Upon opening the tap, the air now cooled moist-adiabatically, reaching a higher specific volume due to the release of latent heat up to specific volume C. The tap was closed again, and temperature equilibration in C′ was awaited. The pressure now increased only to P3. Espy demonstrated in this simple way that cumulus clouds experience additional buoyancy through latent heat release, but his findings did not intensify the study of cloud types at that time.
Hertz (1884) developed the first adiabat chart, allowing a rapid visual assessment of dry and moist-adiabatic states of change. In a lecture on thermodynamics, v. Bezold (1888) improved the theory and mentioned that only assumptions could be made on whether the condensed water remains suspended or falls out immediately as precipitation. Adiabatic charts enabled to assess cloud formation due to dry and moist adiabatic vertical displacement (see Sect. 7 and Fig. 12).
3.2 Further Development of Howard's cloud system
Individual observers attempted to further develop Howard's cloud system, with Poey and Ley receiving wider attention. This was a learning phase where many misjudgements still occurred.
Poey (1799–1891), meteorological observer in Havana, proposed two new cloud types in 1863: the fractocumulus type (“a wind cloud because it moves quickly”) is still in use today. The pallio- or pallium (= mantle) cloud-type being based purely on appearance, was not accepted (Poey, 1863, 1874). Murphy (1870) remarked that new cloud types are only acceptable if the physical processes and circumstances that create those types can be explained.
In England, Clement Ley (1840–1896), rector of St. Peters Church in Ashby Parva, Leicestershire, made cloud observation his life's work (Ley, 1879, 1884). His approach was principally physical, but he suggested too many names. He proposed terms such as radiation clouds, interfret clouds, and inclination clouds. He also struggled and capitulated with the huge variability of cirrus shapes. Smoke layers or Sahara dust he called nebula pulvera, which is not a cloud strictly speaking and he proposed the type nubes fulgens – although it is unclear if he meant noctilucent clouds – and estimated their altitude to be 91 800 m. His classification scheme was considered inconsistent (Grossmann, 1894). The book “Cloudland” (Ley, 1894) was published posthumously. Ley had already given the correct term to the species Altocumulus castellatus (today castellanus), which is a reliable thunderstorm predictor for the afternoon (Fig. 7).
Table 1Cloud names suggested by Ley (1894) and present-day international designations of cloud forms.
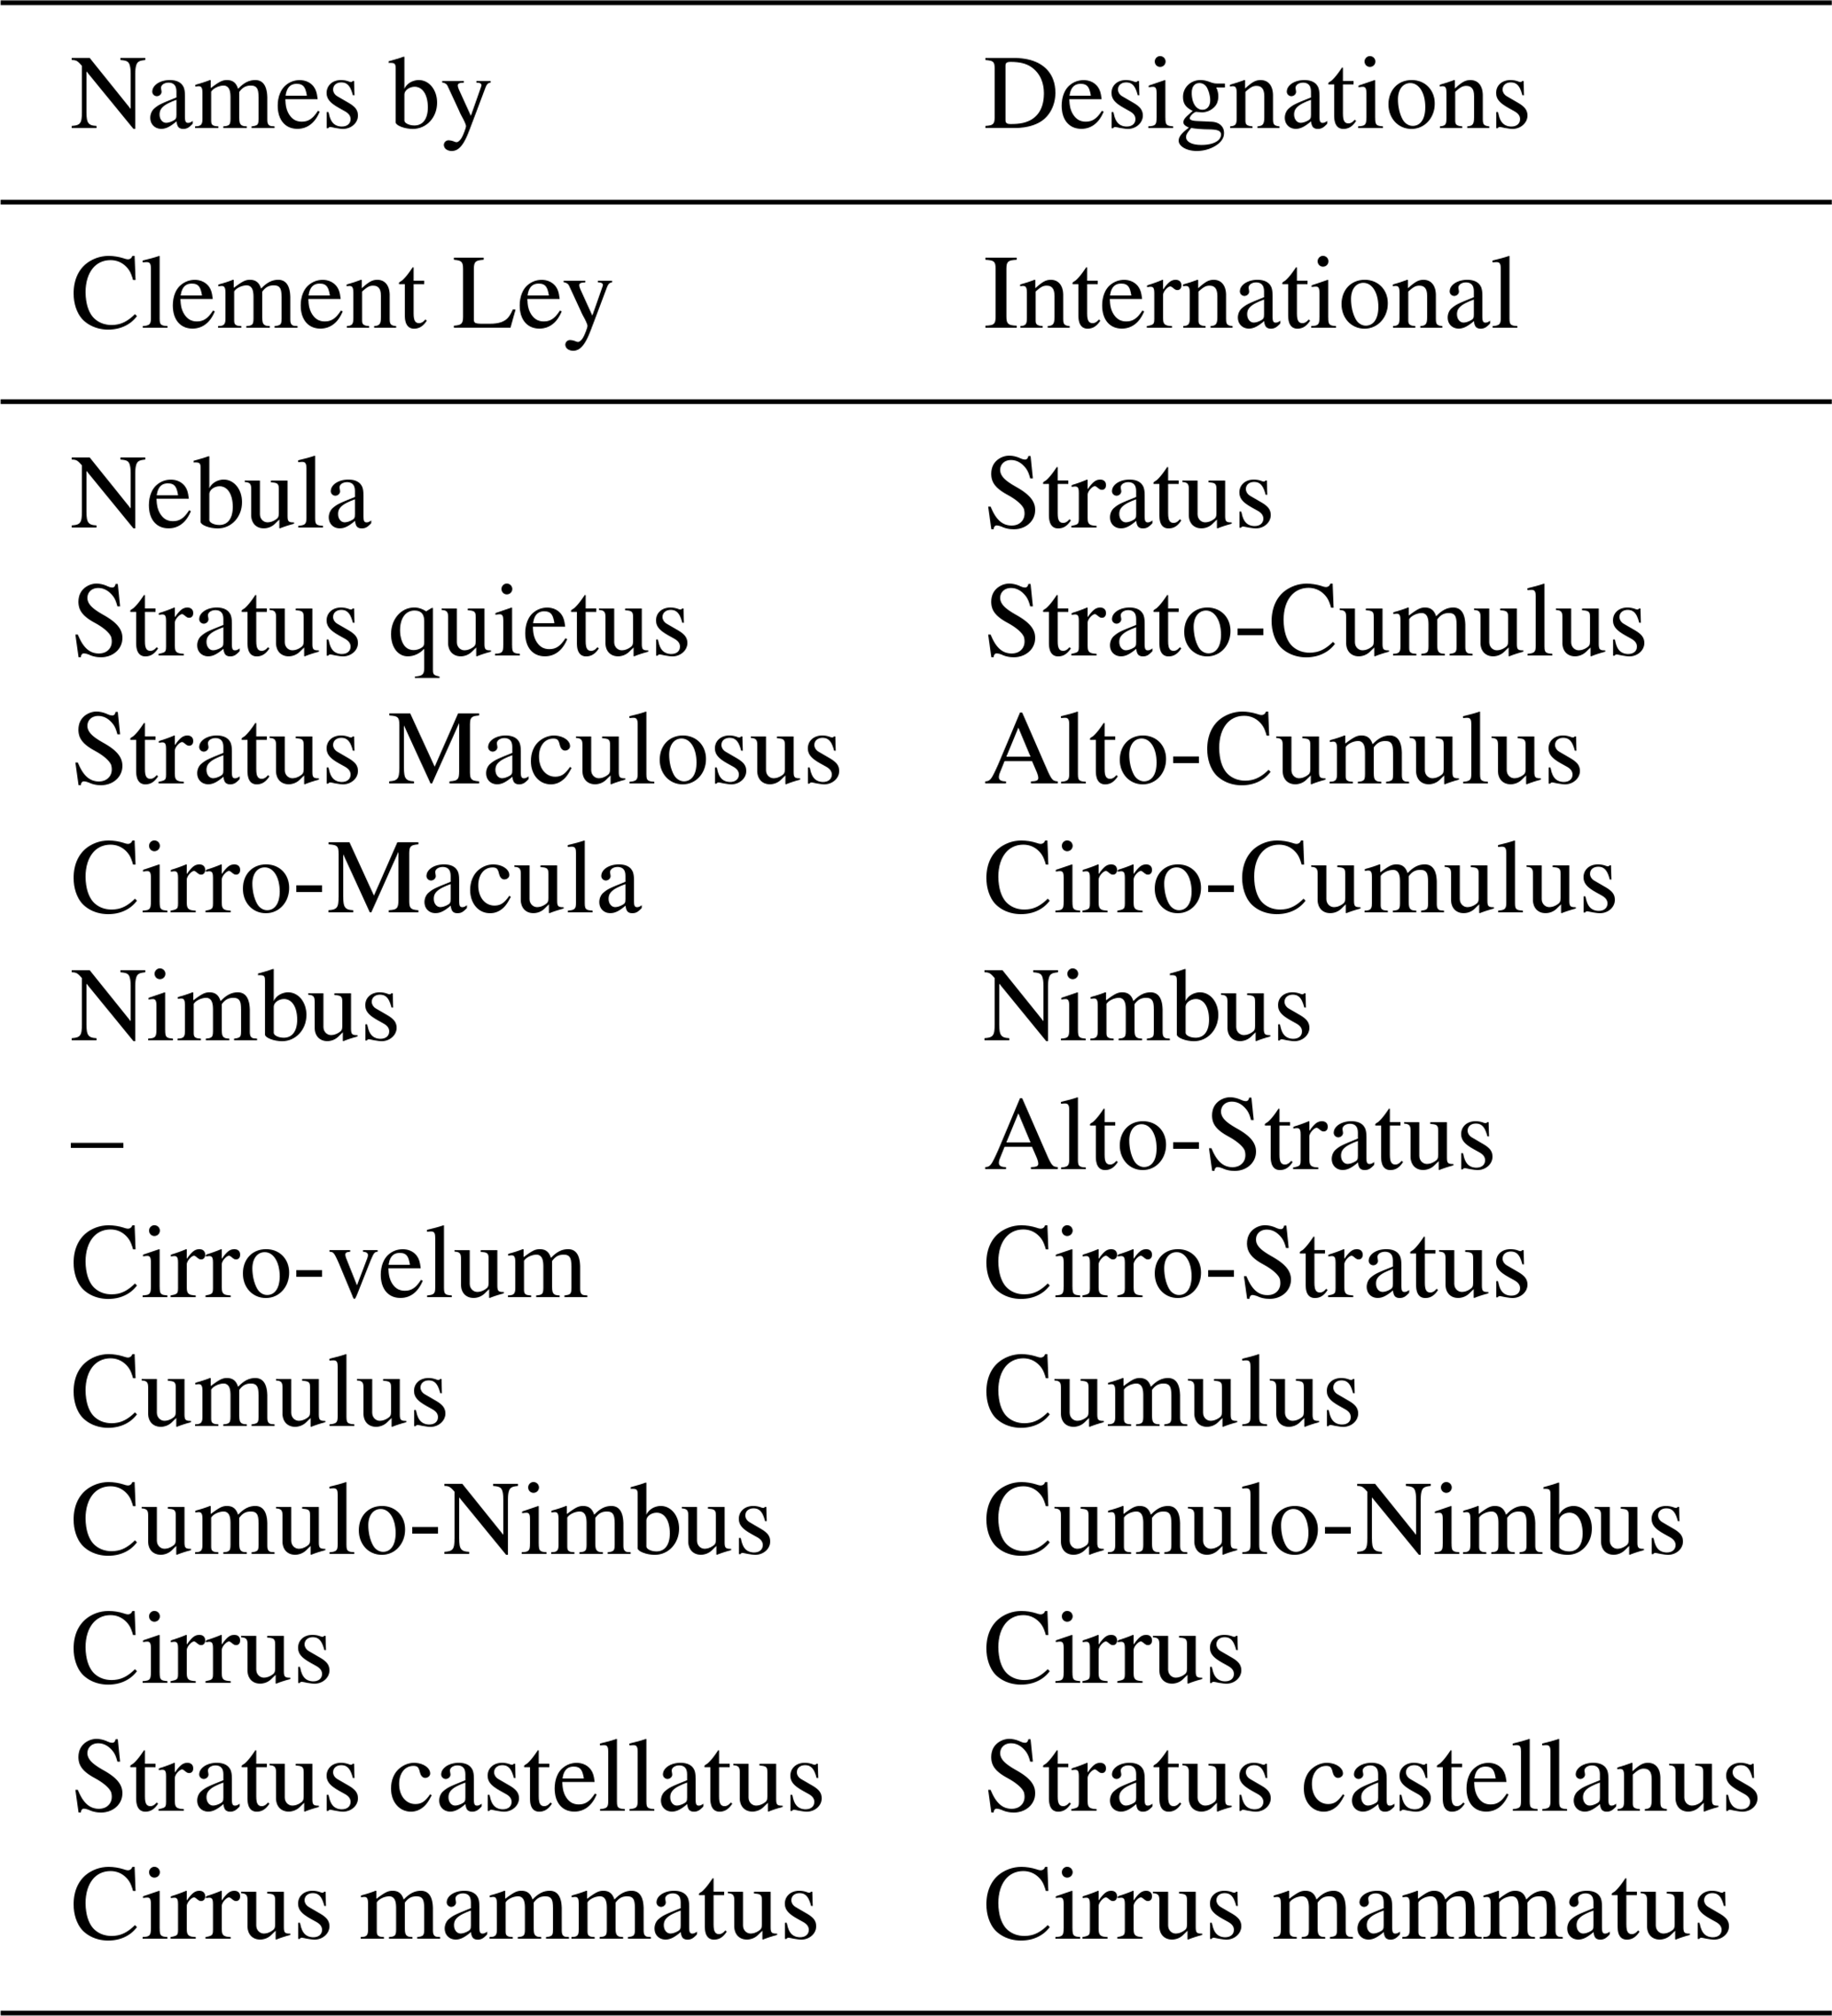
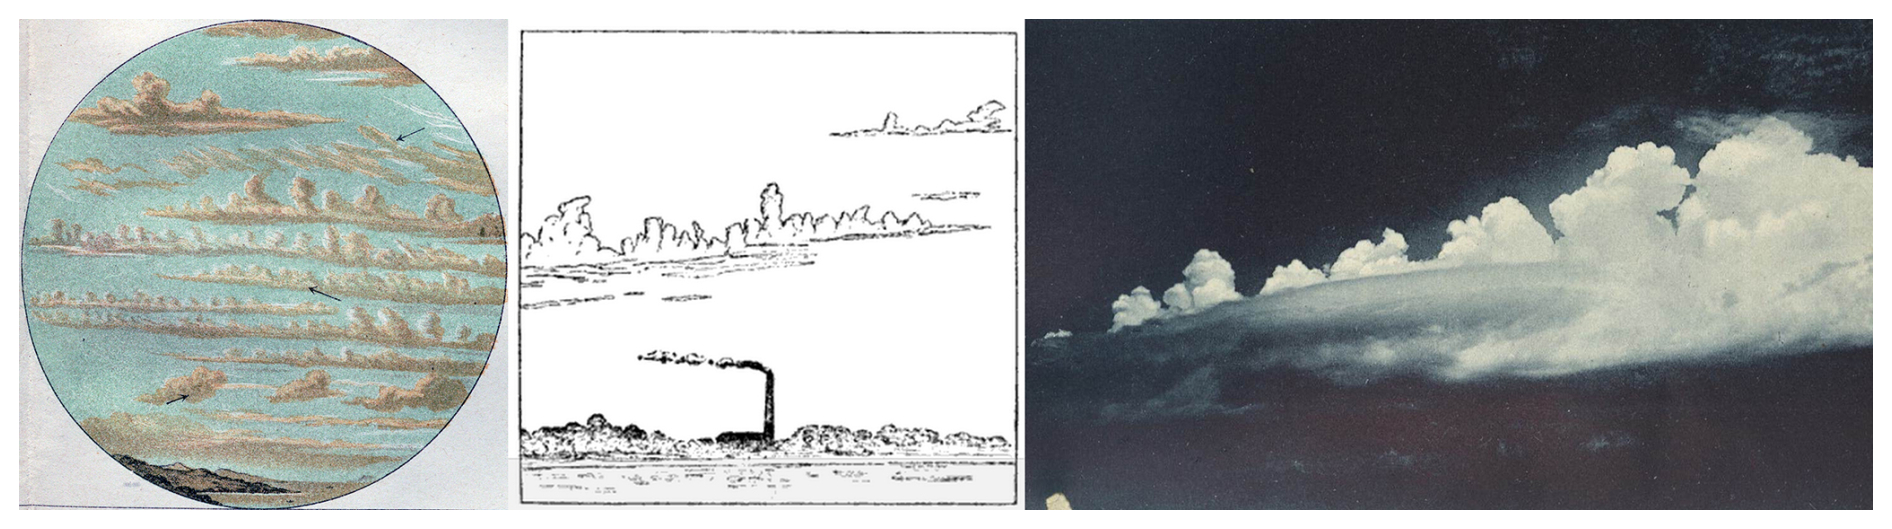
Figure 7Left: Drawing of altocumulus castellatus by Ley (1879). The tower-shaped convection indicates unstable stratification at altitude, which increases over the course of the day and often leads to thunderstorm formation. Center: Drawing by Köppen (1891) in Hamburg of Altocumulus castellatus in the morning, which was followed by a night thunderstorm. Right: A relatively good photo was achieved by de Quervain (1908).
3.3 Further insights through meteorological research
Fraunhofer (1825) developed a theory for refraction and diffraction at small particles. Thus, optical phenomena such as coronas, halos, parhelia, and sun pillars indicate the presence of cloud droplets or ice crystals and therefore allow discrimination between water and ice clouds (e. g. Kämtz, 1836, III, p. 94ff., 115f.). Precise height measurements revealed the existence of supercooled water droplets in translucent clouds above freezing level.
In 1872, the International Meteorological Committee (IMC), founded in Leipzig in Prussia (Börngen and Foken, 2022), primarily intended to standardize instruments and unify observation methods. Interest in clouds grew anew during this and subsequent congresses. A morphological cloud classification was requested to conclude on typical atmospheric states from cloud shapes. Already in 1876 observers in Austria were instructed to note main cloud shapes such as cirrus, stratus, cumulus, and nimbus (Jelinek, 1876).
One reason for the long-standing lack of interest in cloud shapes could be that an understanding of the meteorological conditions responsible for different cloud shapes had to be developed first. These conditions could be clarified only step by step after the start of scientific balloon flights from 1880 onwards, in which reliable vertical profiles of temperature and relative humidity became available out of and within clouds. In 1882, the IMC first demanded information on cloud height, cloud movement, and cloud density. At that time, only specially trained meteorologists were able to classify clouds correctly.
Over time, it was recognized that unstable air stratification stimulates convection, even at limited altitudes, causing cumuliform shapes to develop. If there is an inversion above an unstable layer of air, the cumulus cloud typically do not develop further in height but spreads out a cloud layer at the inversion.
The physicist von Bezold (1837–1917) warned that one should not proceed too quickly
to create an artificial system for the classification of clouds on purely descriptive grounds, following the method of Linnée's plant scheme, which does not consider the formation and dissolution of clouds (von Bezold, 1892, p. 18).
He may have been referring to the botanist Neuber (1829), who had distinguished 228 different cloud types. Von Bezold still regarded meteorology as an empirical science that had to be placed on a firmer physical basics.
An important observation during early balloon flights was the coexistence of supercooled water drops and snow crystals at altitudes below freezing. Balloon-pilots confirmed the presence of hydrometeors in both states through direct observation. Alfred Wegener (1880–1930) emphasized that ice particles have a lower vapour pressure and cannot coexist with cloud droplets for long because snow crystals will grow at the expense of supercooled water droplets (Wegener, 1911, p. 271f.).
The development of the Bergen cyclone model by Jakob Bjerknes (1897–1975) provided another important impetus for understanding cloud types (Bjerknes, 1919). The idealized model described the circulation and mixing of cold and warm air masses in a wave at the polar front inducing large-scale vertical movements, with up-sliding at the warm front and cold air at the cold front, pushing under the warm air and inducing the formation of cumulonimbus clouds (Fig. 8). By this concept “air mass thinking” was introduced into meteorology in general and cloud formation in particular. Now observers could expect certain cloud types: with an approaching warm front stratiform cirrus appears first, thickening to altostratus with a lowering cloud base and finally turning into nimbostratus with rain. When denser air behind the cold front pushes underneath the warm air, high-reaching cumulus clouds develop. In the warm sector stratiform clouds should prevail.
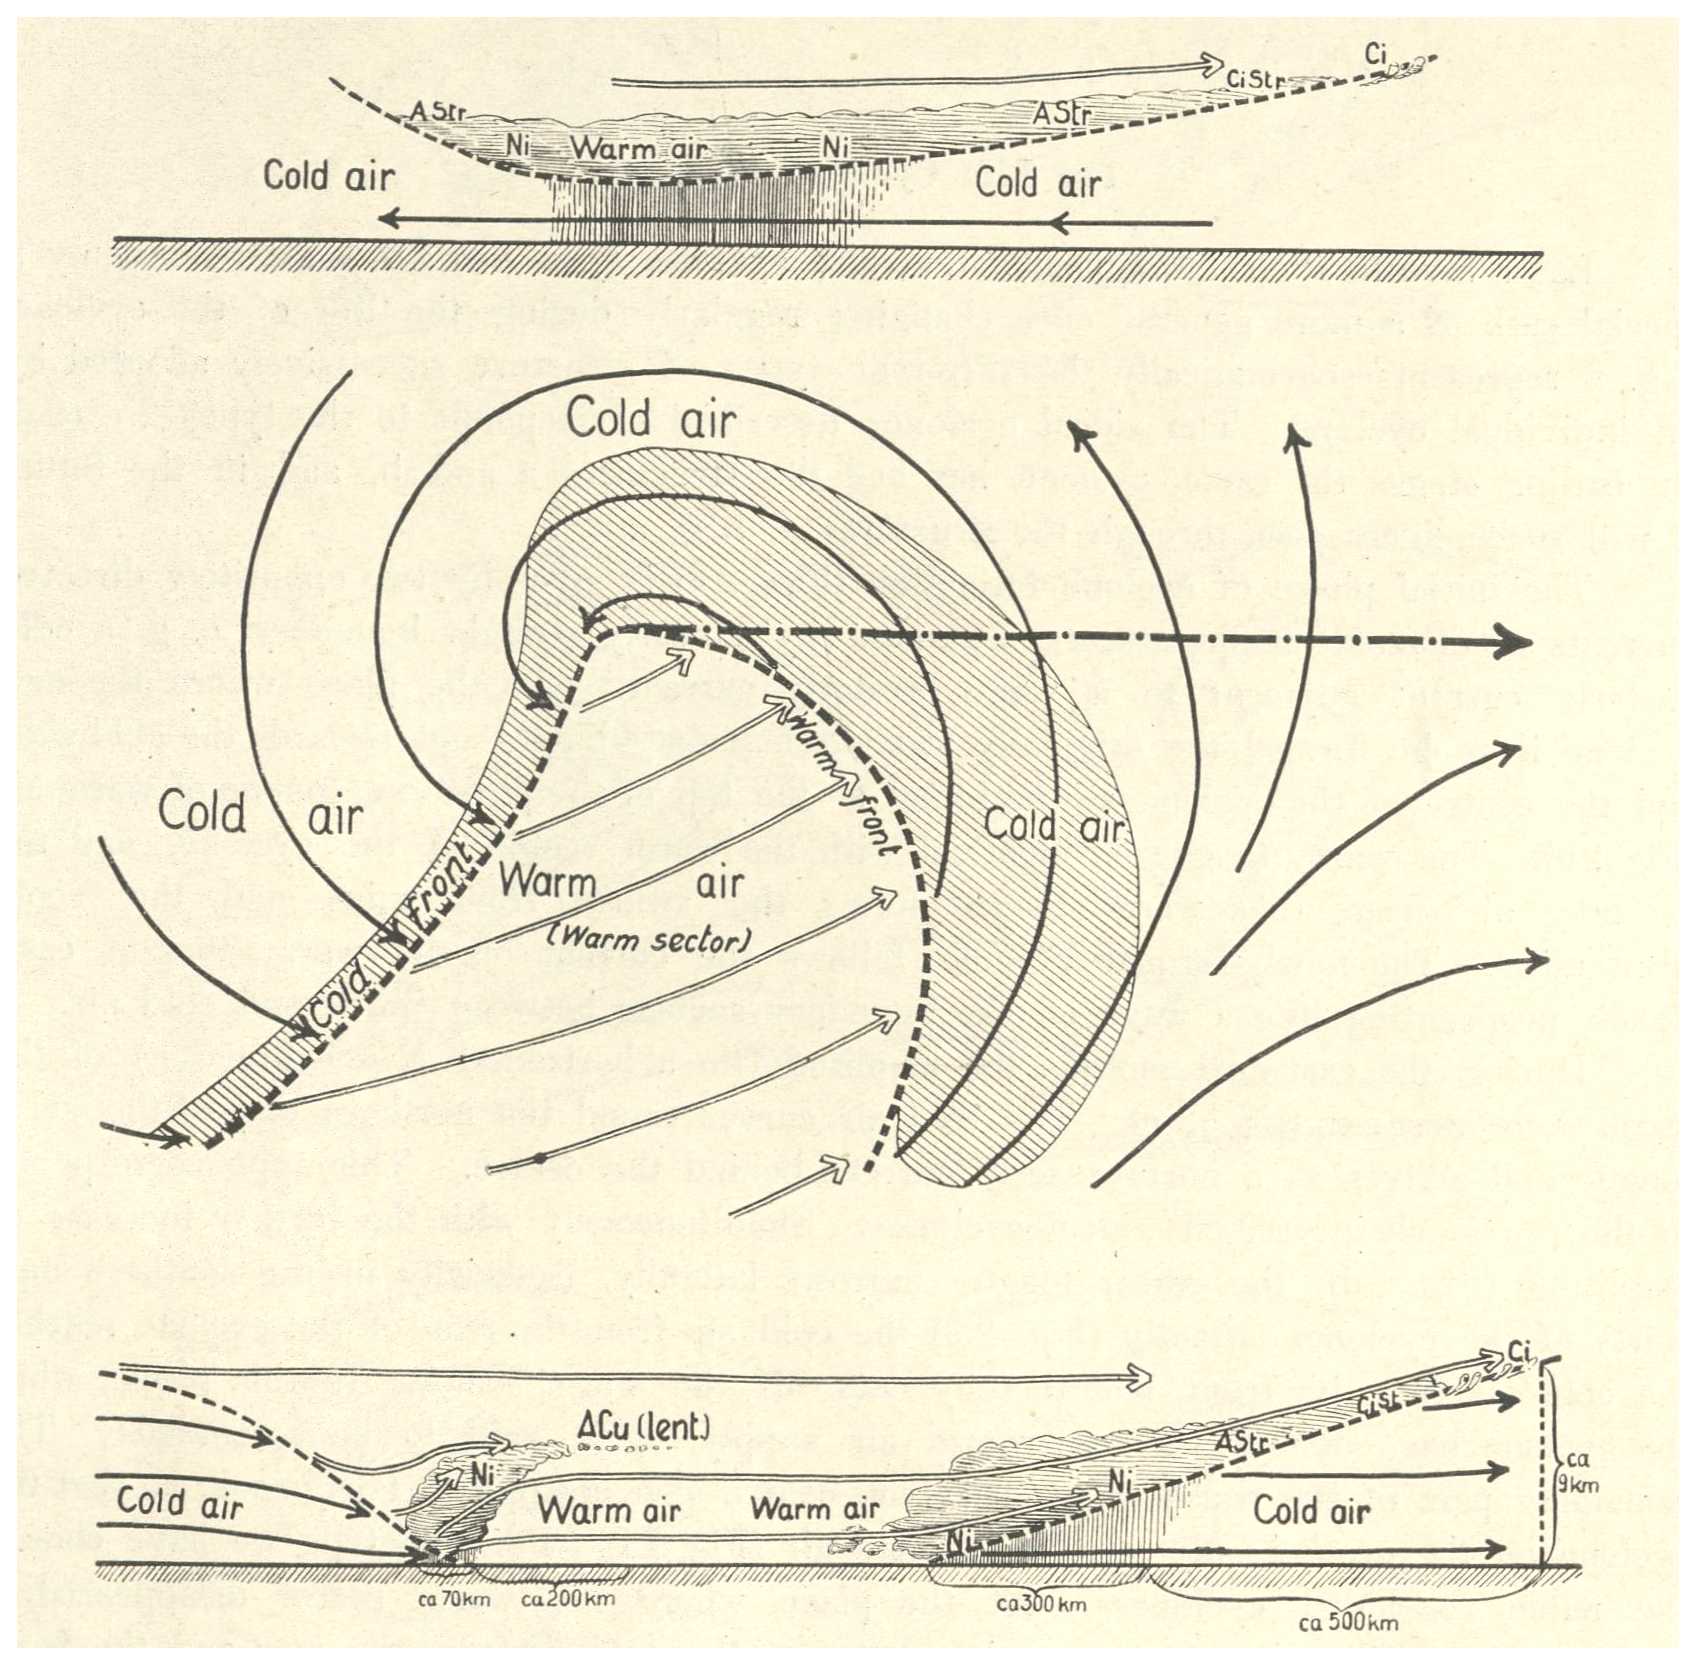
Figure 8Idealised Bergen cyclone model (Bjerknes, 1919) with typical cloud cover at warm and cold fronts and north of the pressure minimum centre: at the warm front, layered clouds form as the warm air gradually slides upwards; at the cold front, high-reaching cumulus clouds with showers and gusty winds form as the advancing cold, dense air suddenly pushes the warm air upwards.
In high-pressure systems, sinking air warms adiabatically, creating an inversion. In the eastern and cold part, shallow fair-weather cumulus clouds often occur due to intense radiation and ground-level instability extending to the subsidence inversion. In the western warm section of the high only few cirrus clouds can be expected.
A special feature is the mammatus type, from which downward instability can be diagnosed because cool, water vapour-saturated air lies above warmer and dry air and convection develops downwards; the classic explanation was given by Osthoff (1906). This cloud shape often forms at the lower edge of the cirrus anvil of a thundercloud. Schultz et al. (2006) show in a review that even today not all questions have been satisfactorily answered.
Cirrus clouds are particularly diverse due to the Kelvin-Helmholtz instabilities that often occur at this altitude and resulting turbulence from overturning waves (e.g., Quante, 2006).
When a cumulus cloud rapidly pushes up an overlying moist layer, a cap will develop (Fig. 22).
Some cloud shapes allow a short-term weather forecast being of interest to farmers as well as outdoor working craftsmen, military personnel, and seamen.
Early researchers recognized and investigated the evolution of clouds for weather prediction. Thomas Forster (1789–1860) pioneered early systematic observations of cloud morphology and its predictive value for weather changes. For example, the appearance and thickening of cirrus clouds can signal an approaching precipitation area (Forster, 1813). Another attempt was made in 1880 to use cirrus clouds for forecasting, following a suggestion of Ley. Abercromby (1842–1897) published the next approach to use cloud types for weather forecasting (Abercromby, 1885). He compressed his observations into two diagrams (Fig. 9), the first showing a low-pressure area, still without warm and cold fronts; the second diagram included the cloud types and the typical direction of movement of a low-pressure system over England. He emphasized the role of vertical wind shear in shaping cloud forms.
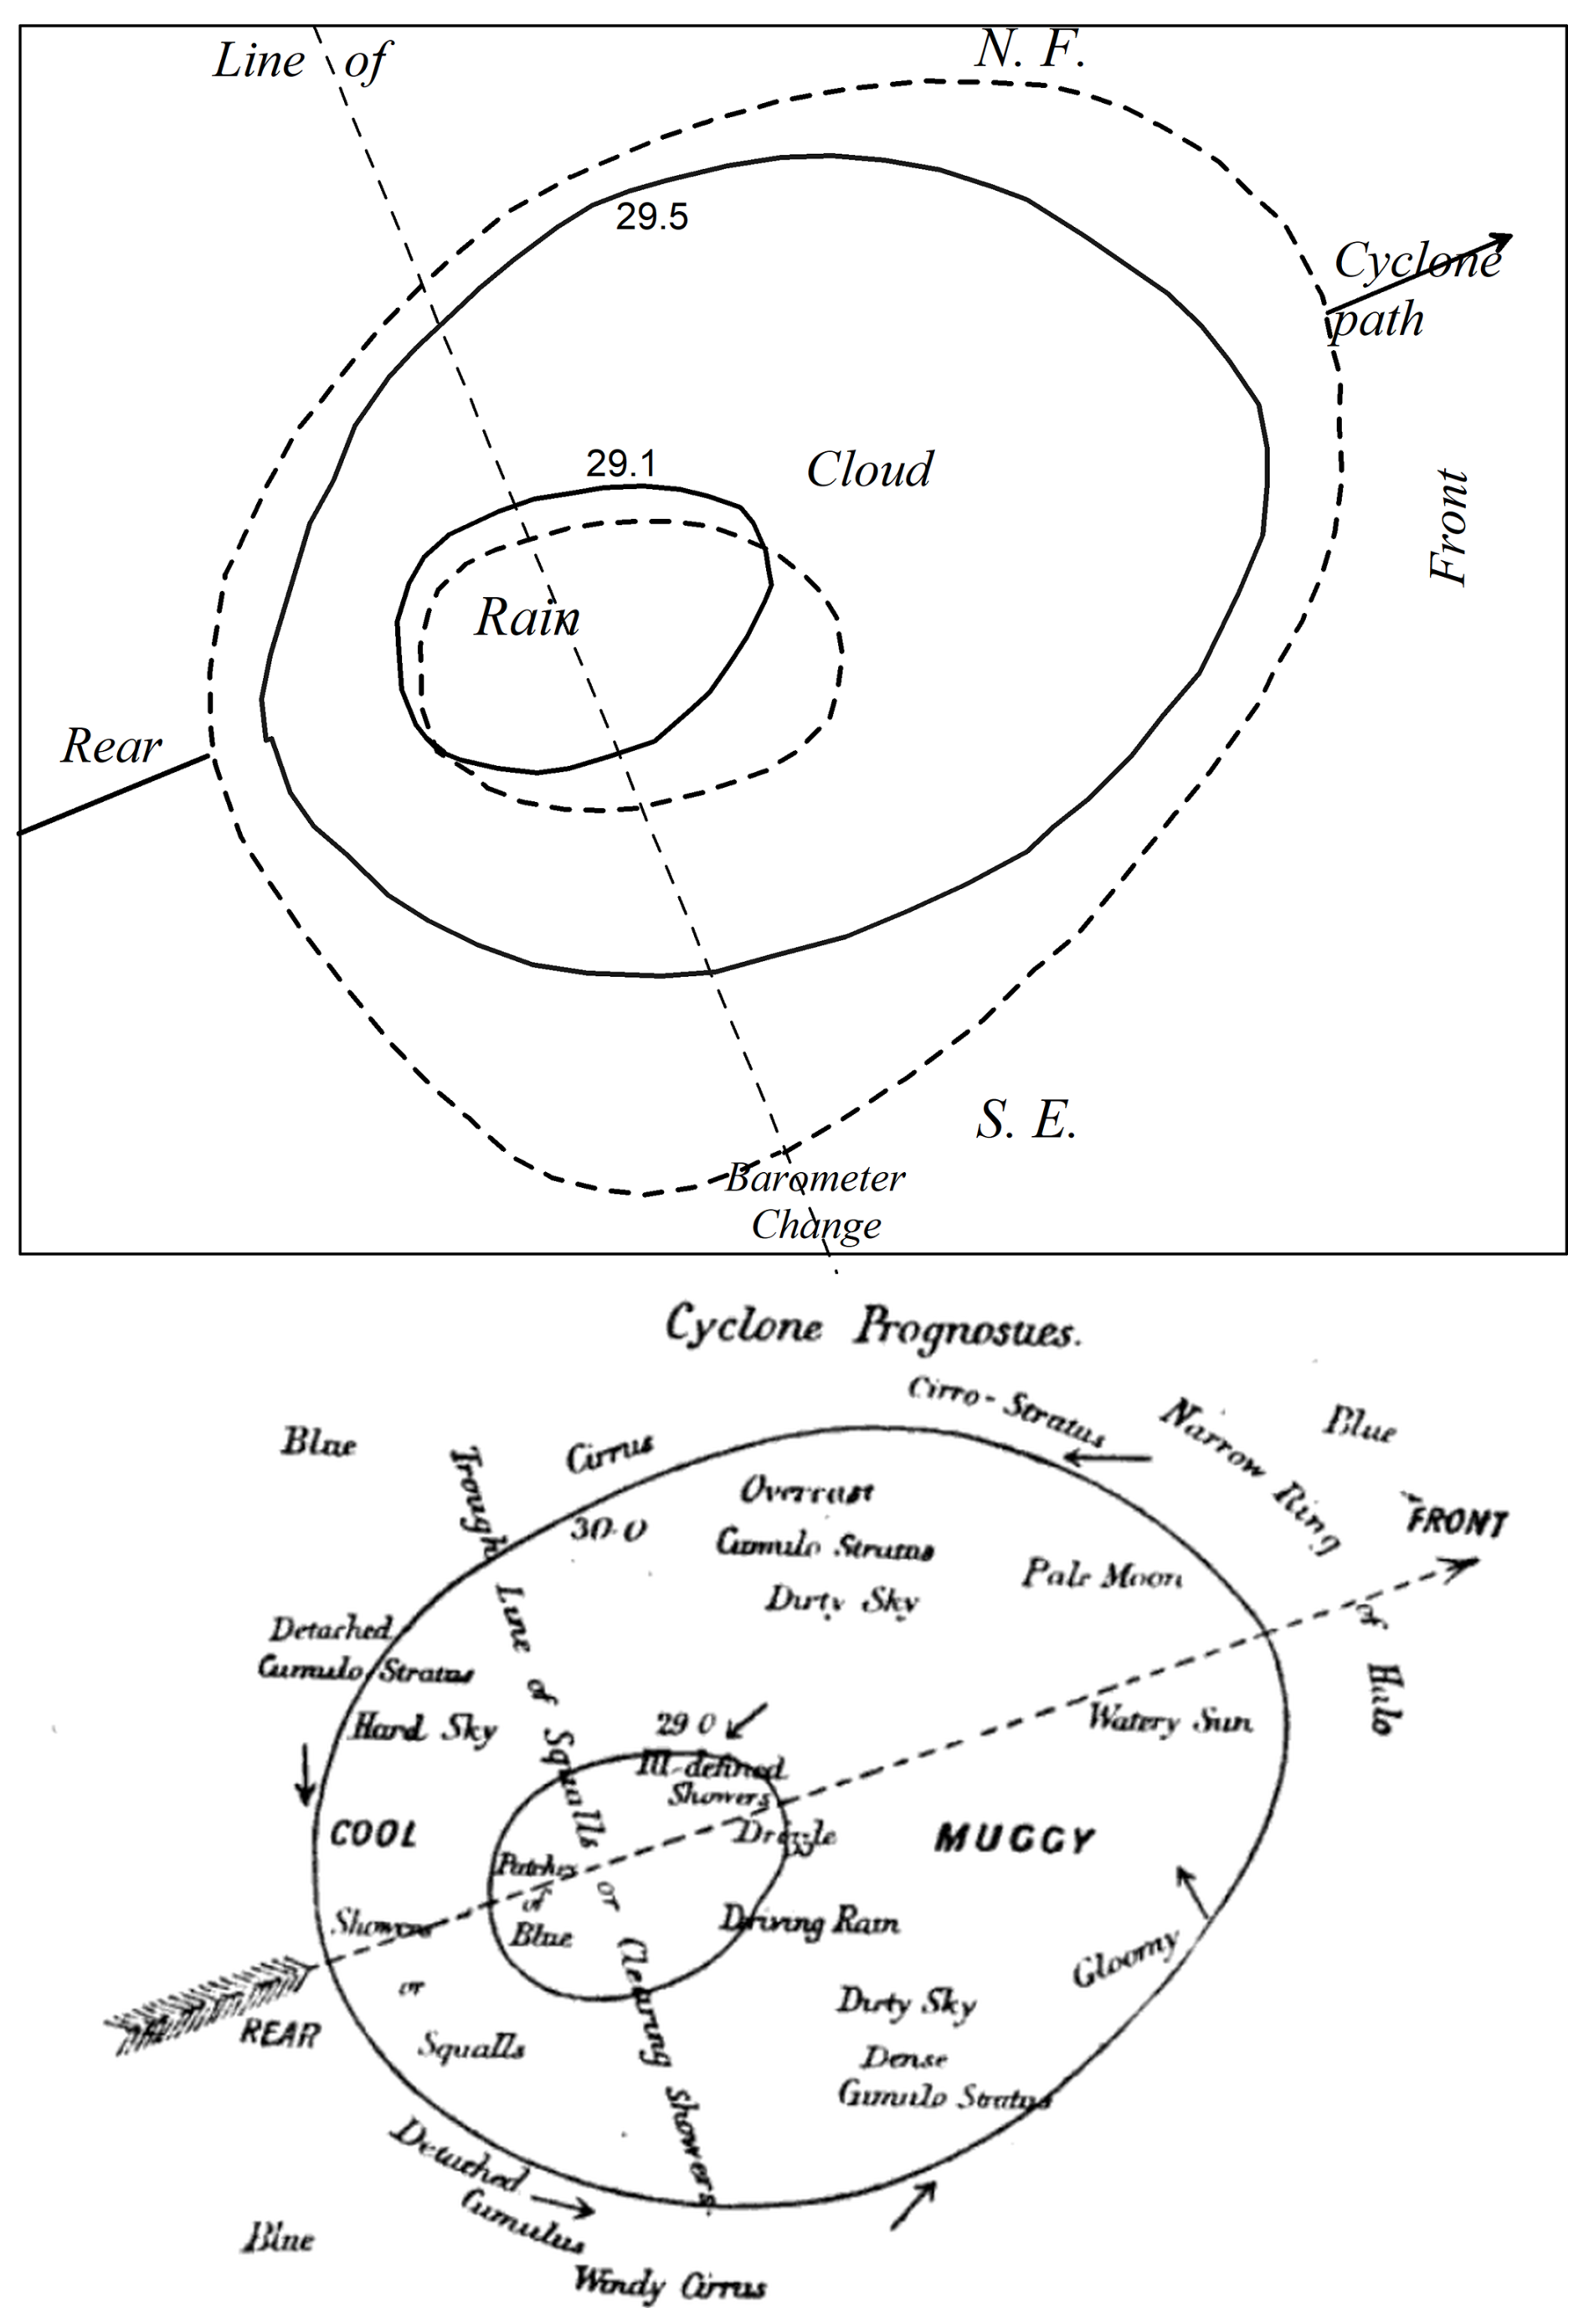
Figure 9Typical cloud types and other weather phenomena relative to the centre of a low-pressure system and its direction of movement (Abercromby, 1885).
Altocumulus castellanus clouds (Fig. 7) are reliable indicators of atmospheric instability, which usually produce thunderstorms some hours later (Ley, 1879; de Quervain, 1904).
The need for more research on atmospheric conditions that influence cloud formations was emphasized by the Meteorological Committee at its meeting in Zurich in 1888.
Much later, after the development of adiabatic charts or aerograms, meteorologists learned how to assess the development of cumulus and other cloud types, for example by means of the tephigram as shown by Poulter (1938).
The above-mentioned cloud type “polar bands” has undergone a change in meaning over the years. A. v. Humboldt suggested that electrical forces would split cirrus into parallel bands aligned with the Earth's magnetic field towards the magnetic pole (Zöllner, 1871). Around 1870, polar bands received increased attention again. Prestel (1874) described the polar bands as parallel strips of cirrocumulus or cirrostratus, which seemed to converge towards the horizon due to perspective and which often oriented towards the magnetic pole. In Jutland, Sophus Tromholdt (1851–1896) also frequently observed polar bands (Tromholdt, 1873). At the International Meteorologists' Congress in Paris in 1879, it was noted that polar bands were rarely observed in France, but it was confirmed that their observation on the Antilles had repeatedly announced the arrival of hurricanes (de Touchimbert, 1879, p. 505). The convergence point was considered to mark the centre of a storm field. This naturally attracted attention of mariners.
As air ascends while flowing over mountainous terrain, cap cloud formation can occur if the water vapour reaches the saturation point. In the lee of high mountains, stationary banner clouds or so-called parasitic clouds can develop (Lampadius, 1806, p. 134; Kober, 1871, p. 398); their formation conditions were misunderstood for a long time. Mountain ridges can generate waves in the lee, at the maxima of which lenticular clouds form, provided the water vapour exceeds the saturation point.
Mountains favour the formation of thunderstorm clouds (Börnstein, 1901).
In 1889, Mohorovičić described a stationary rotor cloud at the coast of Croatia (Fig. 10) (Mohorovičić, 1889).
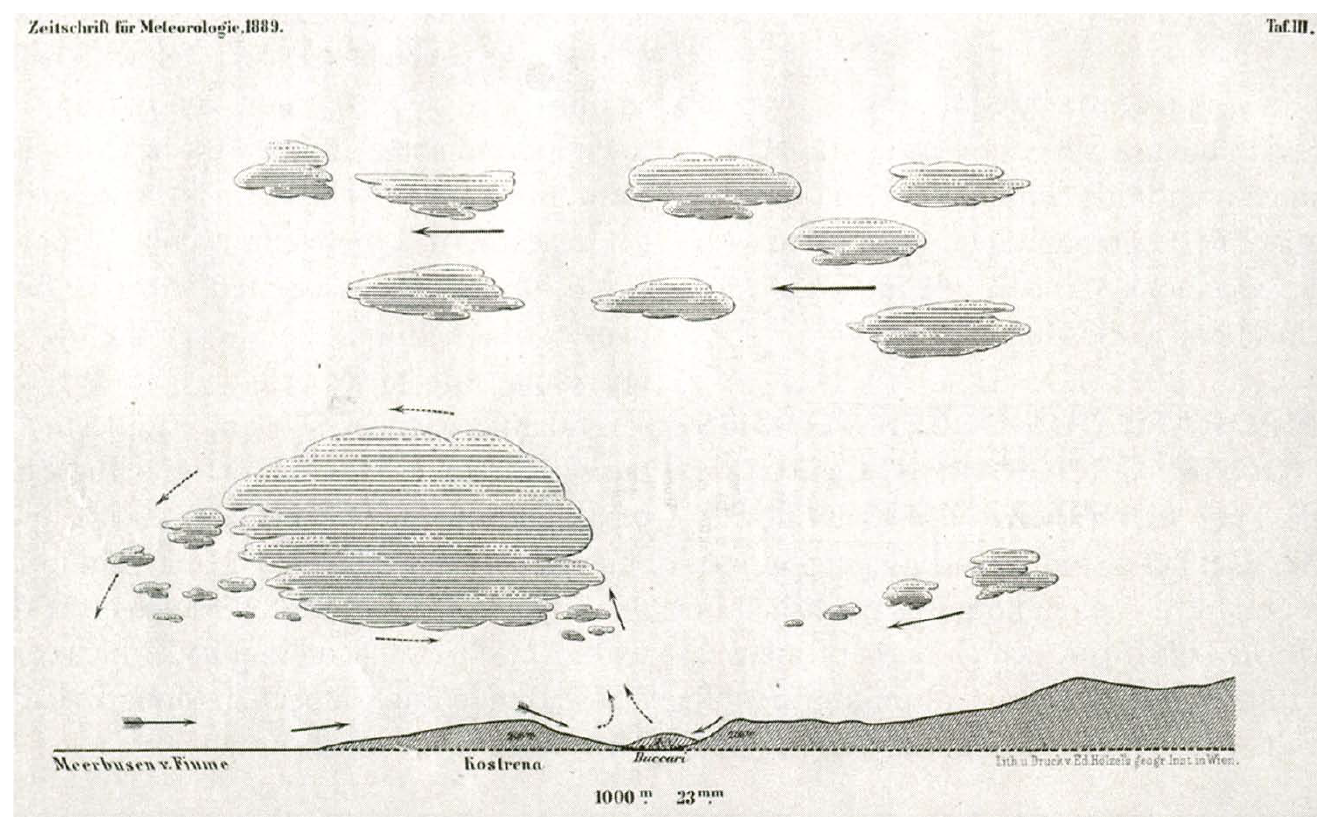
Figure 10Rotor cloud in the lee of the Yugoslav Adriatic coast.
Observations from both, balloons and airplanes have confirmed that a river course can become visible in a closed cloud layer (Fig. 11) (Erk, 1898) or even cause its dissolution (Anonymus, 1917, Fig. 127).
Figure 11Aerial photograph of a closed cloud cover (Anonymus, 1917) that has dissolved over the course of a river.
High-altitude wind speed and direction were of great interest, for which cloud heights had to be precisely determined requiring new techniques. Relevant experiments had already begun in many countries, e.g. at the Kew Observatory in London by Strachey and Whipple (1891), but uncertainties in the alignment of the optical axes of both cameras still had to be overcome. The IMC decided in Uppsala in 1894 to establish the International Commission for Cloud Research (dissolved in 1910) to prepare for the International Cloud Year 1896/97. Members included Hildebrandsson (Sweden), Riggenbach (Switzerland), Neumayer (Hamburg/Germany), and Abercromby (England) who recommended the determination of cloud height and direction of movement through corresponding photographs (Sprung, 1895). Specially trained scientists from 11 countries started observations and finally, 27 nations participated in that program (IMC meeting in St. Petersburg, 1899). In 1921 a new Commission for the Study of Clouds (dissolved in 1935) was established by Sir Napier Shaw in London to revise the international classification and to edit a new atlas of clouds (Cannegieter, 1963, p. 261).
As mentioned above, Espy described in 1841 the importance of the release of latent heat for enhancing convection during condensation. Robert Mayer's (1814–1878) work laid the ground for a deeper scientific investigation of weather phenomena. The first law of thermodynamics, also known as the law of energy conservation, states that energy cannot be lost but only transformed. Moist-labile instability in the atmosphere can be calculated by the amount of latent heat being released during cloud formation, ultimately resulting in increased buoyancy. This process is crucial for cloud formation and precipitation, as the rising air cools and moisture condenses and makes it possible to calculate the height up to which cumulus clouds can develop.
The first adiabatic chart of Hertz was mentioned in Sect. 3.1; this diagram was improved by Neuhoff (1900). Shaw introduced the tephigram in 1915 (Shaw, 1919) and a total of more than 20 different adiabatic charts were subsequently developed, each being optimised for a special thermodynamic task. Cloud development (Fig. 12) could be rapidly assessed using adiabatic charts which became increasingly important for the rapidly growing aviation after World War I. Cloud shapes were now communicated by weather telegrams.
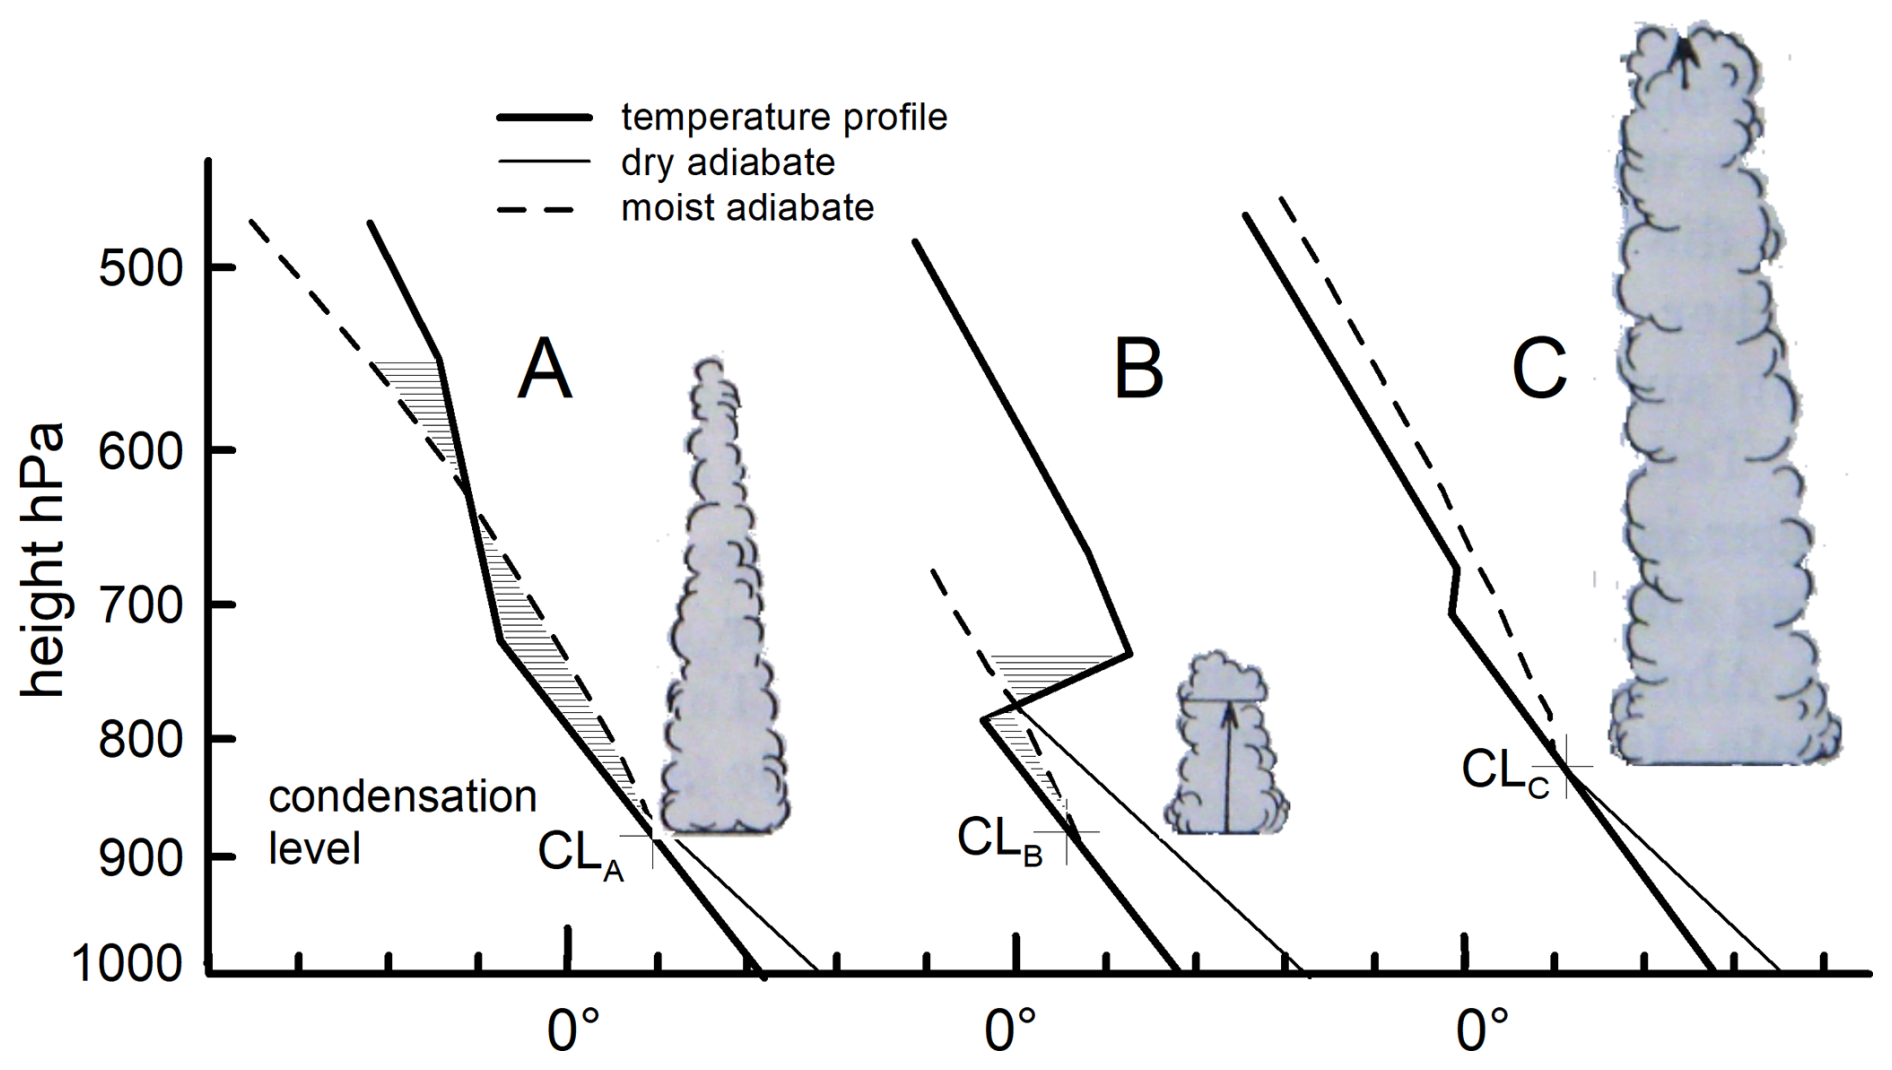
Figure 12Three examples showing how convection depends on the condensation level CL and the vertical extent of moist-adiabatic unstable layers.
V. Bezold suggested that waves can be generated independently of cloud formation, and would then imprint grooves on a stratus layer. From parallel strips, one can infer the presence of overlying air parcels of different densities that generate waves when flowing with different velocity. Helmholtz (1888) had developed the theoretical explanation of wave formation and he had introduced the new term heat content (Wärmegehalt) which von Bezold (1888) proposed to replace by potential temperature.
The formation of the cellular structure of layer clouds was theoretically explained by Bénard (1884–1939). He showed that cells (Fig. 13) develop when a critical temperature difference is exceeded between the lower and upper sides of a cloud layer (Bénard, 1900). The upper side cools due to long-wave radiation to space, while the cloud base is warmed by geoterrestrial radiation. Lord Rayleigh (1842–1919) also derived a formula in 1916 to describe the conditions for these convection patterns (Rayleigh, 1916).
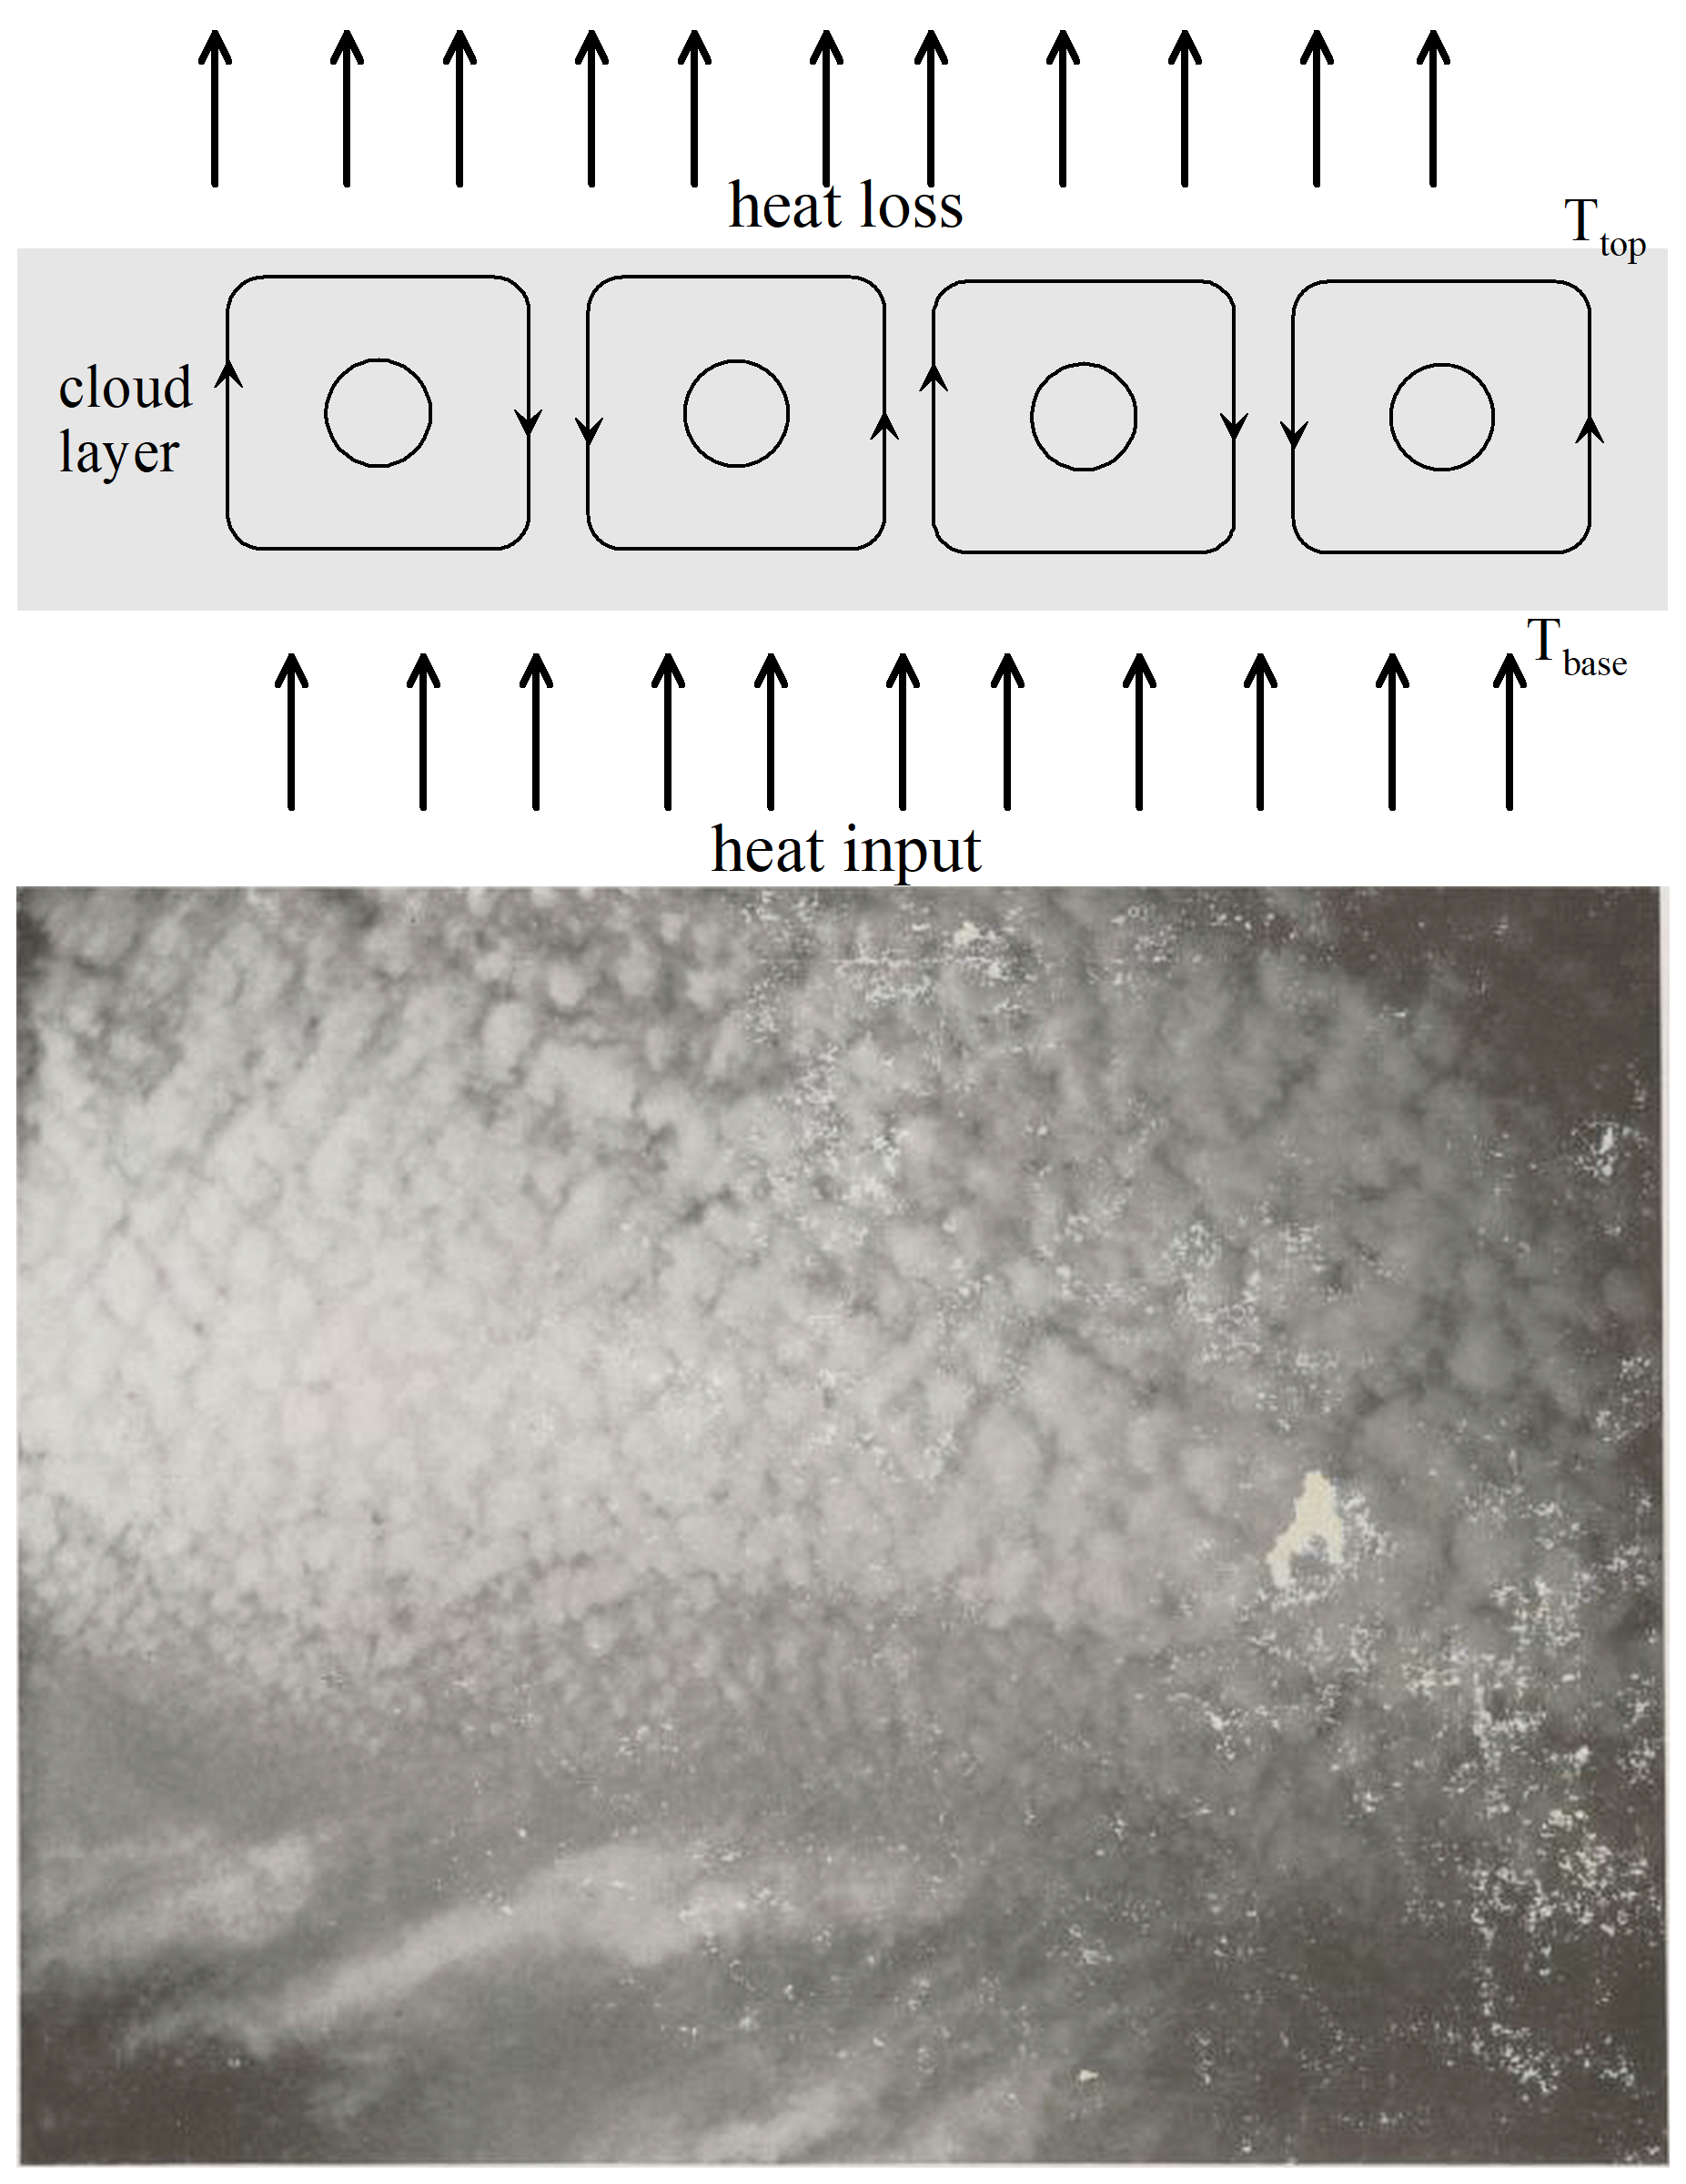
Figure 13Bénard-cells form when a critical temperature difference is exceeded between the lower and upper sides of a layer cloud; right: Altocumulus (Int. Cloud Atlas 1930, p. 25).
The exploration of the third dimension with manned balloon flights and measuring atmospheric parameters appreciably improved understanding of cloud shapes. Early instruments at flights before 1880 suffered from significant measurement errors. Particularly temperature readings were distorted by radiation biases (Assmann et al., 1900, p. 15ff.) and barometers could be affected by the acceleration of the balloon. Assmann developed an aspirated psychrometer allowing a reliable determination of temperature and moisture which was finalised in 1892. However, flights through wave clouds confirmed that the balloon followed the wave motion, indicating the presence of a wind shear.
A notable experience was gained during a night-time flight by Pierre Testu-Brissy on 18 June 1786, in Paris (Turgan, 1851, p. 157f.). He encountered a thunderstorm and observed snow crystals and various light phenomena amidst continuous lightning. At times he was inside a rain cloud, at other times inside a snow cloud. Light on a metal tip was tuft shaped in rain clouds and dot shaped in snow clouds, leading Testu-Brissy to infer the presence of positive or negative electrical charge (Turgan, 1851, p. 106f.).
The Munich Association for Airship Navigation embarked on its first scientific ascent in 1889 and completed 24 ascents until 1894. Isothermal layers and inversions in the free atmosphere were detected (Fig. 14).
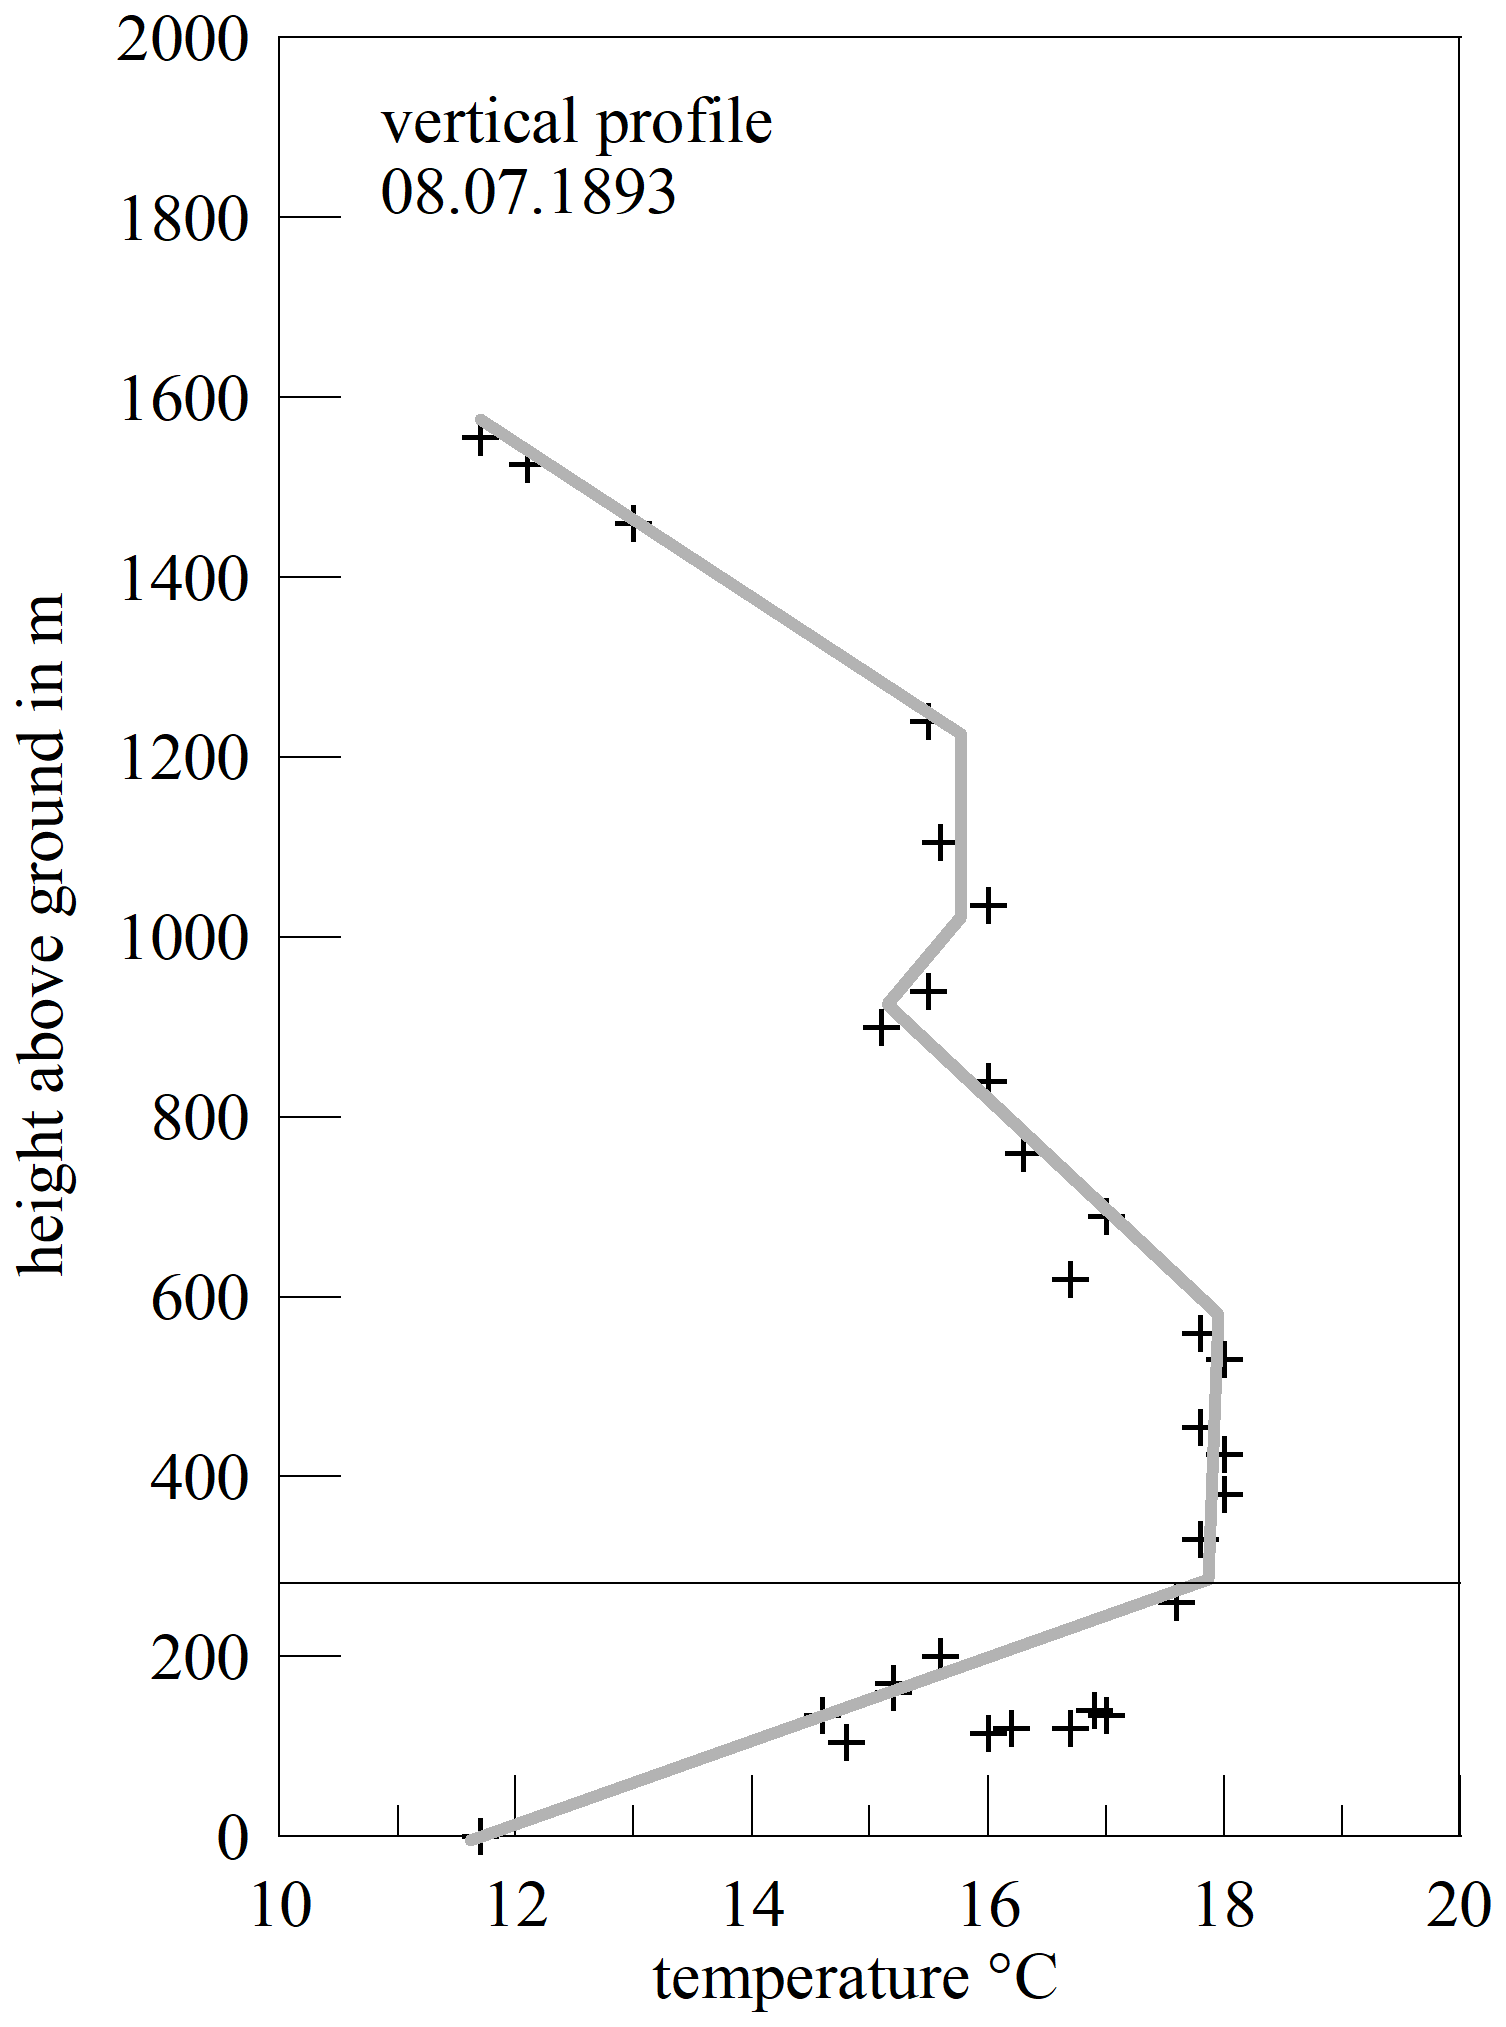
Figure 14Balloon ascent with a vertical temperature profile on 8 July 1893 near Munich showing a ground inversion, isothermal layers and an inversion in the free atmosphere. The ascent and descent also provided information of the temporal change in the profile.
In 1890, an aerological association in Berlin conducted 36 ascents until 1894. Assmann et al. (1900) performed 68 ascents from 1888 to 1896, but altitudes above 6000 m were rarely reached due to the danger of oxygen risk. With the establishment of the Aeronautical Observatory Berlin-Tegel in 1900 (Assmann, 1906), later relocated to Lindenberg east of Berlin, this research was intensified. In 1903 and 1904, almost daily ascents with kites or balloons were carried out (Dubois, 1993, p. 34). Averaged moisture profile of 68 balloon ascents showed the existence of moist layers at preferential altitudes in the atmosphere over Berlin (Süring, 1901). Whether his result could be generalized, was never checked.
In France, the most frequent balloon ascents were arranged, with active centres in Paris, Lyon, and Besancon. A total of 61 ascents were conducted in 1904 alone (Illustrated Aeronautical Communications, 9, 1905, p. 409–410).
Hugo Hergesell (1859–1938) was elected as chairman of the Aeronautical Commission founded in 1896 at the IMC conference in Paris. In 1900 the commission recommended that on fixed days simultaneous balloon or kite ascents should be conducted combined with cloud observations. Early balloon ascents revealed colder cloud layers beneath the top of a closed cloud sheet that resisted the descent of balloons and causing it to swim (Süring, 1895, p. 19). Wegener (1911) emphasized that significant progress had been achieved through the discovery of inversions in the free atmosphere occurring also above mountains, creating conditions for layer clouds below the inversion and favouring phenomena such as Helmholtz waves or Bénard cells (Süring, 1910).
Tissandier in France concluded from many balloon ascents that Howard's cloud classification was often inaccurate (Tissandier, 1886). Clayton's recommendation (Clayton, 1896) to treat clouds separately by form, height, and origin was rated as unsatisfactory because it differed too much from the internationally agreed classification scheme (Süring, 1900). The importance of atmospheric stability for determining cloud types became obvious only much later, especially from weather flights with planes (Fig. 15a). Brooks (1941) from Harvard University had reviewed the “very appreciable European literature” and evaluated data of weather flights from Königsberg in 1931. He showed how stable and unstable air layers affect cloud formation (Fig. 15b). Stable layering hampers vertical motion. In unstable air, instability fosters the formation of clouds and precipitation.
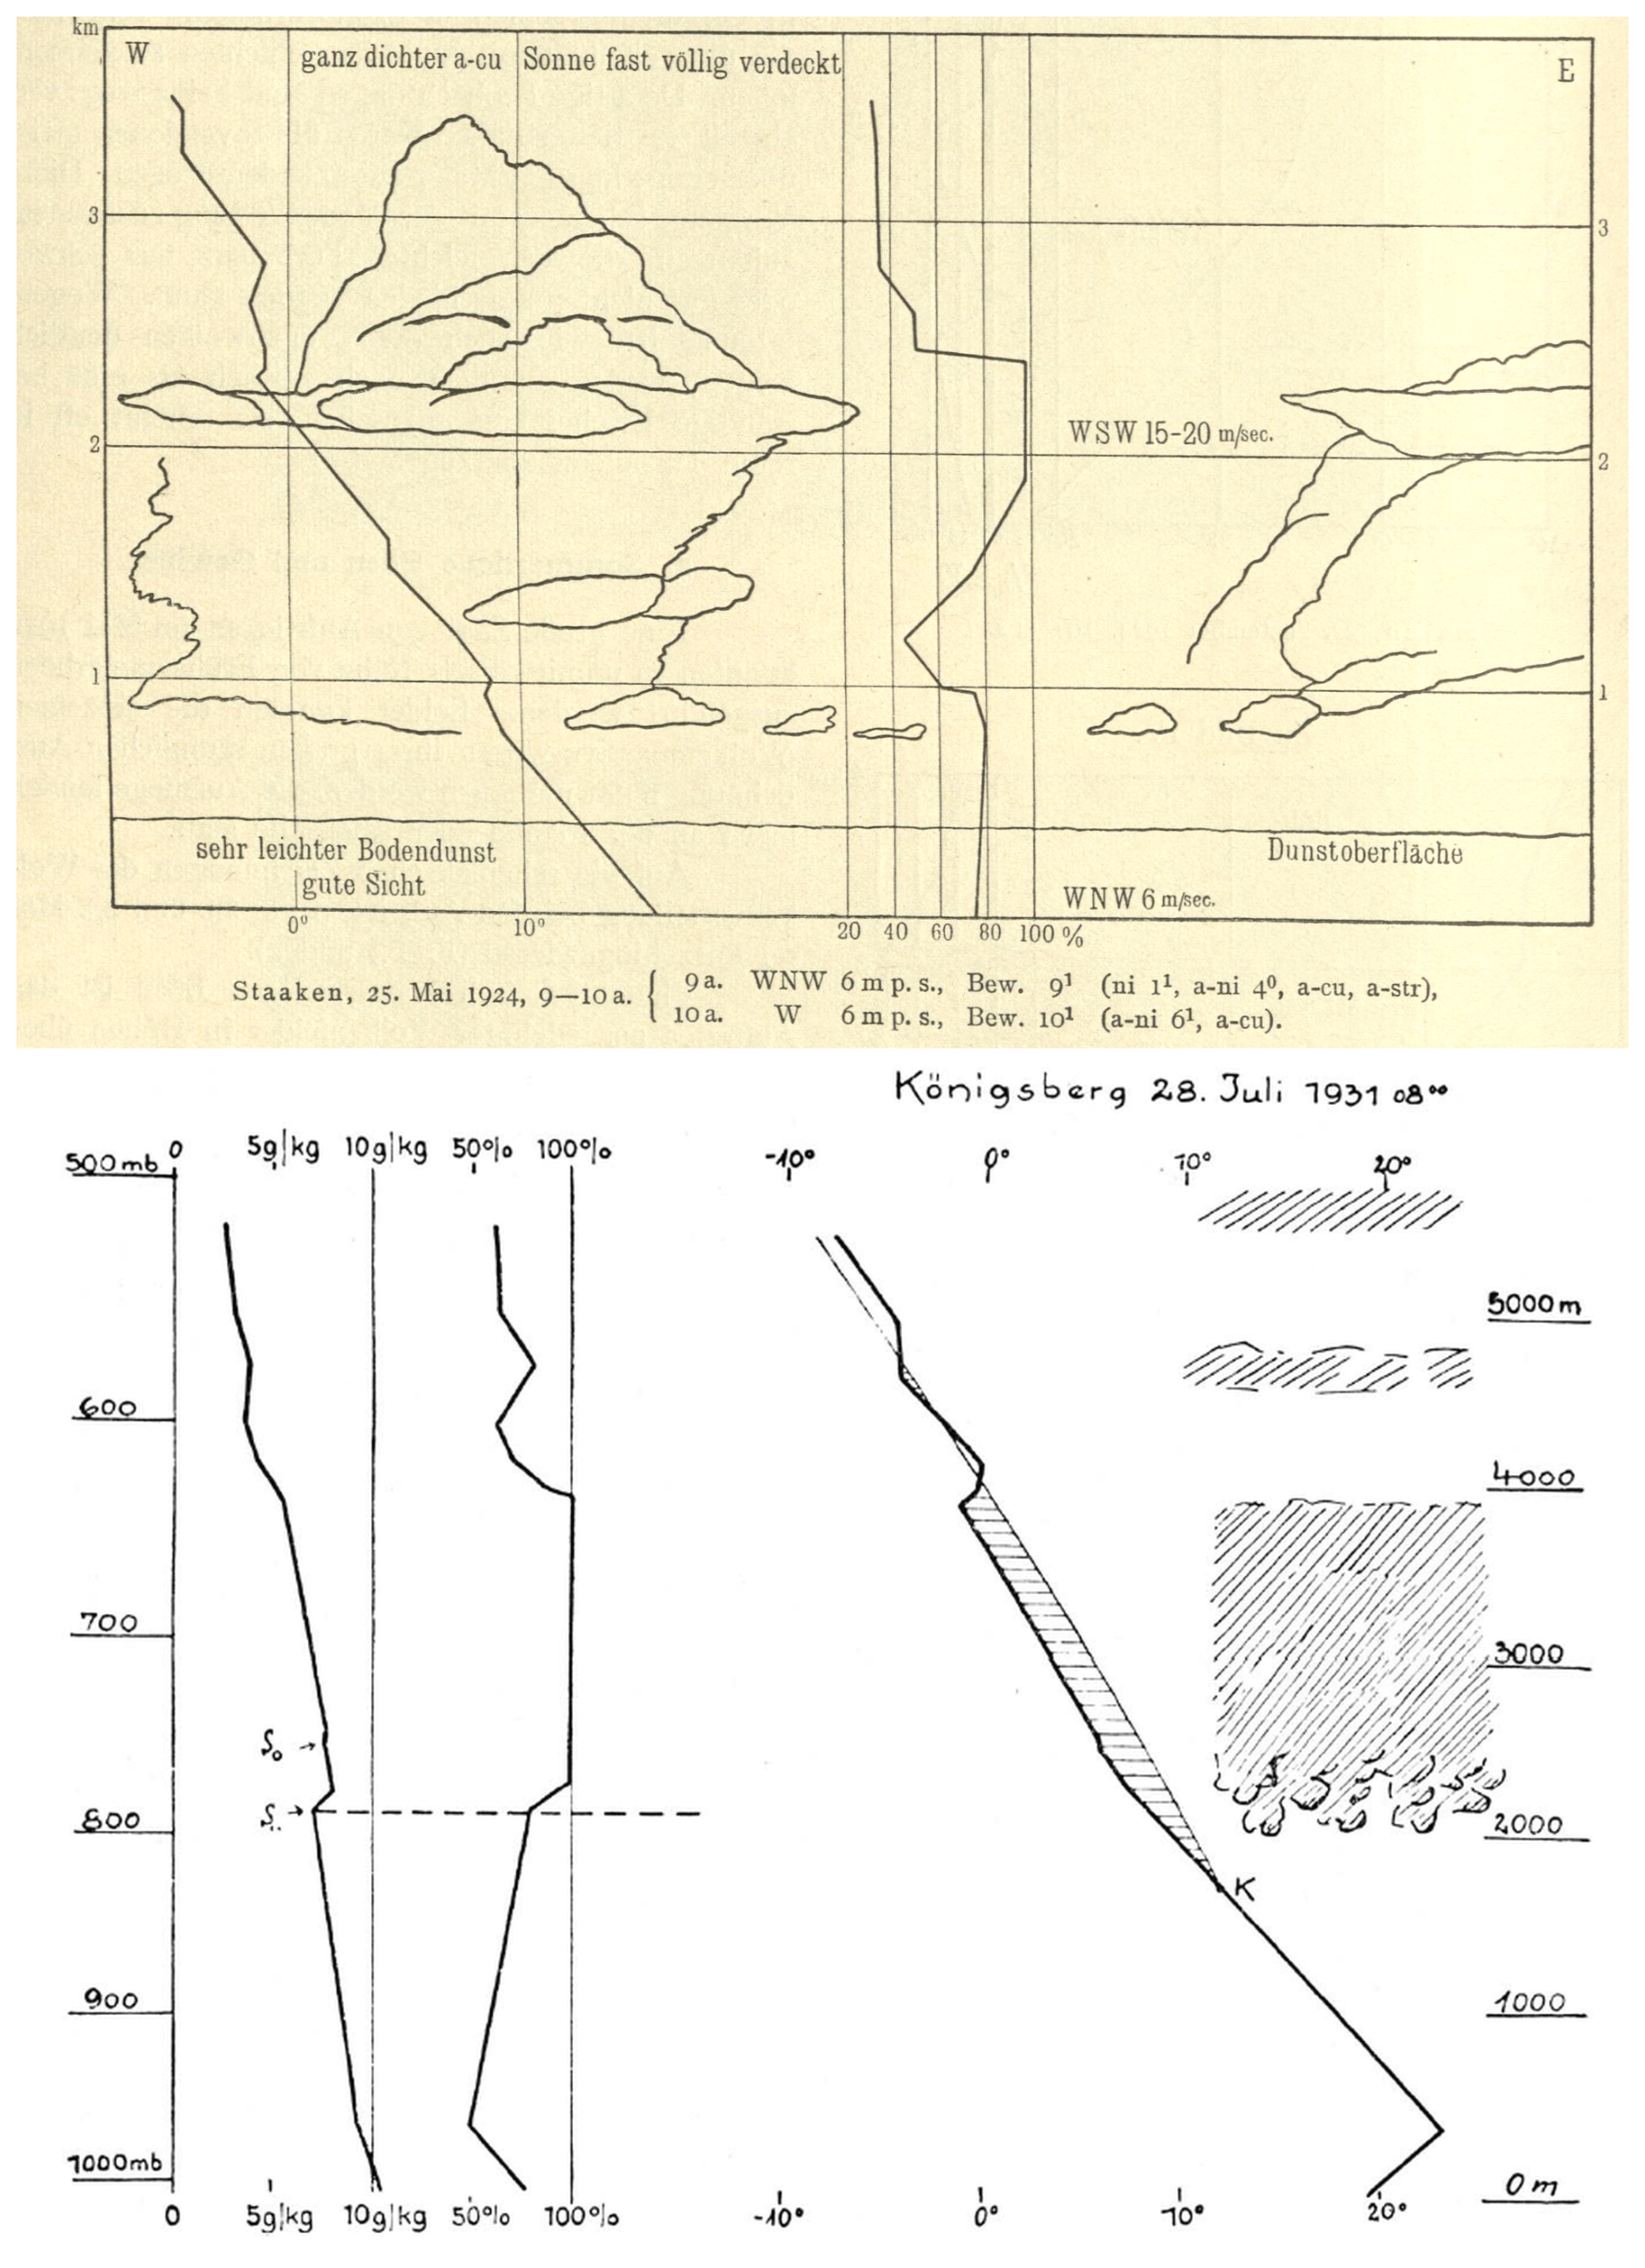
Figure 15Above: Weather flight with vertical profiles of temperature and humidity causing observed cloudiness (Wegener and Schneider, 1926); below: Evaluation of cloud formation by Brooks (1941) obtained from a weather flight in Königsberg at 28 July 1931.
So-called “false cirrus clouds” form in the anvil of a thunderstorm when the outflow freezes and produces virgae (e.g. Vincent, 1901). The term is out of use, as these clouds are real ice clouds.
Vettin (1882) used a camera obscura to determine cloud movement. In 1888, Mohorovičić also applied this technique, complemented by a compass (Mohorovičić, 1888).
In 1890, Hildebrandsson initiated an international program to determine upper-level winds from cloud movements during the International Cloud Year 1896/97. Several devices were now developed to accurately measure cloud height (Fig. 16):
-
cloud height determination using two-point observations with theodolites;
-
use of an aurora borealis theodolite (Föyn, 1900);
-
photogrammetry (Koppe, 1896).
Initially, observers at 13 stations worked with Koppes photogrammeter. The method was highly labour-intensive, requiring two photographers to focus on a special cloud point and take simultaneous photographs with precisely known angles for trigonometric evaluation. In Berlin, the method with two theodolites was improved into a so-called cloud automat, where two vertically aligned cameras spaced about 1500 m apart could be simultaneously exposed to light by a radio signal, and stored photographic plates could be automatically changed. Technically significant was the use of silver-eosin-coated mirror glass plates, which remained usable for weeks (Süring, 1922). Only one person was now required for operation.
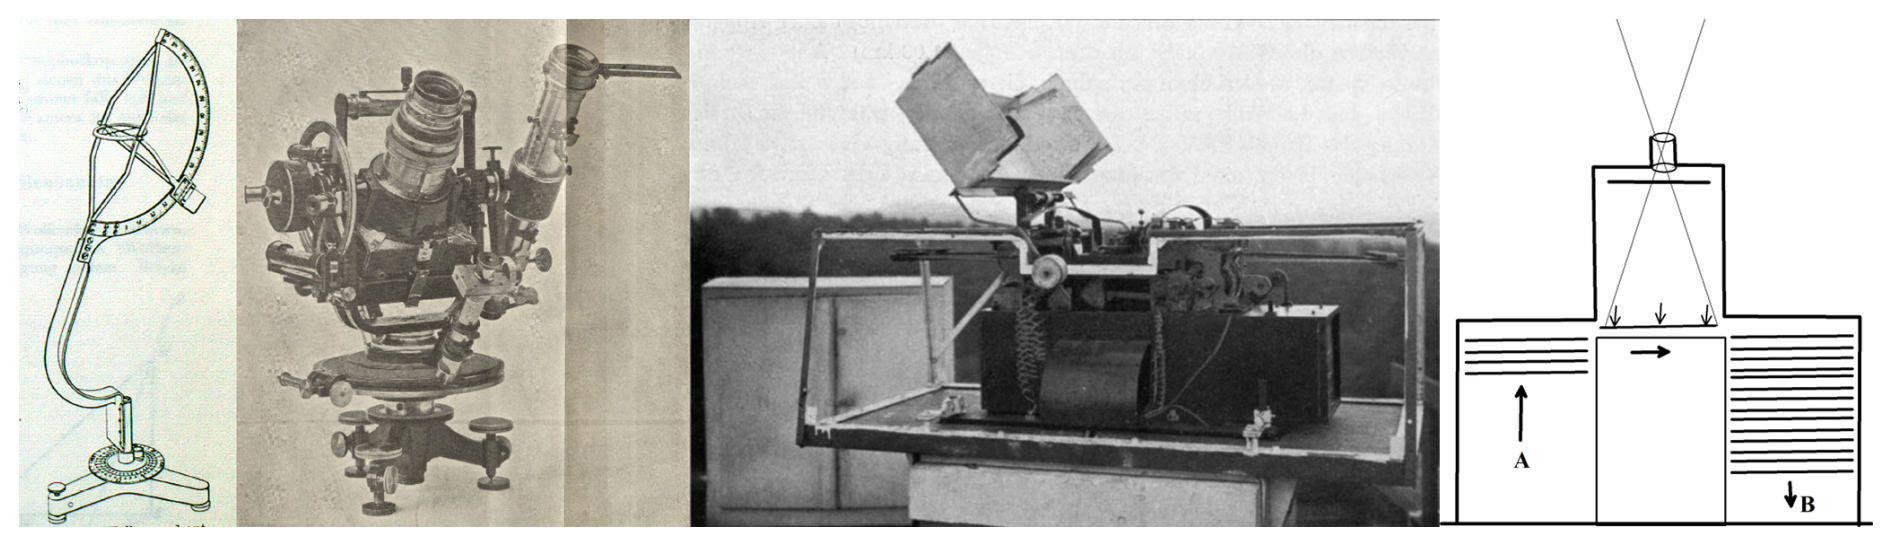
Figure 16Instruments for cloud height and cloud drift measurement include the simple cloud theodolite (Schleich, 1932), the photogrammeter of Koppe (1896), and the cloud automat of Sprung (Hellmann, 1912). Initially, observations were made at only few stations in Europe.
Hildebrandsson (1877) had evaluated data and plotted the movements in altitude charts at 4000 m (Fig. 17). Comparison with isobaric maps revealed divergent flow over lows and convergent flow over highs, allowing conclusions to associated vertical motions in these pressure systems.
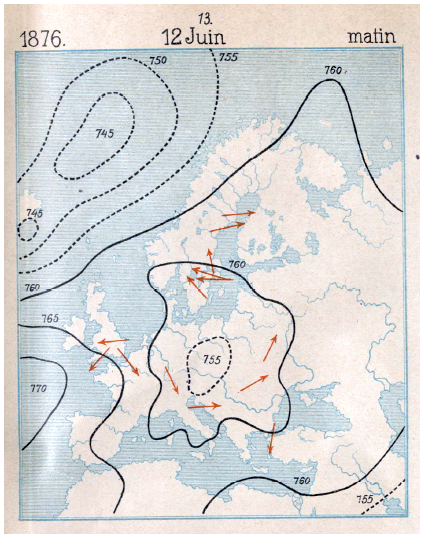
Figure 17Upper-level winds obtained from cloud observations in comparison to isobars at 4000 m altitude compiled by Hildebrandsson (1877).
First studies on the vertical velocity within clouds using a variometer on a balloon were reported by Ludewig (1911).
In 1918, Köppen noted in a brief communication that one of the most urgent tasks in meteorology was to link cloud forms with results from aerological ascents. Obviously, there were still deficits in an unambiguous determination of cloud forms.
At the meteorological congress in Munich in 1891, the first cloud classification with 13 types was adopted based on the suggestion of Abercromby and Hildebrandsson (Abercromby, 1887a). Abercromby had travelled around the world twice to verify that the same cloud types appeared everywhere (Abercromby, 1887b).
Von Bezold (1894) referenced the unexplained diversity of cirrus forms and intermittent wave signatures. Even until 1922, cirrus cloud forms had not been standardized. A revised International Cloud Atlas and a unified but still preliminary nomenclature were the result of many meetings and internationally coordinated cloud research.
The inadequacy of photography in representative cloud photos had been a serious problem for a long time. Initially, photography was completely insignificant because clouds could hardly be distinguished from the blue sky on photographic plates. A first improvement was achieved using yellow filters (Hildebrandsson, 1889). Riggenbach (1889) in Switzerland recognized the use of mirrors in cloud photography: Since the blue sky emits strongly polarized light and clouds emit only weakly polarized light, the reflected image on the photographic plate become high-contrasting (Wolf, 1993, p. 14f.). Nevertheless, photographic limitations remained a prolonged difficulty for the edition of cloud atlases.
In 1890, a first international Atlas des Nuages appeared with painted cloud images in French, English, and German language (Hildebrandsson et al., 1890).
At the IMC meeting in Munich, a first classification of cloud types was agreed upon in 1891, and an Atlas Committee was formed (members were: v. Bezold (Prussia), Bilwiller (Switzerland), Davis (Argentina), Hann (Austria), Hepites (Romania), Hildebrandsson (Sweden), Mascart (France), Mohn (Norway), Paulsen (Denmark), Scott (England), Snellen (Netherlands), and Tacchini (Italy)). In 1892, a call was published in many meteorological journals, asking artists and amateurs to send in cloud images to Committee members so that an appropriate selection could be made based on scientific criteria.
The Atlas Committee met in Uppsala in 1884 (Rotch, (Blue Hill, USA), Teisserenc de Bort (Trappes, France), Weilbach (Denmark), Broounof (Russia/Ukraine), Fineman (Sweden), Hagström (Sweden), Riggenbach (Switzerland), and Sprung (Berlin)). They selected suitable images for the international atlas from an exhibition of 300 photographs taken in different countries. In 1896 the 1. International Cloud Atlas, edited by Hildebrandsson, Riggenbach, and Teisserenc de Bort, was published, along with observer instructions (Hildebrandsson, 1896). To achieve a realistic impression, cloud images were combined with other foregrounds, and retouching was done (Wolf, 1993, p. 40), however, the applied light-printing method was still deemed to be inadequate. In Table 2 a selection of cloud atlases is compiled.
The next International Commission for the Study of Clouds, established by Napier Shaw in 1921, should edit an improved atlas. Shaw (1926, Vol. I, p. 212) remarked about the agreement achieved at the first meeting in 1923: “The classification is perhaps not yet in its final form”. The final nomenclature was agreed at the 6th Directors' Conference in Copenhagen in 1929, where the 3. International Atlas of Clouds (abridged 1930, full 1932, revised 1939) was prepared. It provided 174 photographs for cloud families, species, and varieties, with a detailed instruction for observers working in operational meteorology (Fig. 18). The first 1932 edition was financed for by Spanish maecenas Patxoty Jubert from Barcelona. Nations were free to translate it in their own language (Cannegieter, 1963, p. 204–212).
Table 2Compilation of cloud atlases (for comlete quotations see references).
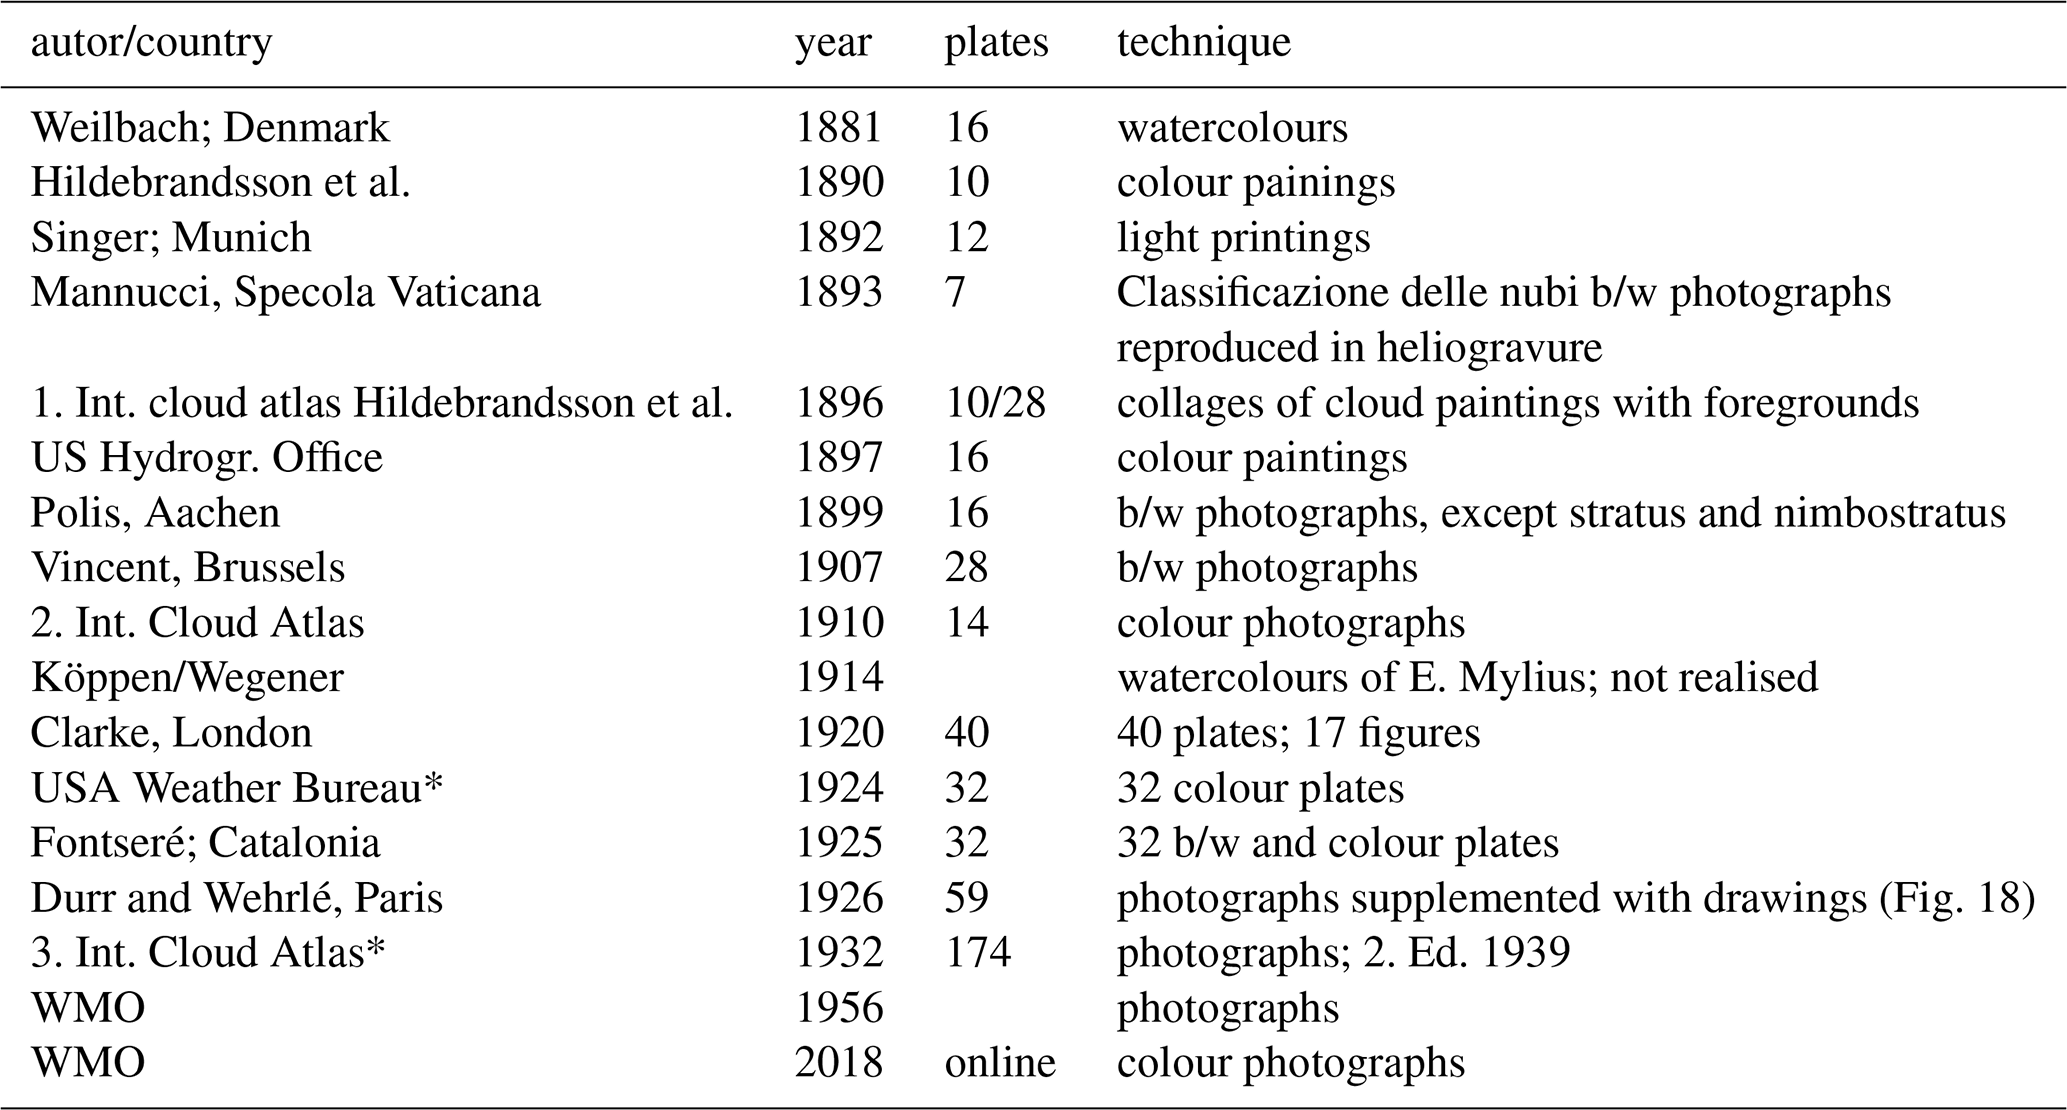
* Many nations edited own cloud atlases based on the same pictures, because the original was edited only in French.
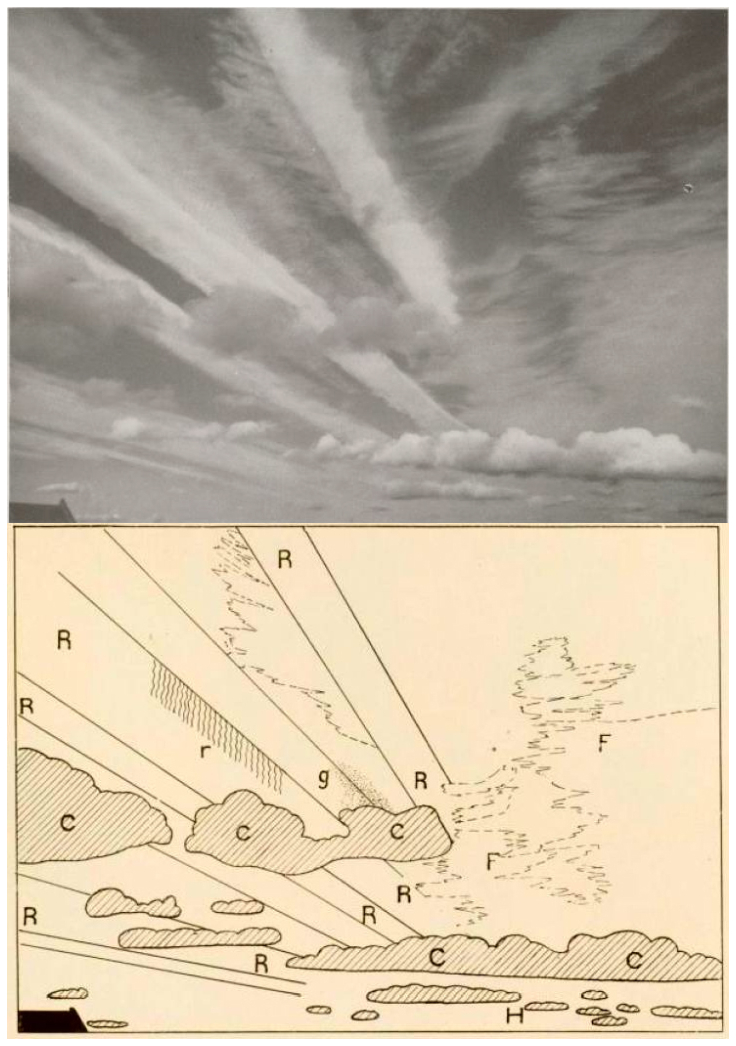
Figure 18Above: Example of cirrus with cumulus and explanation from the French Atlas (Durr and Wehrlé, 1926, pl. XLVII, reproduced in the International Atlas of Clouds (1939, Pl. 11)); below: Explanation of cirrus radiatus (“R” polar bands) and cumulus (“C”) from the.
The International Cloud Atlas of 1932 presented a typical cloud distributions in another idealised low-pressure systems to instruct observers adequately (Fig. 19) which was originally designed by Schereschewsky and Wehrlé (1923).
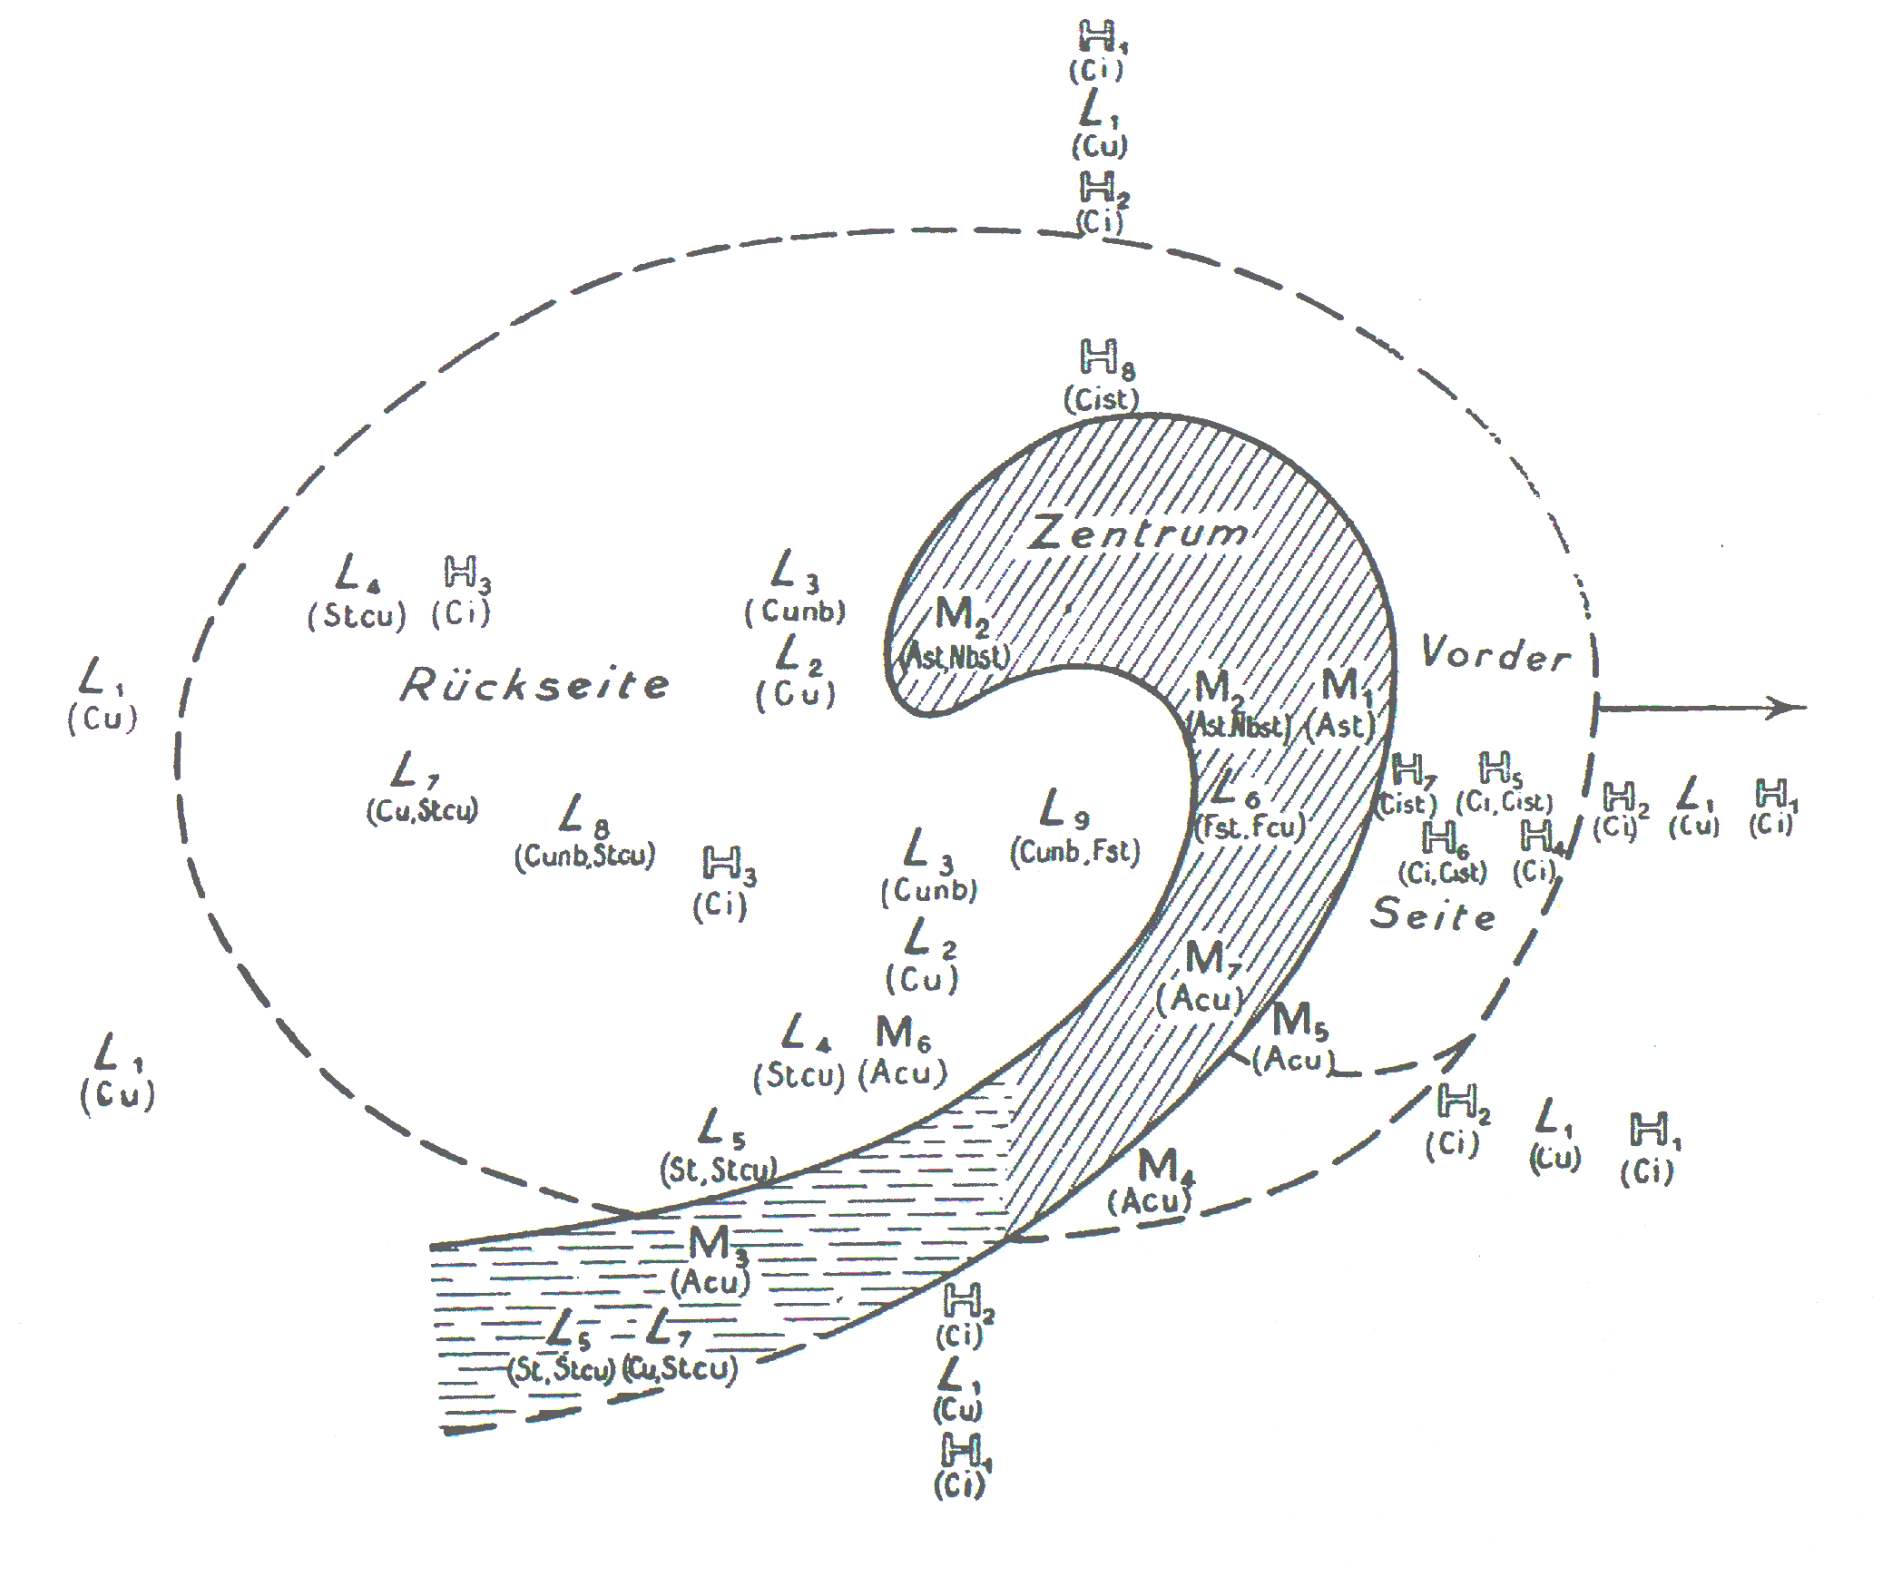
Figure 19In the International Commission for the Study of Clouds (1939), another representation of the typical cloud conditions in a low-pressure system was shown and reprinted in the edition of 1939 (p. 47), illustrating the progress to the first attempt by Abercromby shown in Fig. 9.
The 1924 atlas of USA was supplemented by a graph showing a statistical distribution of frequencies and altitude ranges for various cloud types. The still ongoing difficulty in the correct cloud classification is obvious from cirrus being observed under 5000 m (Fig. 20).
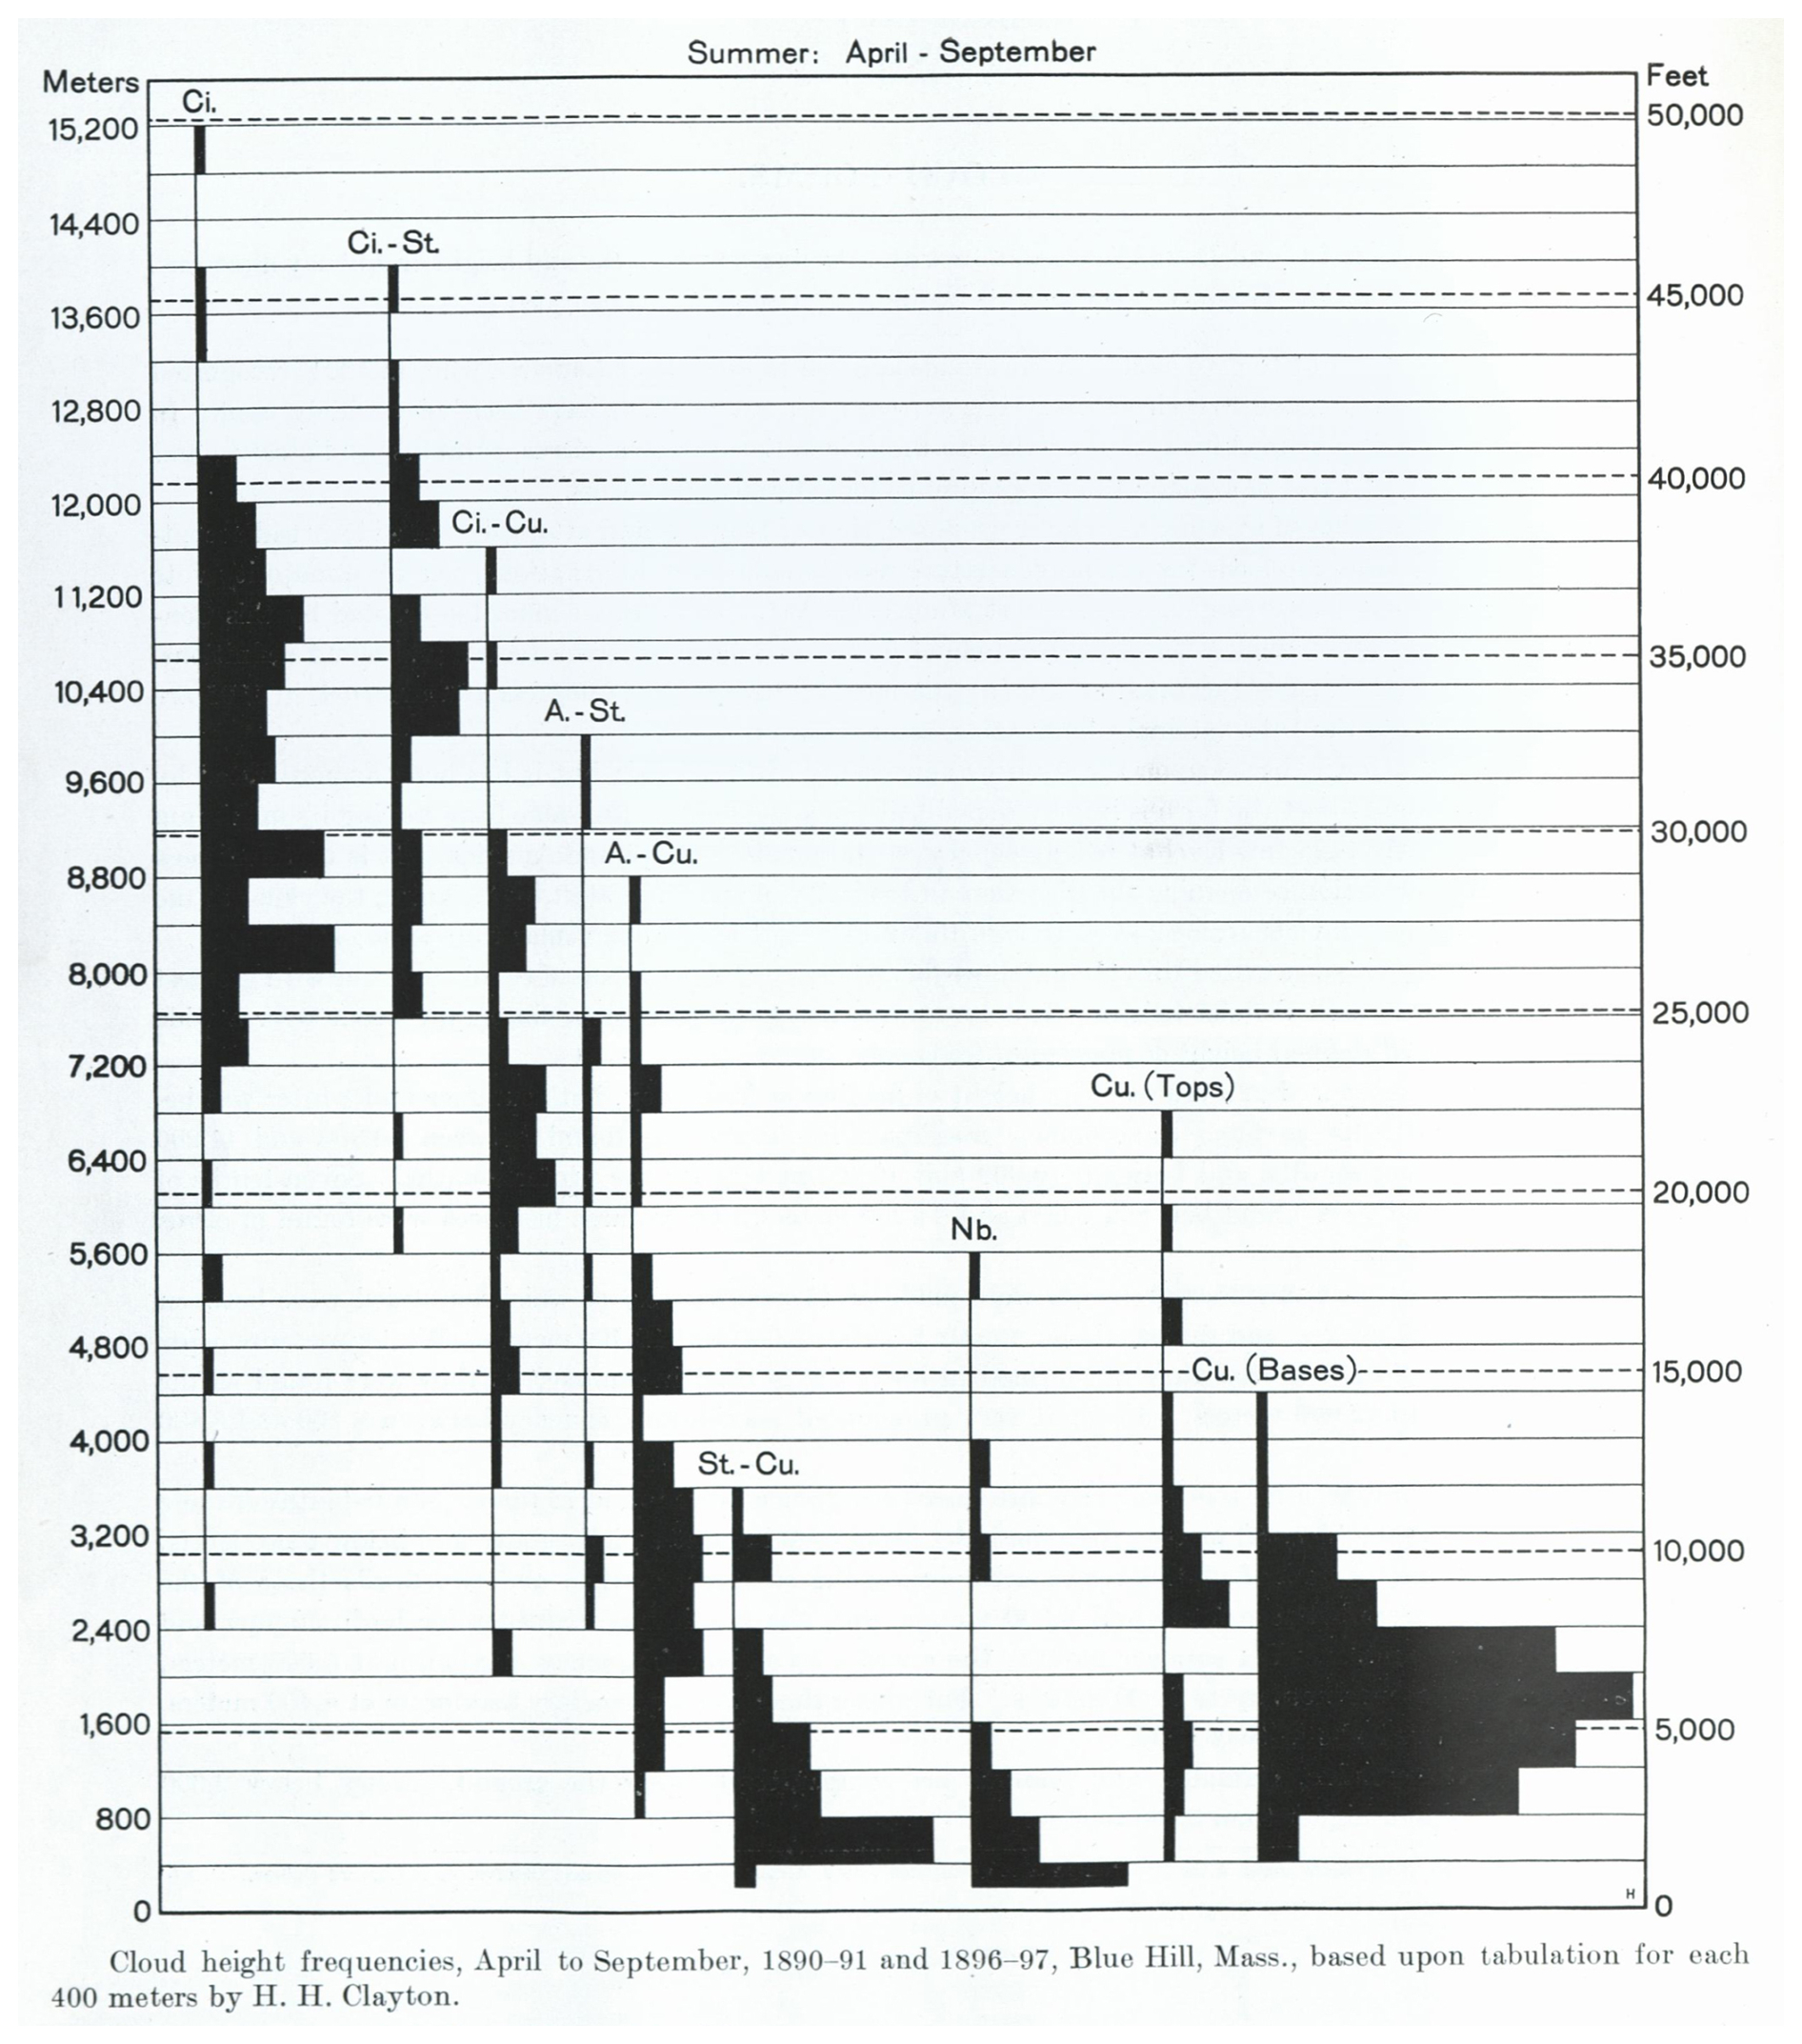
Figure 20Frequency distributions of various cloud types with height for April to September (US Depaartment of Agriculture, 1924). The persistent challenge of accurately classifying cloud genera is obvious by reports of cirrus occurring at altitudes below 5000 m.
Since cloud photographs and even the light printing technique remained unsatisfactory, Köppen and Alfred Wegener contacted Ernst Mylius (1846–1929) in 1917, requesting watercolours for a new cloud atlas and he provided a collection of 400 paintings.3 Pharmacist Mylius, an amateur sailor at the Baltic Sea, had asked numerous skippers and sea pilots about their experience of weather signs from clouds but received improper and contradicting answers. Thus, he started painting watercolours of clouds in relation to weather development (Mylius, 1906). He considered photography inadequate because camera opening angles did not match the human viewing field and he believed colour perception essential. His realistic cloud paintings were exhibited at the 1906 International World's Exhibition in Milan (Köppen, 1909, p. 353). However, due to World War I and the poor economic situation the atlas-project of Köppen and Wegener could not be realised.
In 1944 naval meteorologist Hans Frank revived Ernst Mylius's cloud paintings and compiled a 34-plate cloud atlas (Fig. 21) (Mylius, 1944). Mylius had an excellent colour perception and linked cloud colours to local vegetation and seasonal stages. Although the atlas has been said to aid German small combat units in World War II to judge the weather, that claim is doubtful because the plates had too brief meteorological explanations.
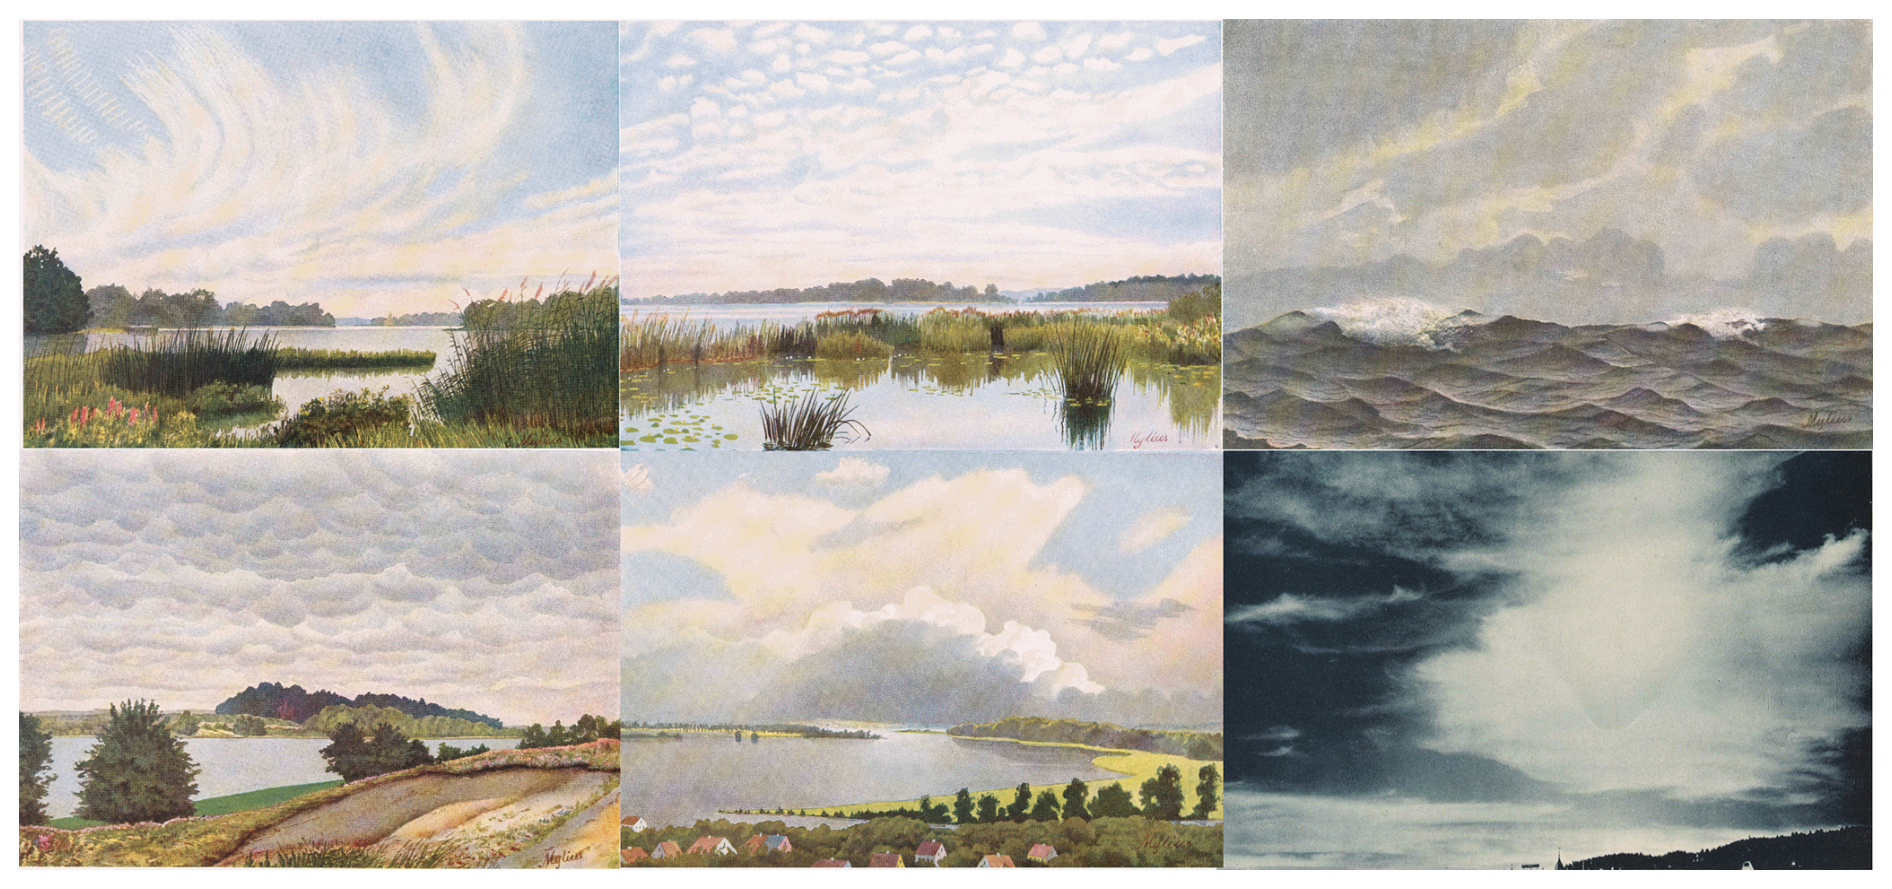
Figure 21Alfred Wegener and Wladimir Köppen intended to edit a new cloud atlas in 1917 and received 400 watercolours from Mylius for selection, some of which are presented in comparison with a contemporary black-and-white photograph by de Quervain (1908). This atlas could not be realised.
The International Cloud Atlas of 1956, edited in two volumes after the foundation of the World Meteorological Organization (WMO) in 1951, distinguishes 10 cloud genera and 15 species, listed in Table 3 (WMO, 1956). The genera are differentiated by altitude and by stratiform or convective types. In each altitude range, the types develop specific appearances, characterized primarily by convection within a limited altitude range. Stable or unstable air stratification is crucial for shaping the clouds. During overcast conditions, an overlaying slow uplift motion generates structureless forms. Radiative influences in stratiform clouds induce instability and create Bénard cells. If the atmosphere is unstable throughout the altitude range, thunderstorms (cumulonimbus clouds) will form.
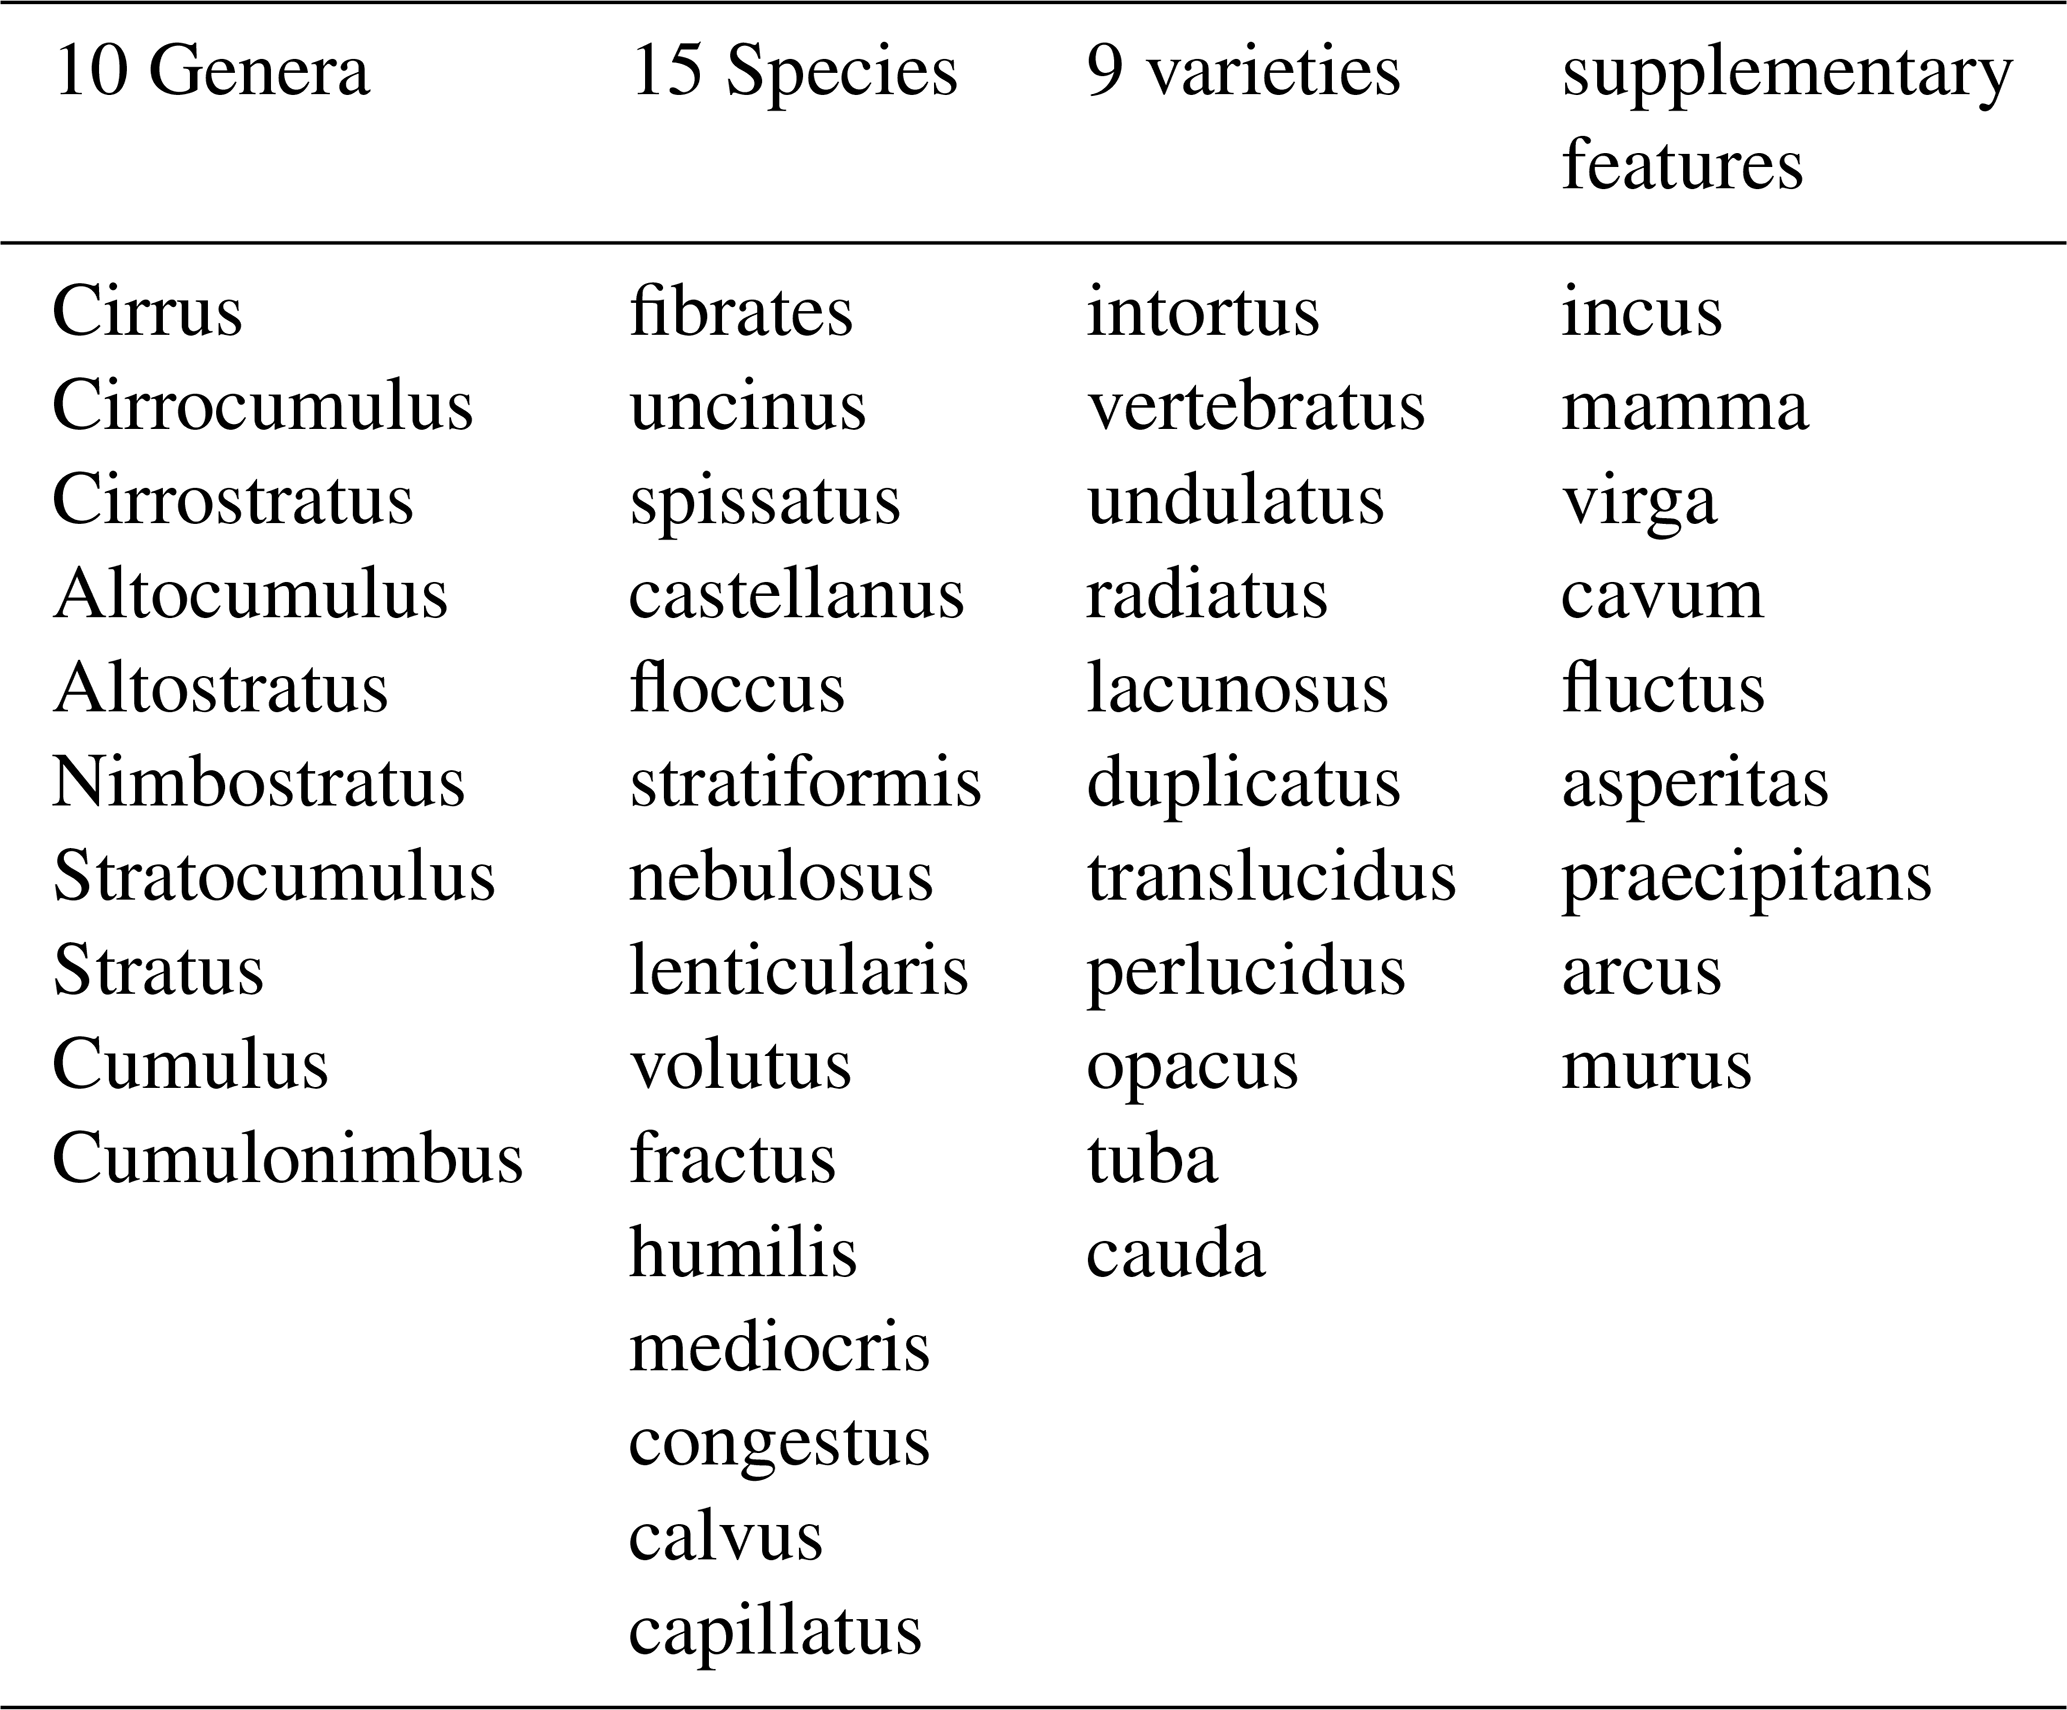
It should be noted that the mentioned species and varieties do not occur in combination with all genera. For example, cumulus capillatus forms when a rapidly growing cumulus triggers condensation in an overlying moist layer upon rapid rising. They are rare and short lived. De Quervain (1908) explained this form at first and showed an informative drawing (Fig. 22).
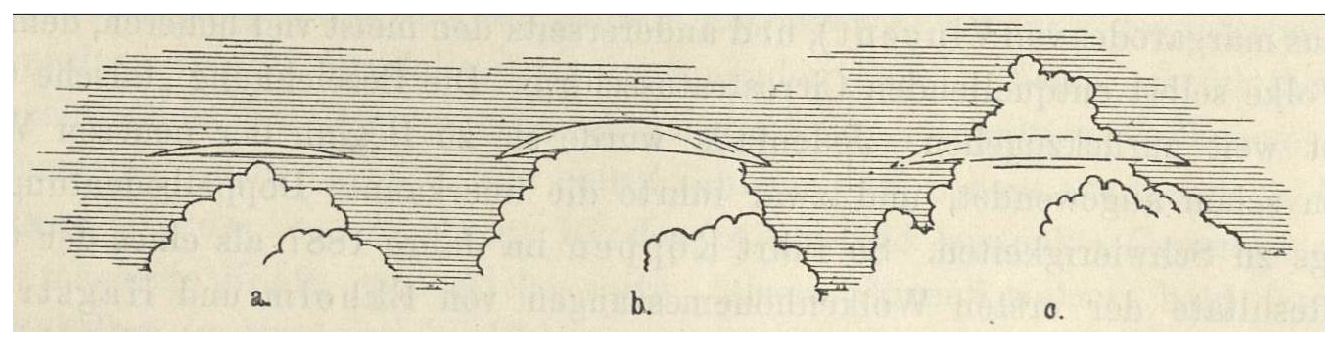
Figure 22Drawing of a cumulus capillatus at subsequent times by de Quervain (1908).
Under special conditions clouds form in the stratosphere or mesosphere, not necessarily as pure water clouds.
Stratospheric clouds form in winter over mountain-induced lee wave crests at about 21–27 km. These clouds contribute to ozone depletion. While Mohn referred to them as Mother-of-pearl clouds (Norwegian: Perlemorskyer; Mohn, 1893), they were renamed as Polar Stratospheric Clouds (Fig. 23a). Mohn overestimated their altitude (calculating over 100 km), being correctly determined to be 21–27 km (Fig. 24) by Störmer (1932, 1940).
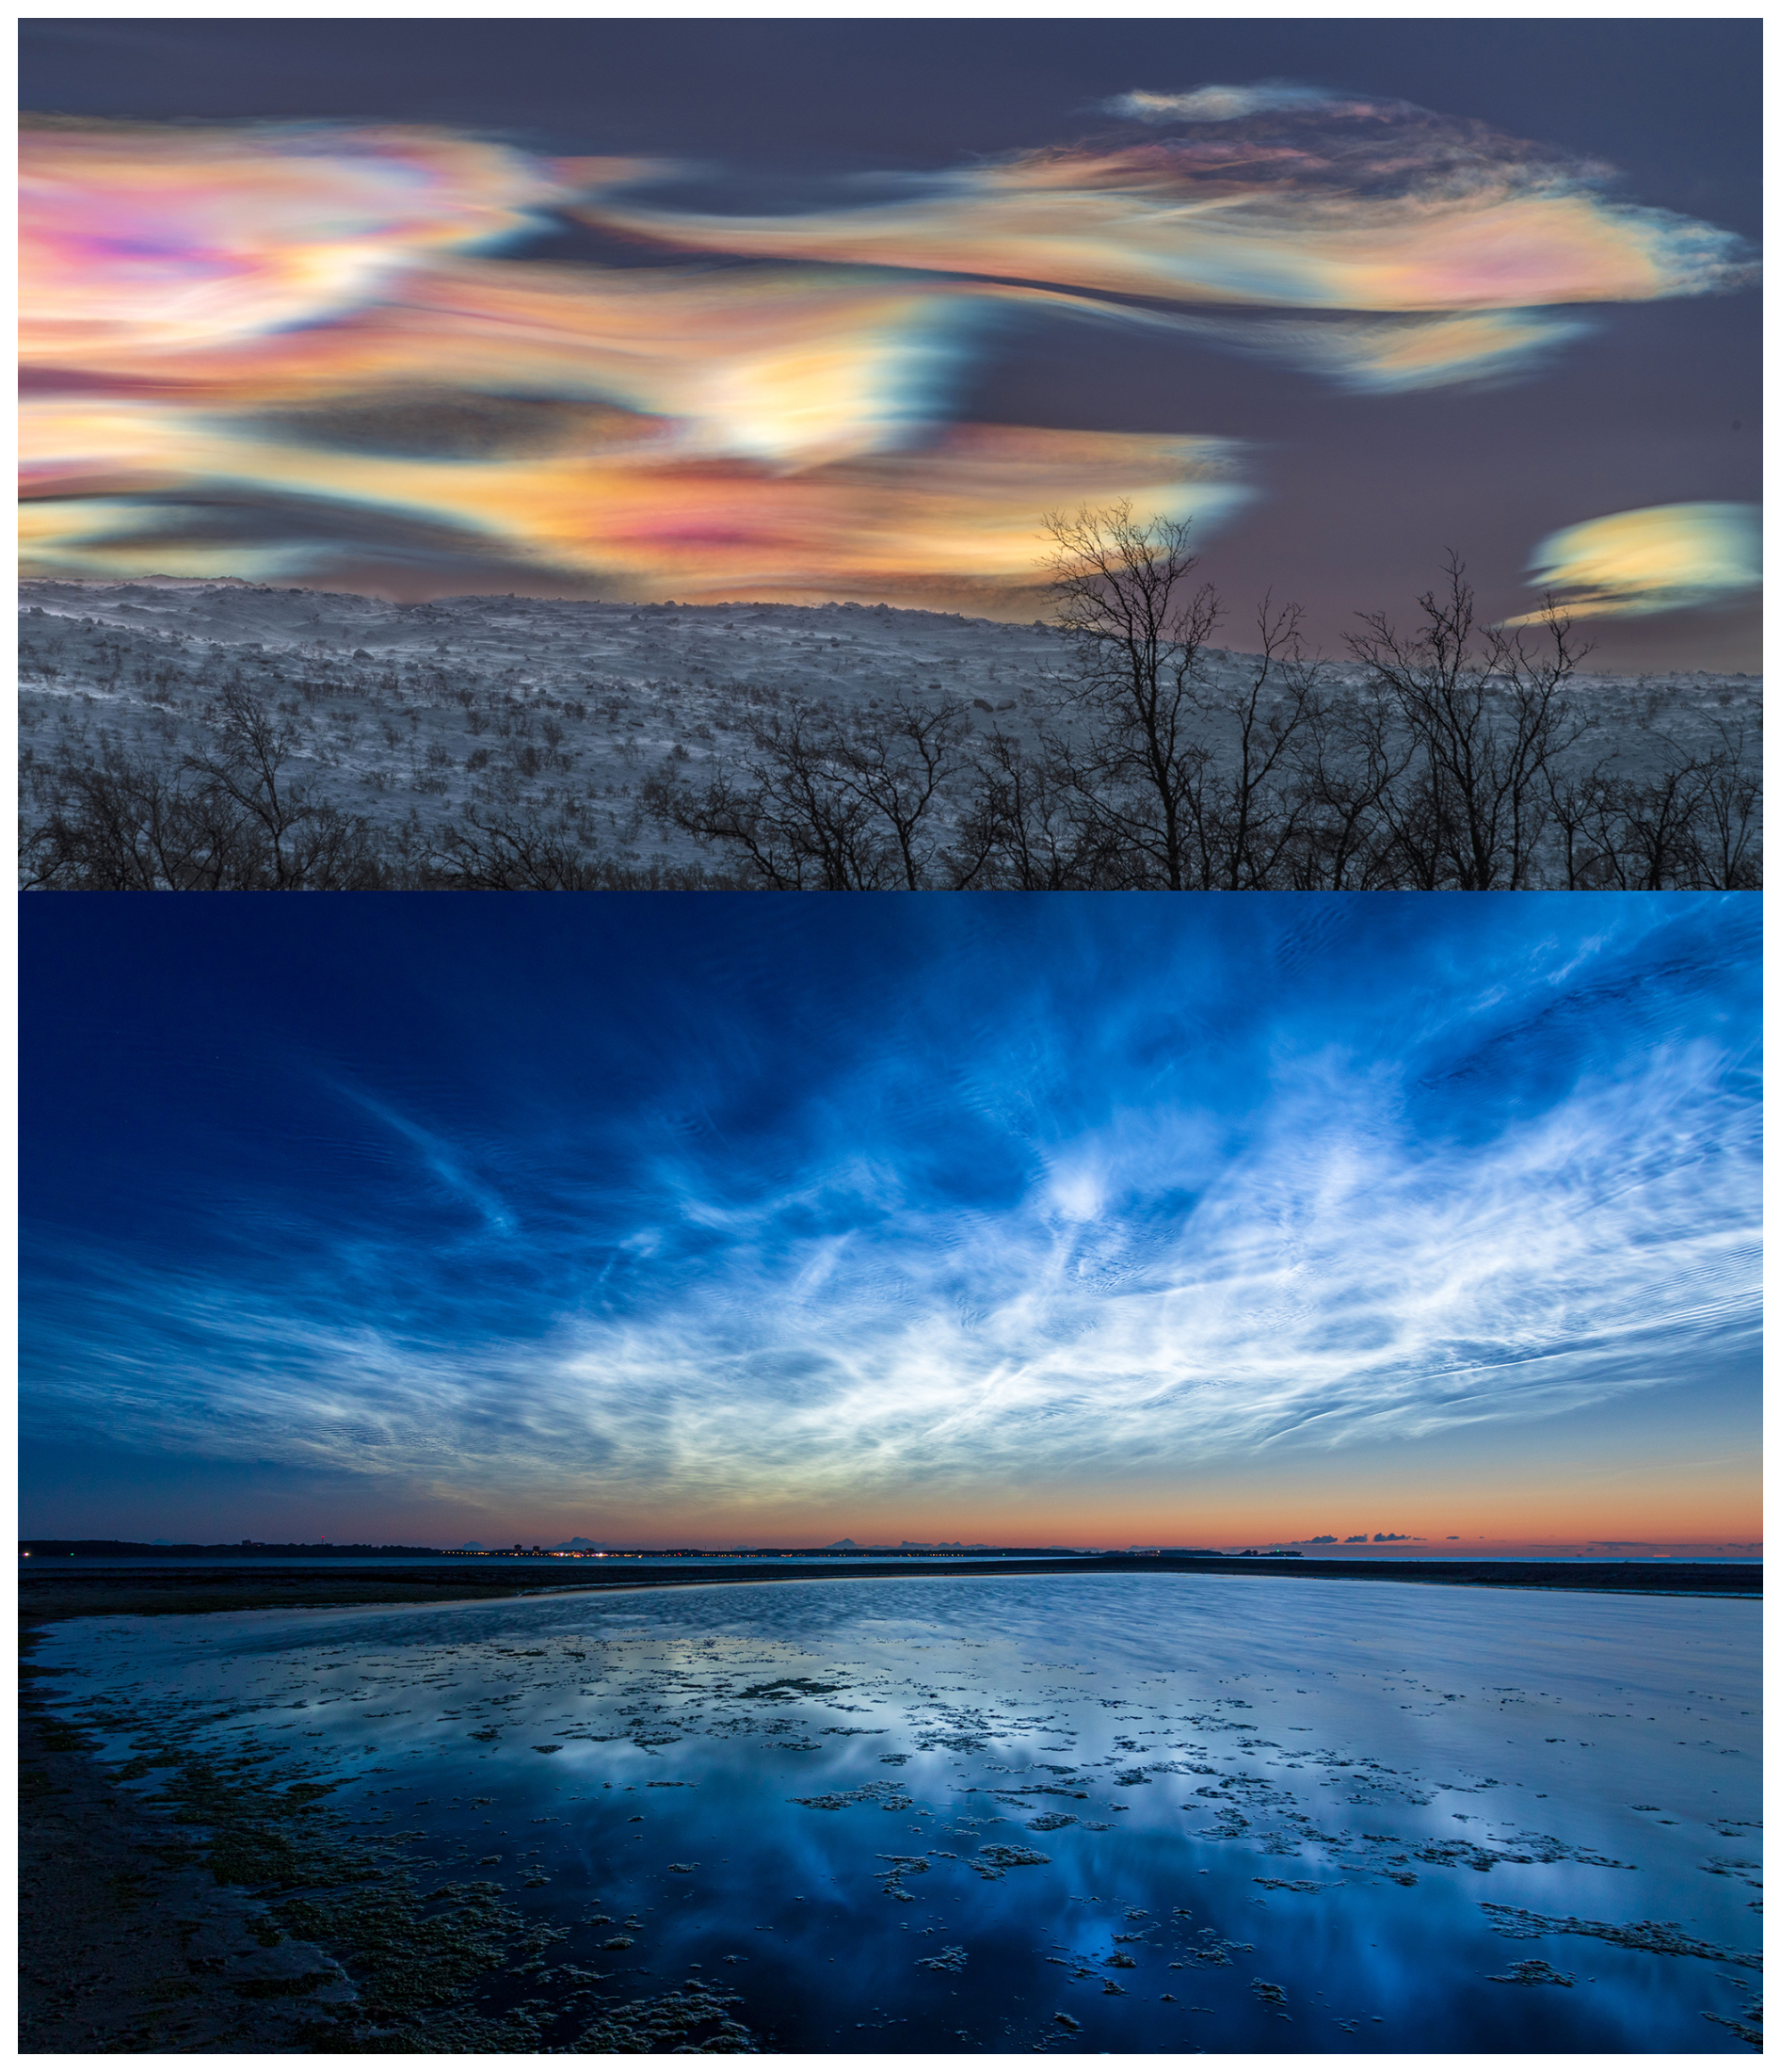
Figure 23above: Polar stratospheric cloud (Kiruna, 31 December 2019; credit: Thomas Kast); below: Noctilucent cloud (Laboe, 21 June 2019; credit: Mathias Suessen).
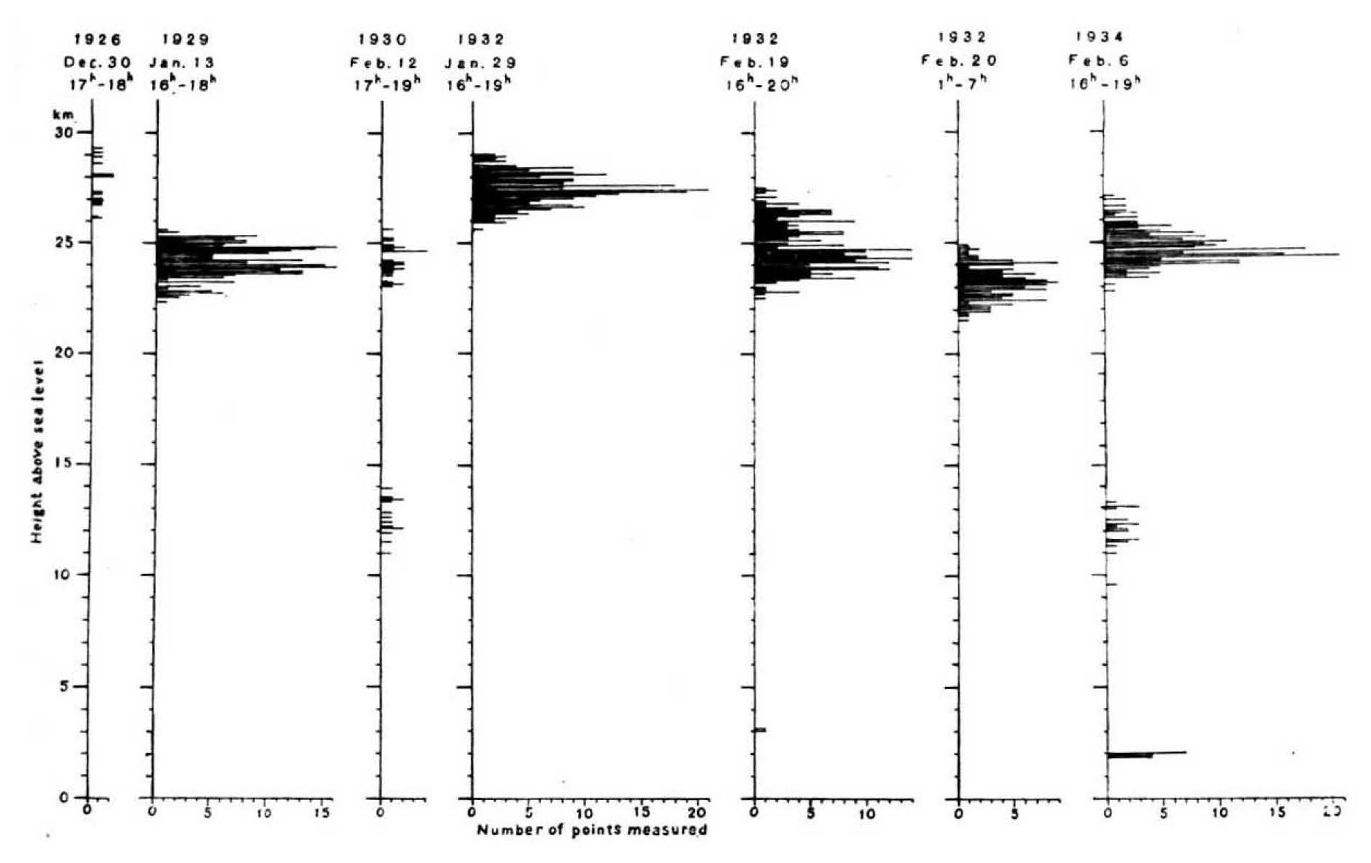
Figure 24Altitude determinations of Mother-of-pearl clouds in Norway by Störmer (1940).
Noctilucent clouds form at the mesopause in summer at roughly 80–89 km altitude where temperatures are lowest (Fig. 23b) and were described by Jesse in a preliminary note in 1885 and in detail in 1887, who later determined their height very accurately (Jesse, 1885, 1886, 1887). They are visible only at twilight or night when the sun light illuminates them standing about 18° below the horizon. After Jesse's first report, the open question was discussed in the Berlin Academy of Sciences whether it could be volcanic ash from the 1883 eruption of Krakatau. According to later estimates, the volcanic ash from this eruption rose to maximally 38 km (Assmann, 1887, p. 275). Dalin et al. (2012) would not exclude a volcanic contribution of volcanoes which inject huge amounts of water vapor above the tropopause. However, a more important trigger for the very low summer temperatures are gravity waves, for which no historical observations exit.
Intense fires can trigger cumulus pyrogenitus (flammagenitus) when strong fire-driven convection breaks through an inversion into moist, unstable air (Fig. 25), as reported by Eaton (1893), Ward (1897) and Ferguson and Brooks (1899). At the time moist instability was poorly understood; Ward cited Espy, who had shown that latent-heat release from condensation amplifies atmospheric instability.
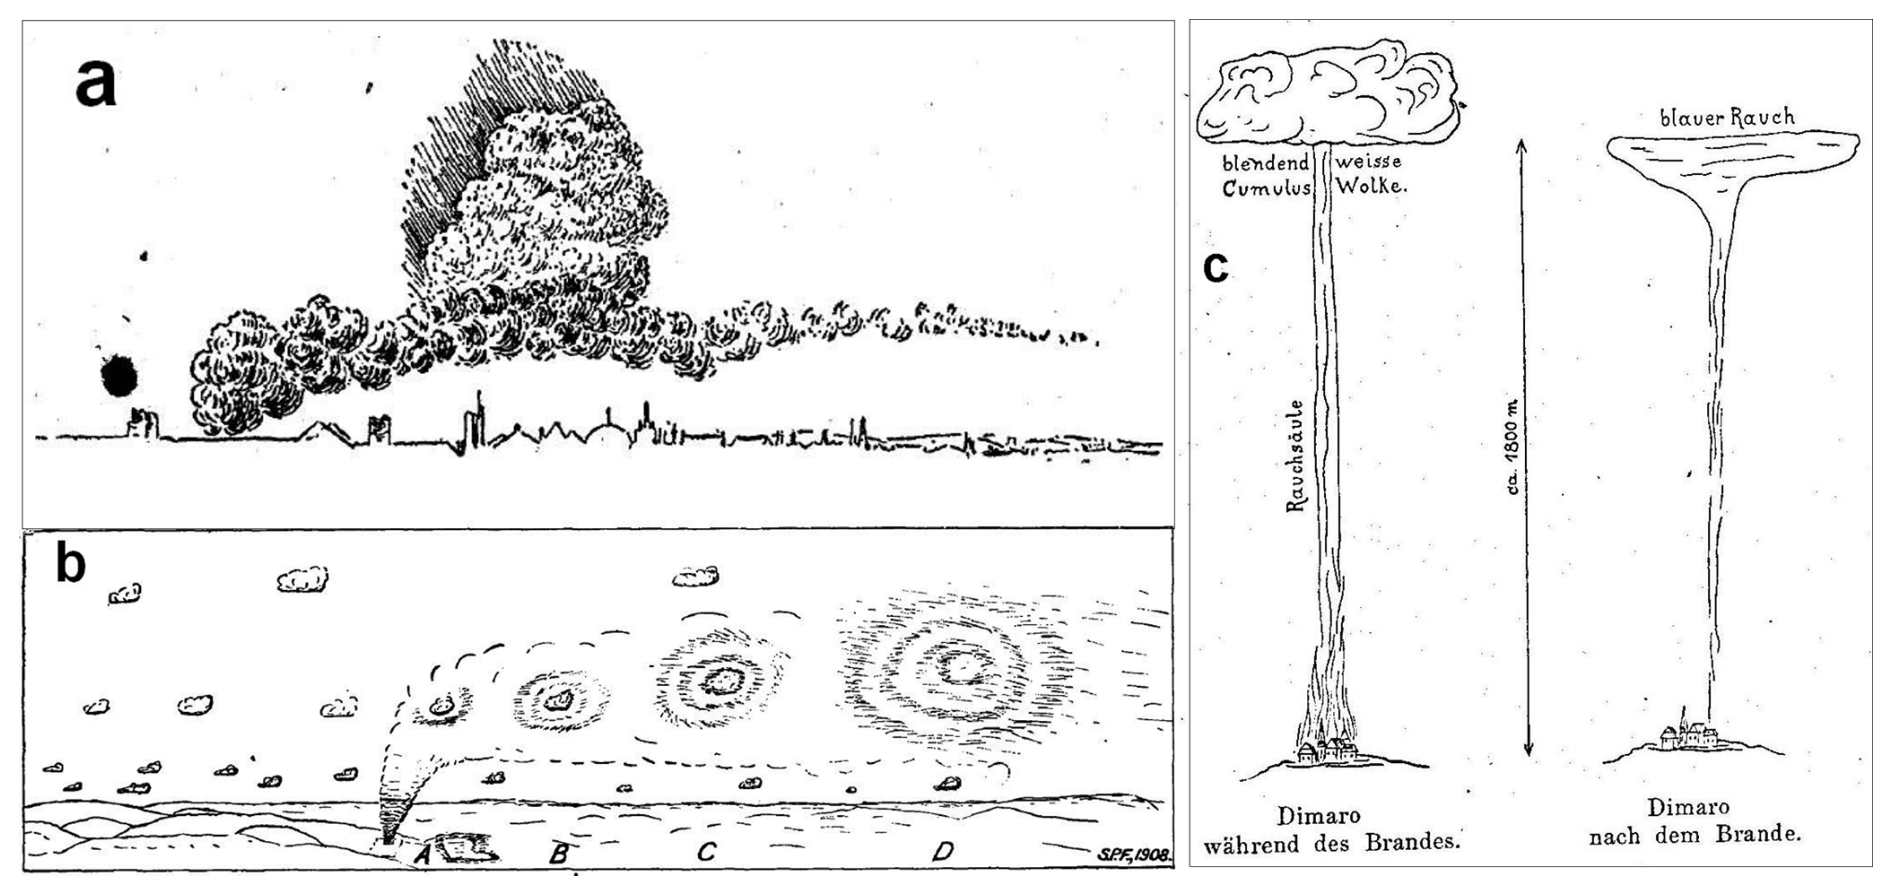
Figure 25Drawings of anthropogenic cumulus clouds, that formed over intensive fires: (a) after Ward (1897); (b) after Ferguson and Brooks (1899); and (c) after Ettenreich (1919).
Contrails have been often termed as cumulus homogenitus that only form once aircraft could flew high enough. A first observation from Tyrol in 1915 (Ettenreich, 1919) was withheld due to wartime censorship regulations. On June 1919, during a record high-altitude flight exceeding 8000 m, a contrail formation in Munich (Fig. 26) was published by Weickmann (1919).
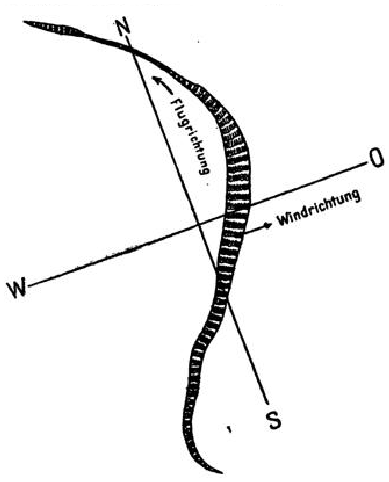
Figure 26First drawing of a contrail observed in Munich (Weickmann, 1919).
In the USA, Wells (1919) described the contrail of a German fighter aircraft in World War I in 1918, which became famous as the “Argonne battle cloud”. Alfred Wegener (1920) explained in his treatise “ Cirrus and Ice Supersaturation” that differing vapor pressures over water and ice cause supercooled droplets to evaporate and convert into pure ice clouds. In the British Met Office ephigram a dashed line labelled MINTRA (MINimum TRAil temperature) is plotted indicating the onset for contrail formation. This line was valid for old piston engines and had to been shifted for modern engines (Ferri, 1996).
During World War II contrails betrayed aircraft positions, so identifying meteorological conditions that favour their formation became vital for avoidance. They form when the water vapour emitted by engines leads to supersaturation. Ongoing studies like that of Schmidt (1941) attracted international attention, who explored mitigation measures such as hydrogen-poor fuels and mixing cooler, drier air into exhaust.
During World War II a cirrus halo observed in England (1944) could be linked to acoustic waves from cannon fire over the continent that produced rapidly moving bright and dark streaks in the ice cloud (Archenhold, 1944), a phenomenon foreshadowed by wave patterns was seen in clouds during World War I cannonades (Schmauß, 1940).
Satellite imagery revealed new overview on large-scale cloud distribution and structures being invisible from a single ground station. This was important for the oceanic regions. One example are Kármán vortices leeward of Cape Verde and another example shows details of the spiral frontal mixing around an Icelandic low (Fig. 27). These images show finer details of air-mass mixing. Therefore, the Bergen cyclone model proves to be a very useful yet incomplete representation of the real atmosphere.
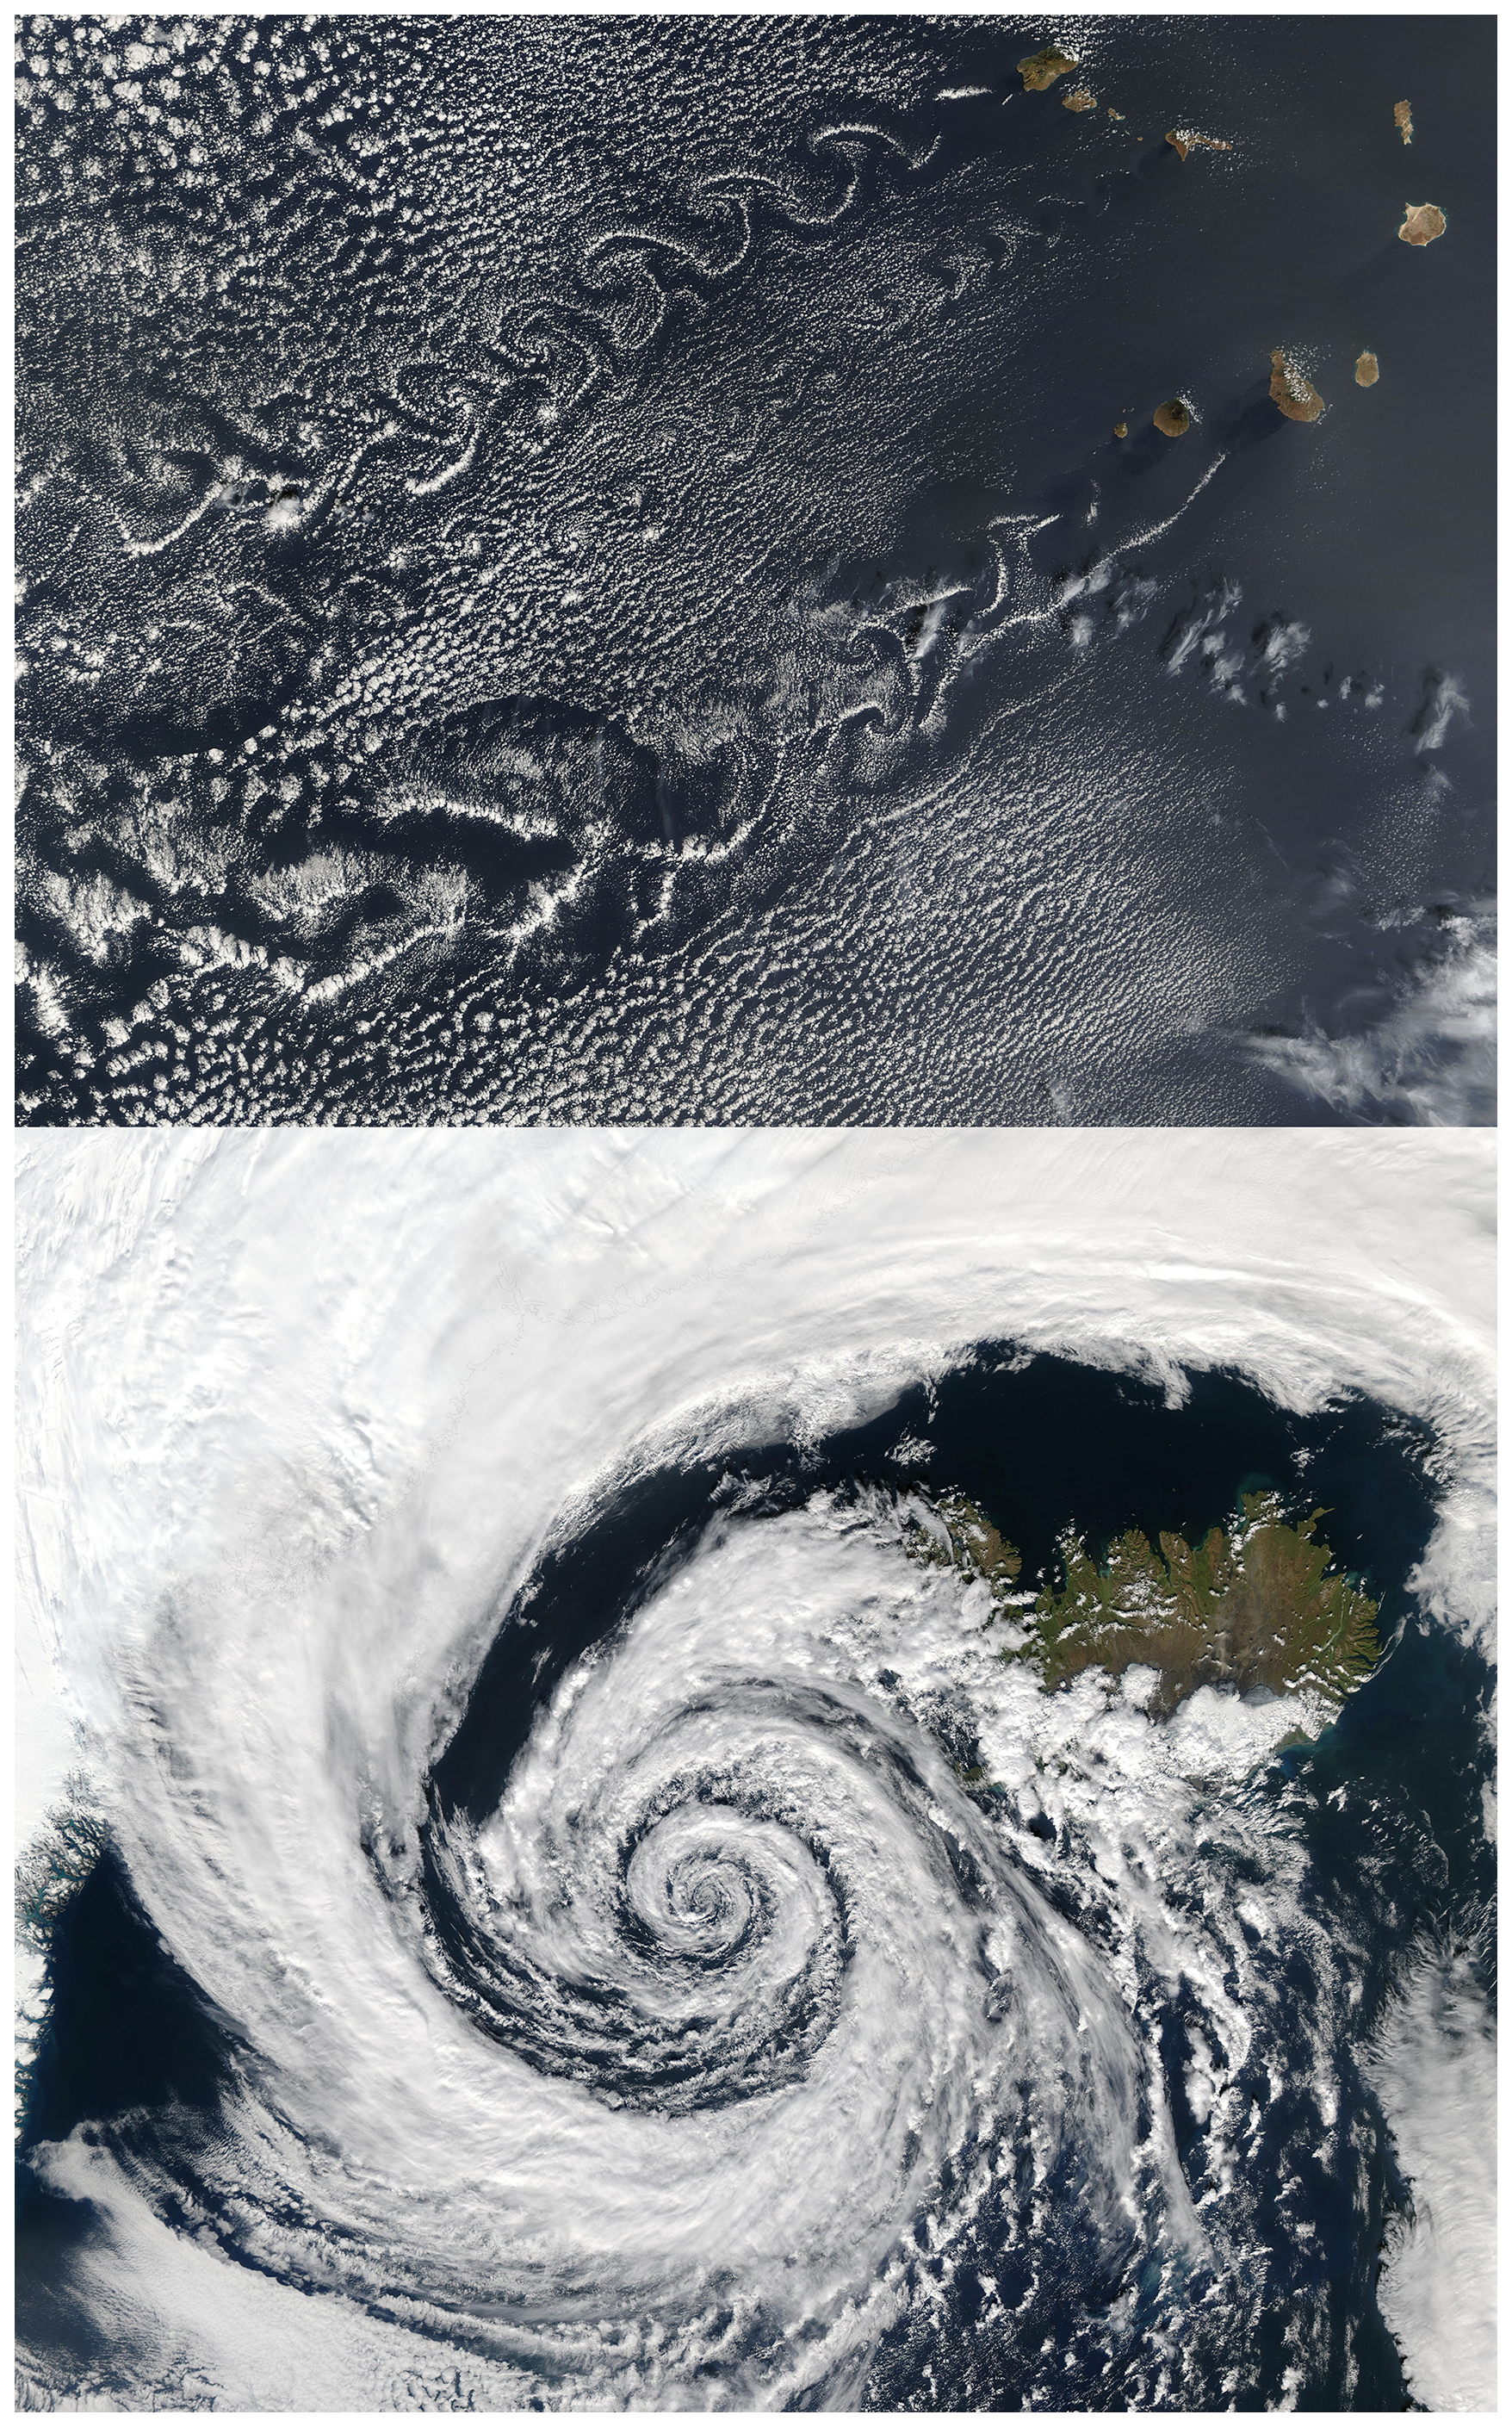
Figure 27above: Karman vortex street in the lee of the Canary Islands at 5 January 2020; right: low-pressure vortex near Iceland at 4 September 2003 (credit: earth observatory of NASA; downloaded 25 February 2025); below: The cloud spiral demonstrates that the Bergen cyclone model in Fig. 8 was an idealised approach.
Early cloud atlases favoured painted cloud images until photography improved; even then, pictures had poor quality and additional drawings were needed for explanation. Initial cloud classifications were later refined as theoretical work and better observations corrected proposals of too many forms. Knowledge of cloud types gives diagnostic information about atmospheric state and allows short-term weather prediction in certain situations. Meanwhile, automated meteorological systems have largely replaced routine visual cloud observation. Howard's Latin nomenclature laid the path for the accepted international terminology. Intense journal debates and international conferences established the current cloud nomenclature, accelerating progress in understanding clouds and eliminating persistent misinterpretations. Research of cloud formation processes is still ongoing. Many cloud names result from specific local conditions: e.g., “Moazagotl cloud” in the Riesengebirge (Germany); at mount Etna in Sicily, sometimes a lenticularis cloud of phantastic shape forms in the lee of volcano Etna termed “Contessa del Vento” (Ricco and Saija, 1895); “cloth of Table Mountain” (Africa) or “morning glory” (Australia) which is a sort of bore cloud formed at the collision line of sea breeze with stable inland air (Christie, 1992). Such forms were excluded from international nomenclature and cloud atlases; however, such local trivial names persist.
An adequate naming of cloud types required intensive observations and theoretical background. Recent studies (Bluestein, 2024) have confirmed basic cloud forms. The modern understanding of the atmosphere as a chaotic system has spurred first studies about cloud fractal scaling (Christensen and Driver, 2021), providing new impulses for interpreting cloud morphology.
Clouds have a pronounced impact on climate. Helmholtz in 1888, argued that heat conduction in the atmosphere is negligible in comparison to radiative or convective transport except at interfaces such as the earth's surface and at internal air-mass boundaries (Helmholtz, 1888, p. 331). Stüve had realised that the potential temperature of high air masses remains stable for weeks while lower layers show a high variability due to cloud formation (Stüve, 1922). Current studies corroborate that clouds significantly contribute to global heat transport by releasing latent heat. Cumulus clouds of different depths release latent heat at their altitudes but individual cells have a short lifespan. The ascent processes in extratropical cyclones (warm conveyor belts) contribute most significantly to global energy transport toward the poles through cloud formation (Binder and Madonna, 2020).
Stratus clouds, with their broad coverage, are long-lived and reduce the earth's longwave outgoing radiation. These insights emerged from extensive, late-19th-century international studies of cloud types showing that typical cloud forms recur globally when formation conditions are met. Full understanding of cloud forms requires the three-dimensional study of the atmosphere i.e. temperature profile, stability, vertical moisture distribution, and large-scale ascent or subsidence.
At the end of this three-century-tour of scientific enquiry about Cloud Classification it is interesting to note that space agencies started to re-address this old topic with planned multiple-instrument observations from satellites. The recently selected WIVERN explorer mission of the European Space Agency (https://wivern.polito.it, last access: 1 November 2025) can be regarded as an illustrative example.
No data sets were used in this article. The literature which has been evaluated is cited in the comprehensive list of references.
The author has declared that there are no competing interests.
Publisher's note: Copernicus Publications remains neutral with regard to jurisdictional claims made in the text, published maps, institutional affiliations, or any other geographical representation in this paper. The authors bear the ultimate responsibility for providing appropriate place names. Views expressed in the text are those of the authors and do not necessarily reflect the views of the publisher.
The author would like to thank the reviewers for their valuable suggestions and corrections.
This paper was edited by Hans Volkert and reviewed by Stephen Burt and Andreas Dörnbrack.
Abercromby, R.: Principles of forecasting by means of weather charts, London, 1885.
Abercromby, R.: Suggestions for an international nomenclature of clouds, Q. J. Roy. Meteor. Soc., XIII, 154–166, 1887a.
Abercromby, R.: On the identity of cloud forms all over the world, Q. J. Roy. Meteor. Soc., 13, 140–146, 1887b.
Anonymus: Wolken im Luftmeer, Lichtbilder aufgenommen von deutschen Fliegern während des Krieges, s. l., 1917.
Archenhold, G. H.: A solar halo phenomenon, Nature, 3898, 433, 1944.
Assmann, R.: Mikroskopische Beobachtungen der Wolkenelemente auf dem Brocken, Meteorol. Z., 2, 41–47, 1885.
Assmann, R.: Referat über Kießling, J. Untersuchungen über Dämmerungserscheinungen zur Erklärung der nach dem Krakatau-Ausbruch beobachteten atmosphärisch-optischen Störung, Das Wetter, 7, 274–276, 1887.
Assmann, R.: Ergebnisse des k. Aeronautischen Observatoriums Lindenberg im Jahre 1905, Berlin, I-XXII, 1906.
Assmann, R., Berson, A., von Bezold, W., Börnstein, R., and Süring, R. (Eds.): Wissenschaftliche Luftfahrten, Braunschweig, 1900.
Bénard, H.: Les tourbillons cellulaires dans une nappe liquide, Revue Générale des Sciences, 11, 1261–1271, 1309–1328, 1900.
Berns, J. J.: Wolkenspektakel, in: Theatrale Himmelsprodigien auf frühneuzeitlichen Flugblättern, edited by: Berns, J. J. and Rahn, Th, Projektierte Himmel, Wiesbaden, 181–208, 2019.
Binder, H. and Madonna, E.: Warm conveyor belts, Promet, 103, 59–66, 2020.
Bjerknes, J.: On the structure of moving cyclones, Mon. Weather Rev., 47, 95–99, 1919.
Bluestein, H. B.: The architecture of clouds, Oxford University Press, Oxford, 2024.
Börngen, M. and Foken, T.: 150 Years: The Leipzig Meteorological Conference, 1872, a milestone in international meteorological cooperation, Meteorol. Z., 31, 415–427, 2022.
Börnstein, R.: Leitfaden der Wetterkunde, Vieweg, Braunschweig, 1901.
Brooks, C. F.: Clouds in aerology and forecasting, B. Am. Meteor. Soc., 22, 335–345, https://doi.org/10.1175/1520-0477-22.9.335, 1941.
Cannegieter, H. G.: The history of the International Meteorological Organization 1872–195, Annalen der Meteorologie, N. F. Nr. 1, Selbstverlag des Deutschen Wetterdienstes, Offenbach, 1963.
Christensen, H. M. and Driver, O. G. A.: The fractal nature of clouds in global storm-resolving models, Geophys. Res. Lett., 48, https://doi.org/10.1029/2021GL095746, 2021.
Christie, D. R.: The morning glory of the Gulf of Carpentaria: a paradigm for non-linear waves in the lower atmosphere, Aust. Meteorol. Mag., 41, 21–60, 1992.
Clarke, G. A.: Clouds, A descriptive illustrated guide book to the observation and classification of clouds, Constable, London, 1920.
Clayden, A. W.: Cloud studies, Murray, London, 1905.
Clayton, H. H.: Discussion of the cloud observation, Annals of the Astronomical Observatory of Havard College, XXX, Part IV, 1896.
Dalin, P., Pertsev, N., and Romejko, V.: Notes on historical aspects on the earliest known observations of noctilucent clouds, Hist. Geo Space Sci., 3, 87–97, 2012.
Dannemann, F.: Otto von Guericke's neue Magdeburgische Versuche über den leeren Raum (1672), Oswalds Klassiker der exakten Wissenschaften, 59, Leipzig, 1889.
de Quervain, A.: Zur Kenntnis der Wolkenformen, Meteorol. Z., 39, 157–158, 1904.
de Quervain, A.: Beiträge. zur Wolkenkunde, Meteorol. Z., 25, 433–453, 1908.
de Lamarck, J.-B.: Sur la forme des nuages, Annuaire Météorologique pour l'An 1801–1802, 149–164, 1802.
de Touchimbert, M.: Les courants Aériens, Compte Rendue, 500–505, 1879.
Deluc, J. A.: Idées sur la météorologie, Spilsbury, London, 1786.
Dorno, C.: Zur Frage der Polarbanden, Die Himmelswelt 35, 11–13, 1925.
Dove, H. W.: Meteorologische Untersuchungen, Sander, Berlin, 1837.
Dubois, P.: Das Observatorium Lindenberg in seinen ersten 50 Jahren 1905–1955, Geschichte der Meteorologie in Deutschland, Offenbach, Bd. 1, 1993.
Durr, L. and Wehrlé, P.: Atlas des Nuages. Paris, 1926.
Eaton, A. A.: Cloud formation, Science, 21, 346–347, 1893.
Erk, F.: Über die Einwirkung von Flußläufen auf eine darüber befindliche Wolkendecke, Meteorol. Z., 33, 216–225, 1898.
Espy, J. P.: The philosophy of storms, Boston, https://doi.org/10.5479/sil.1109113.39088016470767, 1841.
Ettenreich, R.: Wolkenbildung über einer Feuersbrunst und an Flugzeugabgasen, Meteorol. Z., 36, 355–356, 1919.
Ferguson, S. P. and Brooks, C. F.: Formation of a cumulus cloud over a fire, Science, 10, 86, 1899.
Ferri, P. D.: The formation and forecasting of condensation trails behind modern aircraft, Meteorol. Appl., 3, 301–306, 1996.
Fontseré, E.: Atlas Elemental de Núvols, Gili, Barcelona, 1925.
Forster, T.: Researches about atmospheric phaenomena, London, 1813.
Föyn, N. J.: Wolken-Beobachtungen, Grøndahl, Christiania, 1900.
Fraunhofer, J.: Theorie des Mondhofs und der Haloerscheinungen als Beugungs- und Brechungsphänomene, Akademie der Wissenschaften München, 1825.
Gilbert, L. W.: Über die Modifikationen der Wolken von Lukas Howard, Ann. Phys., 21, 137–159, 1805.
Grossmann, L. A.: Zur Beobachtung der Wolken, after Clement Ley, Cloudland, London (1894), Annalen der Hydrographie und Maritimen Meteorologie, 23, 493–505, 1894.
Grünpeck, J.: Ein newe außlegung Der seltzamen wundertzaichen vnd wunderpürden, so ein zeyther im reich, als vorpoten des Almechtige[n] gottes, auffmonende auffrüstig zesein wider die feindt christi vnd des heyligen reichs, erschinen sein: an all Kurfürsten vnnd Fürsten so auff dem reichs tag zu Costnitz versamlt sein gewesen, Nürnberg, 1515.
Guericke, O. V.: Experimenta Nova (ut vocantur) Magdeburgica de Vacuo Spatio, Janssonium & Waesberge, Amsterdam, 1672.
Halley, E.: An account of the circulation of the sea, and of the cause of the springs, Phil. Transactions, III, 468–473, 1690.
Hamanaka, H.: Erkenntnis und Bild – Wissenschaftsgeschichte der Lichtenbergischen Figuren um 1800, Göttingen, https://doi.org/10.1002/bewi.201601781, 2015.
Heinecke, B., Knapp, W., Rubini, P., and Streitenberger, P.: Leibniz und Guericke im Diskurs. Die Exzerpte aus den Experimenta Nova und der Briefwechsel, De Gruyter, Berlin, Boston, 2019.
Hellmann, G.: Das Magnetisch-Meteorologische Observatorium bei Potsdam, Berlin, 1912.
Helmholtz, H.: Über atmosphärische Bewegungen, Sitzungsberichte der K. Preuss. Akad. Wiss., 647–663, 1888.
Hertz, H. Graphische Methoden zur Bestimmung der adiabatischen Zustandsänderungen feuchter Luft, Meteorol. Z., 1, 421–431, 1884.
Hildebrandsson, H. H.: Atlas des mouvements supérieurs de l'atmosphère, Stockholm, 1877.
Hildebrandsson, H. H.: Wolkenformen und Wolkenbilder, Meteorol. Z., 24, 441–447, 1889.
Hildebrandsson, H. H.: Internationaler Wolken-Atlas, ed. on behalf of the International Cloud Committee, Gauthier, Paris, 1896.
Hildebrandsson, H. H., Köppen, W., and Neumayer, G.: Atlas des Nuages – Wolkenatlas, Seitz, Hamburg, 1890.
Hooke, R.: A method for making a history of the weather, in: The history of the Royal Society of London, edited by: Sprat, T., for the improving of natural knowledge, Martyn, London, 173–179, 1667.
Howard, L.: On the Modifications of Clouds, Philos. Mag., 26, 344–357, 1803.
Hube, J. M.: Über Ausdünstungen und ihre Wirkungen in der Atmosphäre, Göschen, Leipzig, 1790.
International Commission for the Study of Clouds (Ed.): International Atlas of Clouds and of States of the Sky. Office national météorologique, 2nd edn., 1939.
Jelinek, K.: Anleitung zur Anstellung meteorologischer Beobachtungen und Sammlung von Hilfstafeln, Wien, 1876.
Jesse, O.: Auffallende Abenderscheinung am Himmel, Meteorol. Z., 2, 311–312, 1885.
Jesse, O.: Eine auffallende Abenderscheinung am Himmel im Juni und Juli 1885, Meteorol. Z., 3, 8–18; 64–71, 1886.
Jesse, O.: Die Beobachtung der leuchtenden Nachtwolken, Meteorol. Z., 4, 179–181, 1887.
Kämtz, F. L.: Lehrbuch der Meteorologie, Gebauer, Halle, 3 Vols., 1831–1836.
Kober, J.: Ueber die angeblichen Dunstbläschen in der Atmosphäre, Ann. Phys. Chem., 141, 395–427, 1871.
Koppe, C.: Photogrammetrie und internationale Wolkenmessung, Vieweg, Braunschweig, 1896.
Köppen, W.: Einiges über die Wolkenformen, Meteorol. Z., 22, 203–214; 252–261, 1887.
Köppen, W.: Zwei merkwürdige Nachtgewitter im Sommer 1890, Annalen der Hydrographie und maritimen Meteorologie 19, 84–90, 1891.
Köppen, W.: Volkswetterkunde by E. Mylius, Mitteilungen der Dutschen Seefischerei, 352–353, XXV, 1909.
Koterba, A. and Huu, A. N.: Accuracy of cirrus detection by surface-based human observers, J. Climate, 25, 3227–3241, https://doi.org/10.1175/JCLI-D-21-0430.1, 2020.
Kratzenstein, C. G.: Théorie d'élevation des vapeurs et des exhalations, Bordeaux, 1743.
Kratzenstein, C. G.: Abhandlung von dem Aufsteigen der Dünste und Dämpfe welche von der Academie zu Bourdeaux den Preiss erhalten, Hemmerde, Halle, 1744.
Kuhn, C.: Über di Constitution der Wolken, Z. österr. Ges. für Meteorologie, 1, 346–348, 1866.
Lampadius, W. A.: Systematischer Grundriß der Atmosphärologie, Gerlach, Freiberg, 1806.
Leibniz, G. F.: De elevatione vaporum, Miscellanea Berolinensia ad incrementum scientiarum 1, 123–128, 1710.
Ley, C. W.: Clouds and weather signs, in: Modern Meteorology, edited by: Meteorological Society, London, 102–136, 1879.
Ley, C. W.: Über die Struktur des ”Cirro-filum”, oder der fadenförmigen Eiswolke, Meteorol. Z., 1, 261–271, 1884.
Ley, C. W.: Cloudland, A study on the structure and characters of clouds, Stanford, London, 1894.
Ludewig, P.: Die Messung vertikaler Luftströmungen, Resultate von wissenschaftlichen Freiballonfahrten, Hirzel, Leipzig, 1911.
MacCracken, M. C. and Volkert, H.: IAMAS: a century of international cooperation in atmospheric sciences, Hist. Geo Space. Sci., 10, 119–136, https://doi.org/10.5194/hgss-10-119-2019, 2019.
Mason, J.: The physics of clouds, Oxford, 1957.
McDonald, J. E.: James Espy and the beginnings of cloud thermodynamics, B. Am. Meteorol. Soc., 44, 634–643, https://doi.org/10.1175/1520-0477-44.10.634, 1963.
Meister, A. F. L.: Beobachtungen merkwürdiger Gestalten der Wolken, Göttingisches Magazin der Wissenschaften, 1, 38–68, 1780.
Mohn, H.: Irisierende Wolken, Meteorol. Z., 10, 81–97, 1893.
Mohorovičić, A.: Wolkenmessung, Meteorol. Z., 27, 326–327, 1888.
Mohorovičić, A.: Interessante Wolkenbildung über der Bucht von Buccari, Meteorol. Z., 24, 56–57, 1889.
Murphy, J. J.: Clouds, Nature 10, 20, 1870.
Mylius, E.: Aquarellmalerei im Dienste meteorologischer Beobachtungen, Das Wetter, 23, 255–261, 1906.
Mylius, E.: Wolkenbilder: nach Aquarellen von E. Mylius, edited by: Frank, H., Graph, Kunstanstalt, Böhm, Leipa, 1944.
Neuber, A. W.: Observationes meteorologicae a Cal. Juniis 1824 ad Cal. Junias 1825, Apenroae in Ducatu Slesvicensi factae Observationes meteorologicae a Cal. Juniis 1824 ad Cal. Junias 1825, Hafnia, 1829.
Neuhoff, O.: Adiabatische Zustandsänderungen feuchter Luft, Abhandl. des k. Preuss. Met. Inst., 1.6, Berlin, 1900.
Osthoff, H.: Der Mammato-Cumulus, Meteorol. Z., 23, 401–408, 1906.
Parthey, G.: Nachschrift von Alexander von Humboldt: Vorlesungen über physikalische Geographie. Novmbr. 1827 bis April 1828. in der Berliner Universität, Deutsches Textarchiv, Marbach, 1828.
Poey, A.: Sur deux nouveaux types de nuages observés a la Havane et Dénommés Pallium (Pallio-cirrus et Pallio-cumulus) et Fracto-cumulus, Annuaire de la Société Météorologique de France XI, 53–56, 1863.
Poey, A.: Neue Classification der Wolken, Z. d. öster. Ges. Meteorologie, IX, 177–183, 1874.
Poulter, R. M.: Cloud forecast with tephigram (1938), Q. J. Roy. Meteorol. Soc., 64, 277–292, 1938.
Prestel, A. M. F.: Die Polarbanden als Aeroklinoskop, Z. öster. Ges. für Meteorologie, 9, 69–372, 1874.
Quante, M.: Turbulenz in Cirruswolken mittlerer Breiten, Phd-thesis, Hamburg, 2006.
Rayleigh, O. M.: On convection currents in a horizontal layer of fluid, when the higher temperature is on the underside, The London, Edinburgh, and Dublin Philosophical Magazine and Journal of Science, 32, 529–546, 1916.
Ricco, A. and Saija, R.: Saggio di meteorologia dell' Etna, Annali dell' Ufficio meteorologico e geodinamico Italiano, XVII, 39–108, 1895.
Riggenbach, A.: On a method of photographing cirrus clouds, Q. J. Roy. Meteor. Soc. XV, 16, 1889.
Schereschewsky, P. and Wehrlé, P.: Les systemes nuageux, Paris, 2 Vols., 1923.
Schleich, A.: Bemerkungen zum Wolkenquadrant, Meteorol. Z., 67, 278–279, 1932.
Schmauß, A.: Explosionswellen auf Wolkenoberflächen, Meteorol. Z., 57, 80, 1940.
Schmidt, E.: Die Entstehung von Eisnebel aus den Auspuffgasen von Flugmotoren, Vortrag 15.3.1940, Schriften der Dt. Akademie der Luftfahrtforschung, 44, 1–25, 1941.
Schott, C.: Technica curiosa sive mirabilia artis, Endter, Nürnberg and Hertz, Würzburg, 1664.
Schultz, D. M., Kanak, K. M., Straka, J. M.,, Trapp, R. J., Gordon, B. A., Zrnić, D., Zrnic, D. S., Bryan, G. H., Durant, A. J., Garrett, T. J., Klien, P. M., and Lilly, D. K.: The mysteries of mammatus clouds. Observations and Formation Mechanisms, J. Atmos. Sci., 63, 2409–2435, 2006.
Shaw, N.: Manual of Meteorology. Vol. IV, University Press, Cambridge, 1919.
Shaw, N.: Manual of Meteorology, Vol. 1, London, 1926.
Schopenhauer, A.: Parerga und Paraphilomena, Berlin, 1862.
Singer, K.: Wolkentafeln: Les formes des nuages. 12 Bilder in Kupferlichtdruck, unter Mitarbeit Hildebrandsson, Riggenbach, Garnier, Ackermann, München, 1892.
Spänkuch, D., Hellmuth, O., and Görsdorf, U.: What is a cloud? Towards a more precise definition, B. Am. Meteorol. Soc., 103, E1894–E1929, https://doi.org/10.1175/BAMS-D-21-0032.1, 2022.
Sprung, A.: Vorschlag zur Vereinfachung der korrespondierenden Wolkenaufnahmen, Meteorol. Z., 30, 217–220, 1895.
Störmer, C.: Mother-of-Pearl-Clouds over Skandinavia, Nature, 129, 941, 1932.
Störmer, C.: Height of Mother of Pearl Clouds observed in Southern Norway during 1926–34, Nature, 145, 221–222, 1940.
Strachey, R. and Whipple, G. M.: Cloud photography conducted under the Meteorological Council at the Kew Observatory, Proc. Roy. Soc. London, 49, 467–480, 1891.
Stüve, G.: Die Trennungsflächen der Atmosphäre, Ergebnisse der Aerologischen Tagung vom 3. bis 6. Juli 1921 im Preussischen Aeronautischen Observatorium Lindenberg, 42–46, 1922.
Süring, R.: Wissenschaftliche Ballonfahrten, Sammlung populärer Schriften, 36, Berlin, 1895.
Süring, R.: Die Wolkenbildungen, edited by: Assmann, R., Baschin, O., Berson, A., Börnstein, R., Gross, H., Kremser, V., Stade, H., and Süring, R., 1900 – Wissenschaftliche Luftfahrten, 179–195, 1900.
Süring, R.: Schichtbildungen in der Atmosphäre, Illustrierte aeronautische Mitteilungen, 5, 97–104, 1901.
Süring, R.: Schichtbildungen in der Atmosphäre, in: Bernhard Lepsius und Richard Wachsmuth (Hg.): Denkschrift der Ersten Internationalen Luftschiffahrts-Ausstellung (ILA) zu Frankfurt a/M. 1909, Springer, Berlin, Heidelberg, 234–245, 1910.
Süring, R.: Photogrammetrische Wolkenforschung in Potsdam in den Jahren 1900 bis 1920, Veröffentlichungen des Preußischen Meteorologischen Instituts, 7.3, 18–23, 1922.
Tissandier, G.: L'Océan aérien – Ètudes météorologiques, Paris, 1886.
Tromholdt, S.: Nordlichter und Polarbanden in den Monaten April und Mai beobachtet zu Svanholsminde in Jütland, Wochenschrift für Astronomie, Meteorologie und Geographie, 15, 262–264, 1873.
Turgan, J. F.: Les Ballons, Plom frères, Paris, 1851.
US Department of Agriculture: Cloud forms according to the International System of Classification, 1924.
US Hydrographic Office: Illustrative cloud forms for the guidance of observers in the classification of clouds, Washington, 1897.
Vettin, F. U.: Die Luftströmung über Berlin, Österr. Z. Meteorol., 17, 267–275; 351–358, 1882.
Vincent, J.: Les faux cirrus de alto cumulus, Observatoire Royale de Belgique Service Météorologique, 1901.
Vincent, J.: Atlas des nuages.Annales Météorologiques de l'Observatoire royal de Belgique, 1907.
von Bezold, W.: Zur Thermodynamik der Atmosphäre, Sitzungsberichte der k. preuss. Akad. Wiss. Berlin XVII, 485–522, 1888.
von Bezold, W.: Die Meteorologie als Physik der Atmosphäre, Sammlung populärer Schriften, 16, Berlin, 1892.
von Bezold, W.: Über Wolkenbildung, Sammlung populärer Schriften, 24, Berlin, 1894.
Waller, A. V.: Microscopic observations on the so-called vesicular vapours of water, as existing in the vapours of steam, and in clouds, Philos. T. Roy. Soc. London, 137, 23–30, 1847.
Wang, P.-H., McCormick, M. P., Poole, L. R., Chu, W. P., Yue, G. K., Kent, G. S., and Skeens, K. M.: Tropical high cloud characteristics derived from Sage II extinction measurements, Atmos. Res., 34, 53–83, https://doi.org/10.1016/0169-8095(94)90081-7, 1994.
Ward, R. D.: Clouds over a fire, Science, 5, 60–61, 1897.
Wegener, A.: Thermodynamik der Atmosphäre, Barth, Leipzig, 1911.
Wegener, A.: Frostübersättigung und Cirrus, Meteorol. Z., 8–12, 1920.
Wegener, K. and Schneider, K.: Flug und Wind, Die Arbeiten des Preußischen Aeronautischen Observatoriums Lindenberg XV, 251–270, 1926.
Weickmann, L.: Wolkenbildung, Die Naturwissenschaften, 7, 625–628, 1919.
Weilbach, P.: Nordeuropas skyformer, Met. Inst., Kopenhagen, 1881.
Wells, E. D.: Clouds formed by airplanes, Sci. Am., 120, 601, 1919.
WMO (World Meteorological Organisation): International Cloud Atlas, Geneva, The newest edition of 2018, https://cloudatlas.wmo.int/en/definitions-of-clouds.html (last access: 1 November 2025), 1956.
Wolf, H.: Wolken, Spiegel, Uhren, Fotogeschichte, 13, 3–18, 1993.
Wolff, Ch.: Allerhand Nützliche Versuche, Dadurch Zu genauer Erkäntnis Der Natur und Kunst Der Weg gebähnet wird, Halle, 1722.
Zöllner, F.: Über das Nordlicht in seiner Beziehung zur Wolkenbildung, Berichte über die Verhandlungen der k. sächs. Gesellschaft der Wissenschaften zu Leipzig, 23, 329–332, 1871.
- Abstract
- Preliminary remark
- Early explanations of cloud formation and the floating of clouds – nearly 200 years of the vesicle hypothesis
- Early cloud classification approaches
- Prognostic use
- Cloud forms influenced by orography
- International Commission for Cloud Research
- Theoretical background and progress
- Exploring the third dimension
- Cloud Atlases
- Present day's valid types and characteristics of clouds
- Stratospheric and mesospheric clouds
- Anthropogenic activities and cloud formation
- Overview from Satellites
- Conclusions
- Data availability
- Competing interests
- Disclaimer
- Acknowledgements
- Review statement
- References