the Creative Commons Attribution 4.0 License.
the Creative Commons Attribution 4.0 License.
 | 19 Apr 2024
Atmospheric electricity observations at Eskdalemuir Geophysical Observatory
R. Giles Harrison
John C. Riddick
Atmospheric electricity measurements, principally of the hourly potential gradient (PG), were made continuously at Eskdalemuir Observatory, Scotland (55.314° N, 3.206° W), between 1911 and 1981. Air ion properties were also determined. The sensing apparatus for PG measurement at Eskdalemuir initially used a Kelvin water dropper potential equaliser (1911–1936), followed by a radioactive probe from 1936 and, from 1965, a horizontal stretched wire sensor at 0.5 m, all attached to recording devices. Monthly mean PG data from these instruments are now available digitally. Originally, the data were classified into undisturbed and disturbed days, using the chart record (electrogram). This approach has deficiencies at Eskdalemuir due to mist, fog and calm conditions, which can influence the mean PG despite the day appearing undisturbed on the electrogram. Nevertheless, a correlation with Pacific Ocean temperature fluctuations is apparent in the Eskdalemuir PG data between 1911 and 1950. As at Lerwick, there was an abrupt decrease in the PG caused by nuclear weapon detonations in the late 1950s and early 1960s. The 1950s PG decrease began at Eskdalemuir before that at Lerwick, for which possible additional local factors are evaluated.
- Article
(8740 KB) - Full-text XML
- BibTeX
- EndNote


Eskdalemuir Geophysical Observatory in the Scottish Borders region has provided magnetic and meteorological measurements since it opened in May 1908 (Anonymous, 1909; Dawson, 2005). As at many geomagnetic measuring sites, atmospheric electricity measurements were made from early in the observatory's operation, ending in 1981. In this paper, the instruments and methods used for the atmospheric electrical measurements are described and summarised. These measurements are principally of the potential gradient (PG), which is an atmospheric electrical quantity which responds to both local meteorological changes and global influences, through the global atmospheric electric circuit. There is renewed interest in atmospheric electricity because of its links with climate and space weather, for which historical datasets are important. To provide background to the long series of Eskdalemuir PG measurements, this work draws extensivelyon the annual volumes1 of the Observatories Year Book (hereafter OYB), published from 1922 until 1967, succeeding the British Meteorological and Magnetic Year Book and other accounts (Blackwell, 1958; Dawson, 2005). The unpublished volume “Instruments of Eskdalemuir Observatory” by Albert Gendle2 (Gendle, unpublished) is especially valuable, copies of which are held in the Ewart Library, Dumfries, and the Westerkirk Parish Library, Langholm.
Eskdalemuir is a small settlement in the Scottish Borders, 29 km from the nearest principal towns of Lockerbie and Langholm. This remote site3 was chosen because the established observatory at Kew was experiencing increasing interference to magnetic measurements from outward expansion of London's electrical tramways. The observatory's construction began in 1904, partly supported by GBP 10 000 compensation from the tramway company (Walker, 2011). During the initial construction from 1903 to 1908, building materials came from local quarries, with other items transported via the railway station at Langholm. These buildings continue to provide scientific facilities, as well as on-site staff accommodation, initially in the Rayleigh and Schuster houses augmented later with the Glazebrook, Shaw and Richardson houses.
The observatory is about 5 km north-northwest of the original Eskdalemuir parish church, lying at the end of an access road leading west from the B709, just north of Davington. Figure 1a shows the observatory location in the UK (55.314° N, 3.206° W), together with an aerial view of the site (Fig. 1b). At the north end of the site are huts for magnetic measurements, with the meteorological measurements made nearer to the main building. The atmospheric electrical measurements were originally made at the main building. A notice on the entrance gate (ca. 2005), Fig. 1c, specifically mentioned the atmospheric electricity work.
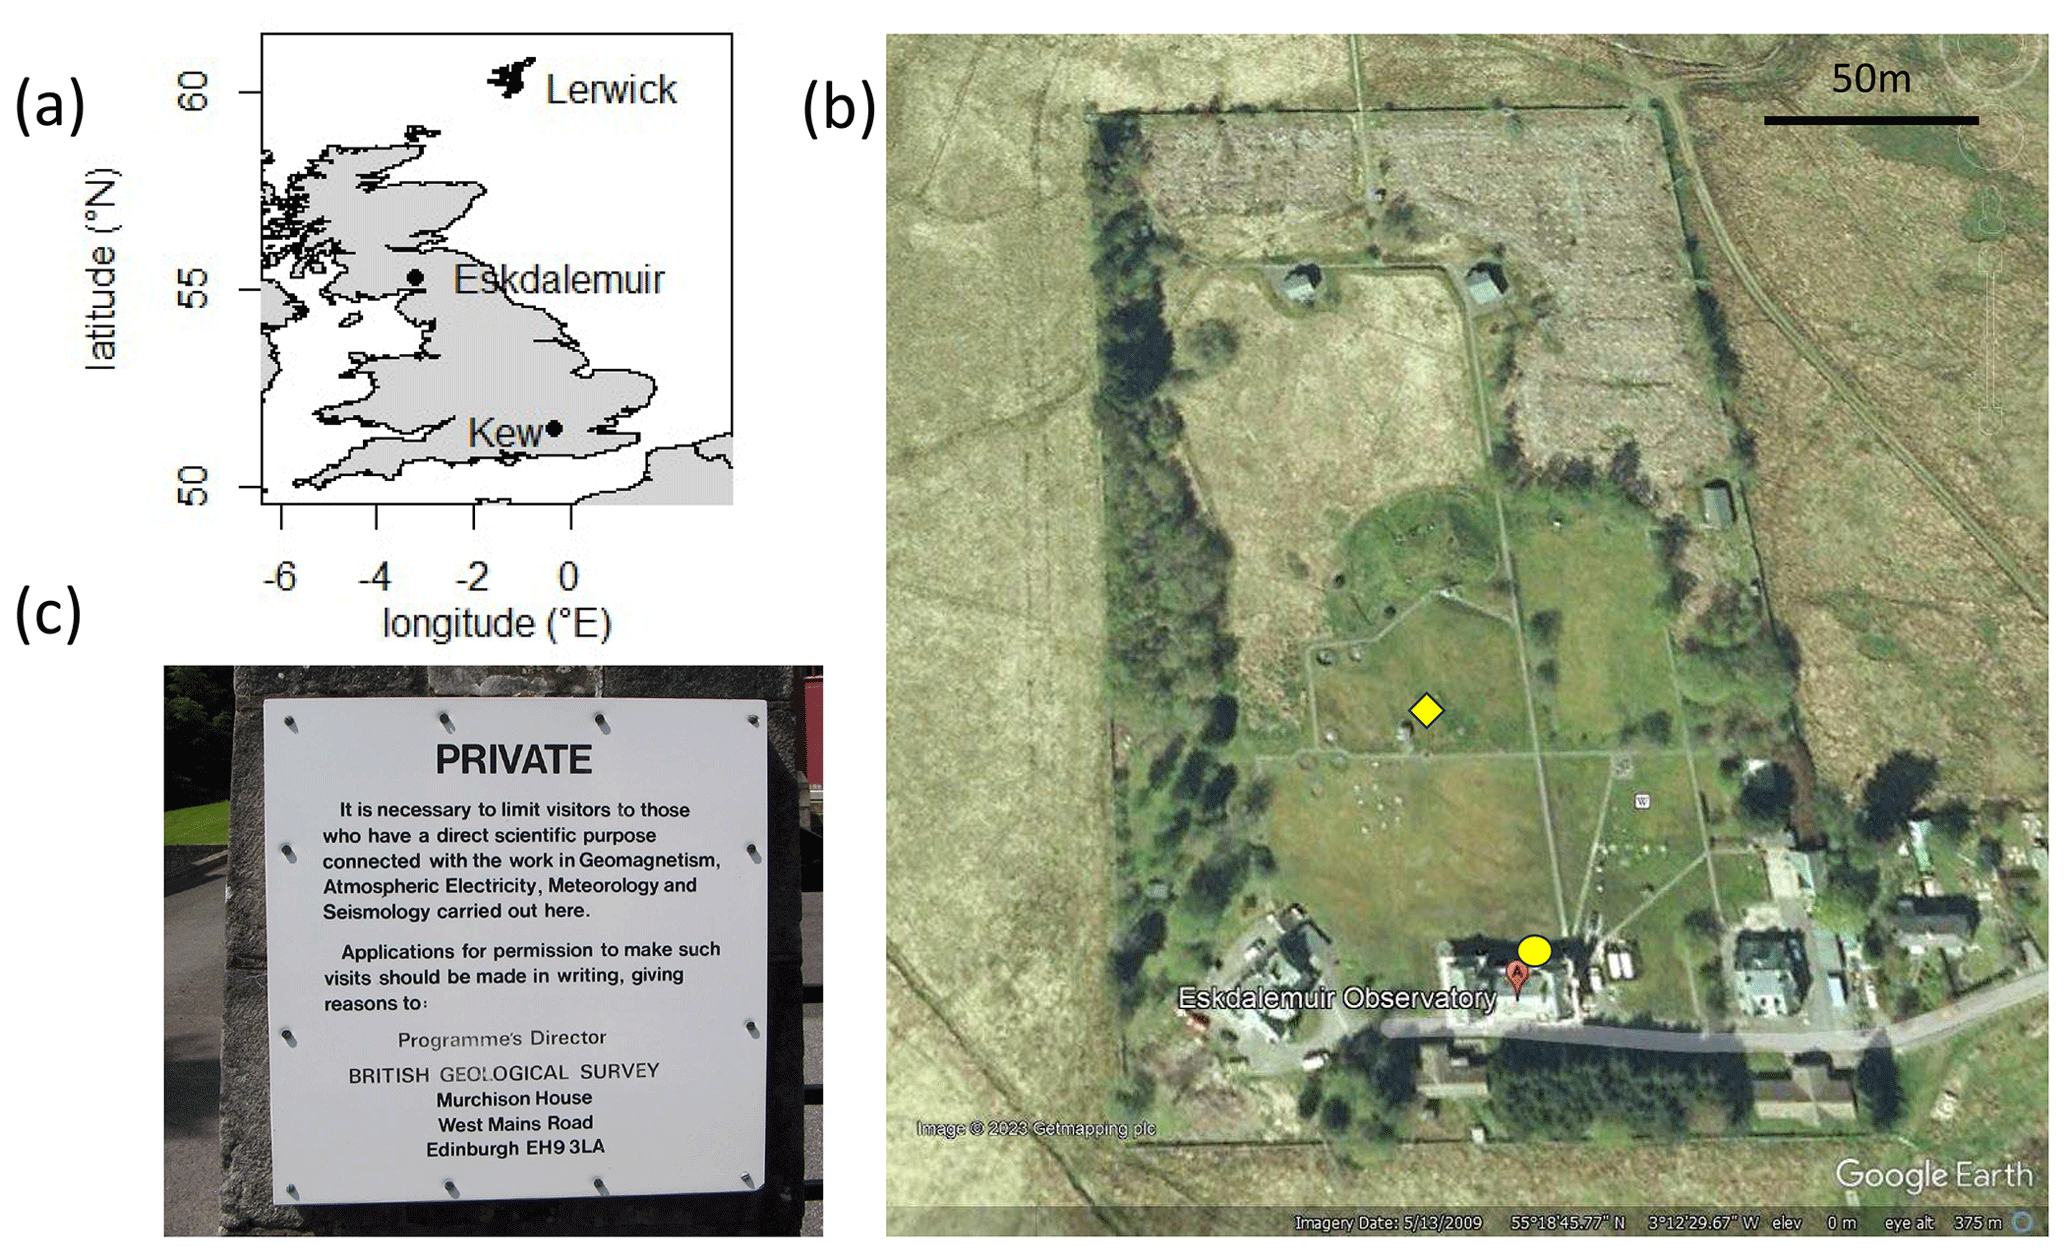
Figure 1Maps showing (a) the locations of the geophysical observatories at Kew, Eskdalemuir and Lerwick; (b) the Eskdalemuir site from above; (c) a notice at the observatory gate in 2005. In panel (b), the original PG measurement position is marked (filled circle), as well as the position of the Brewer hut (filled diamond). Image in panel (b) © Google Earth.
Established practice at Kew was mirrored in the scientific and working arrangements at Eskdalemuir (Macdonald, 2018), such as having graduate scientific assistants and a superintendent in charge, the first being George Walker.4 The Met Office inherited responsibility for the observatory's operation in 1910 from the National Physical Laboratory. This arrangement continued until 1968, when, following the formation of the research councils, the Natural Environmental Research Council became responsible for observatory operations through the Institute of Geological Sciences (IGS) and subsequently the British Geological Survey (BGS) in 1980. The atmospheric electricity measurements ceased at Eskdalemuir in December 1981, following the closure of Kew Observatory in 1980 (Anonymous, 1980).
At its opening in 1908, Eskdalemuir Observatory had six staff: three scientific and three providing technical and housekeeping support. Staff appointments to Eskdalemuir were made regularly by the Met Office, with several of the individuals posted there having notable later importance in science: Gordon Dobson, 5 who briefly led magnetic measurements at Eskdalemuir in 1913; Lewis Fry Richardson,6 superintendent from 1 August 1913 to May 1916; and James Stagg,7 an occasional senior professional assistant in the 1920s and 1930s. Richardson was succeeded as superintendent by the geophysicist Alexander Mitchell.8 Dobson and Richardson are known to have both directly contributed to the Eskdalemuir atmospheric electricity work, with Dobson providing the first comparative analysis of early measurements with other sites (Dobson, 1914) and Richardson personally undertaking measurements of air ion properties (Harrison, 2007). The need for continuous hourly meteorological observations greatly increased the staff during the 1960s and 70s, but staff numbers later diminished with expansion in automation of the observing duties.
The early atmospheric electrical equipment was listed as comprising a Benndorf radium collector electrograph (Hatakeyama, 1934; Benndorf, 1906), two Wulf electrostatic voltmeters (serial numbers 1684 and 1685) and two sets of Ebert apparatuses (OYB22, p. 22). The Ebert apparatus and related instruments were essentially portable for occasional measurement of the properties of atmospheric ions or to provide calibration measurements. Similar equipment was used at Kew. A further continuous recording system – the water dropper electrograph9 – was installed within the fabric of the observatory building. This also replicated equipment in use at Kew, where a water dropper electrograph was first installed in 1861 (Everett, 1868). Overhaul of the Kew electrograph in the 1890s renewed interest in analysis of the electrical data,10 around the same time (Chree, 1916, 1906, 1897). As at Kew, the Eskdalemuir electrograph was intended to provide continuous atmospheric electricity measurements, capturing variations in the atmospheric potential gradient (PG) on a photographic chart recorder. A timeline of significant developments in atmospheric electricity and the operation of the electrograph at Eskdalemuir is given in Table 1.
Table 1Notable changes in the atmospheric electricity measurements at Eskdalemuir.
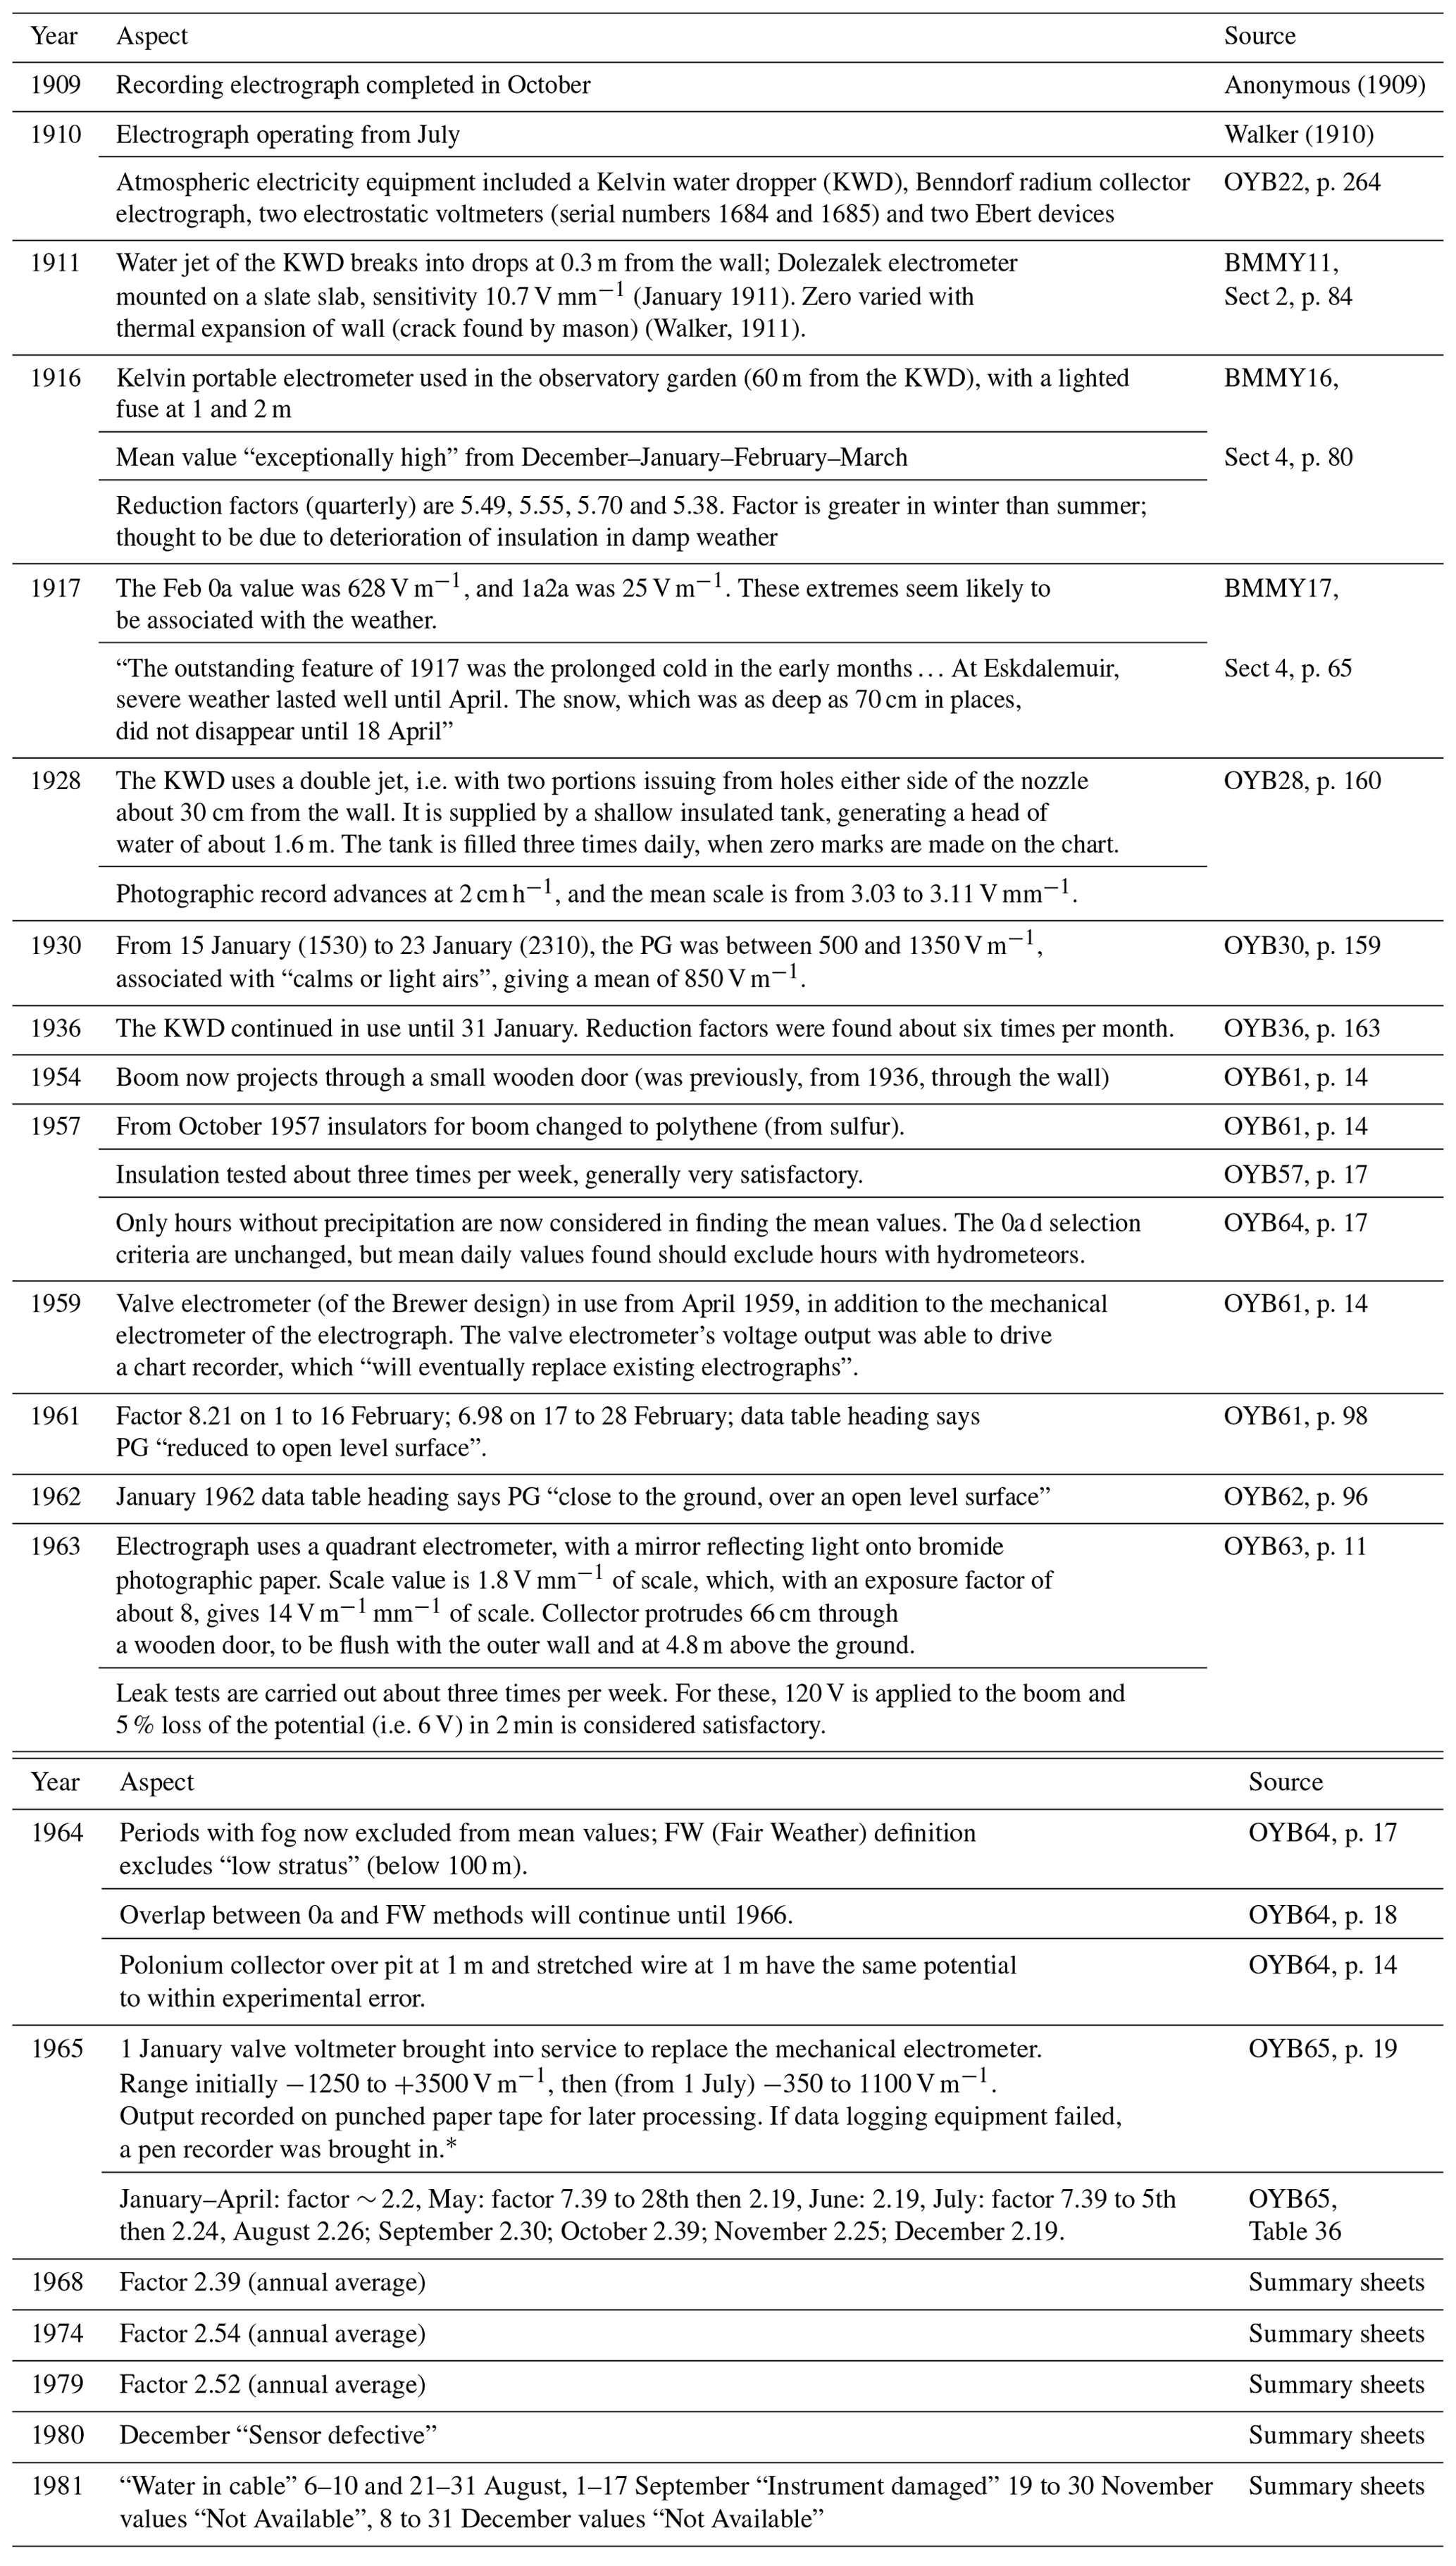
* The abrupt factor changes during the first year's operation of the stretched wire electrograph imply an occasional need to bring the previous electrograph system back into service.
These two aspects of the atmospheric electricity work – determination of the local air's ion properties and the continuous PG measurements – are now discussed separately.
3.1 Air ion apparatus
The Ebert apparatus was used for measuring the properties of air ions, specifically their concentrations and mobilities. These two quantities, for both positive and negative ions, are necessary to calculate the electrical conductivity of air, which is a fundamental property in atmospheric electricity. The Ebert apparatus employed a cylindrical electrode system mounted vertically, aspirated by a fan (Ebert, 1901). Charge was transferred to the central electrode through the deflection of ions by a strong electric field, measured using a Wulf electrometer. An additional charged rod could be inserted to change the proportion of the ions deflected. This allowed both the ion number concentration and mobility – the ion speed per unit electric field – to be measured. Figure 2a shows the Ebert apparatus in use at Eskdalemuir, and, in Fig. 2b, a page from the bound volume illustrates the typical data recorded. In Fig. 3, summaries of data from the Ebert apparatus during 1909–1911 are shown, with mean ion number concentrations 496 cm−3 and 309 cm−3 for positive and negative ions respectively (Harrison, 2007).
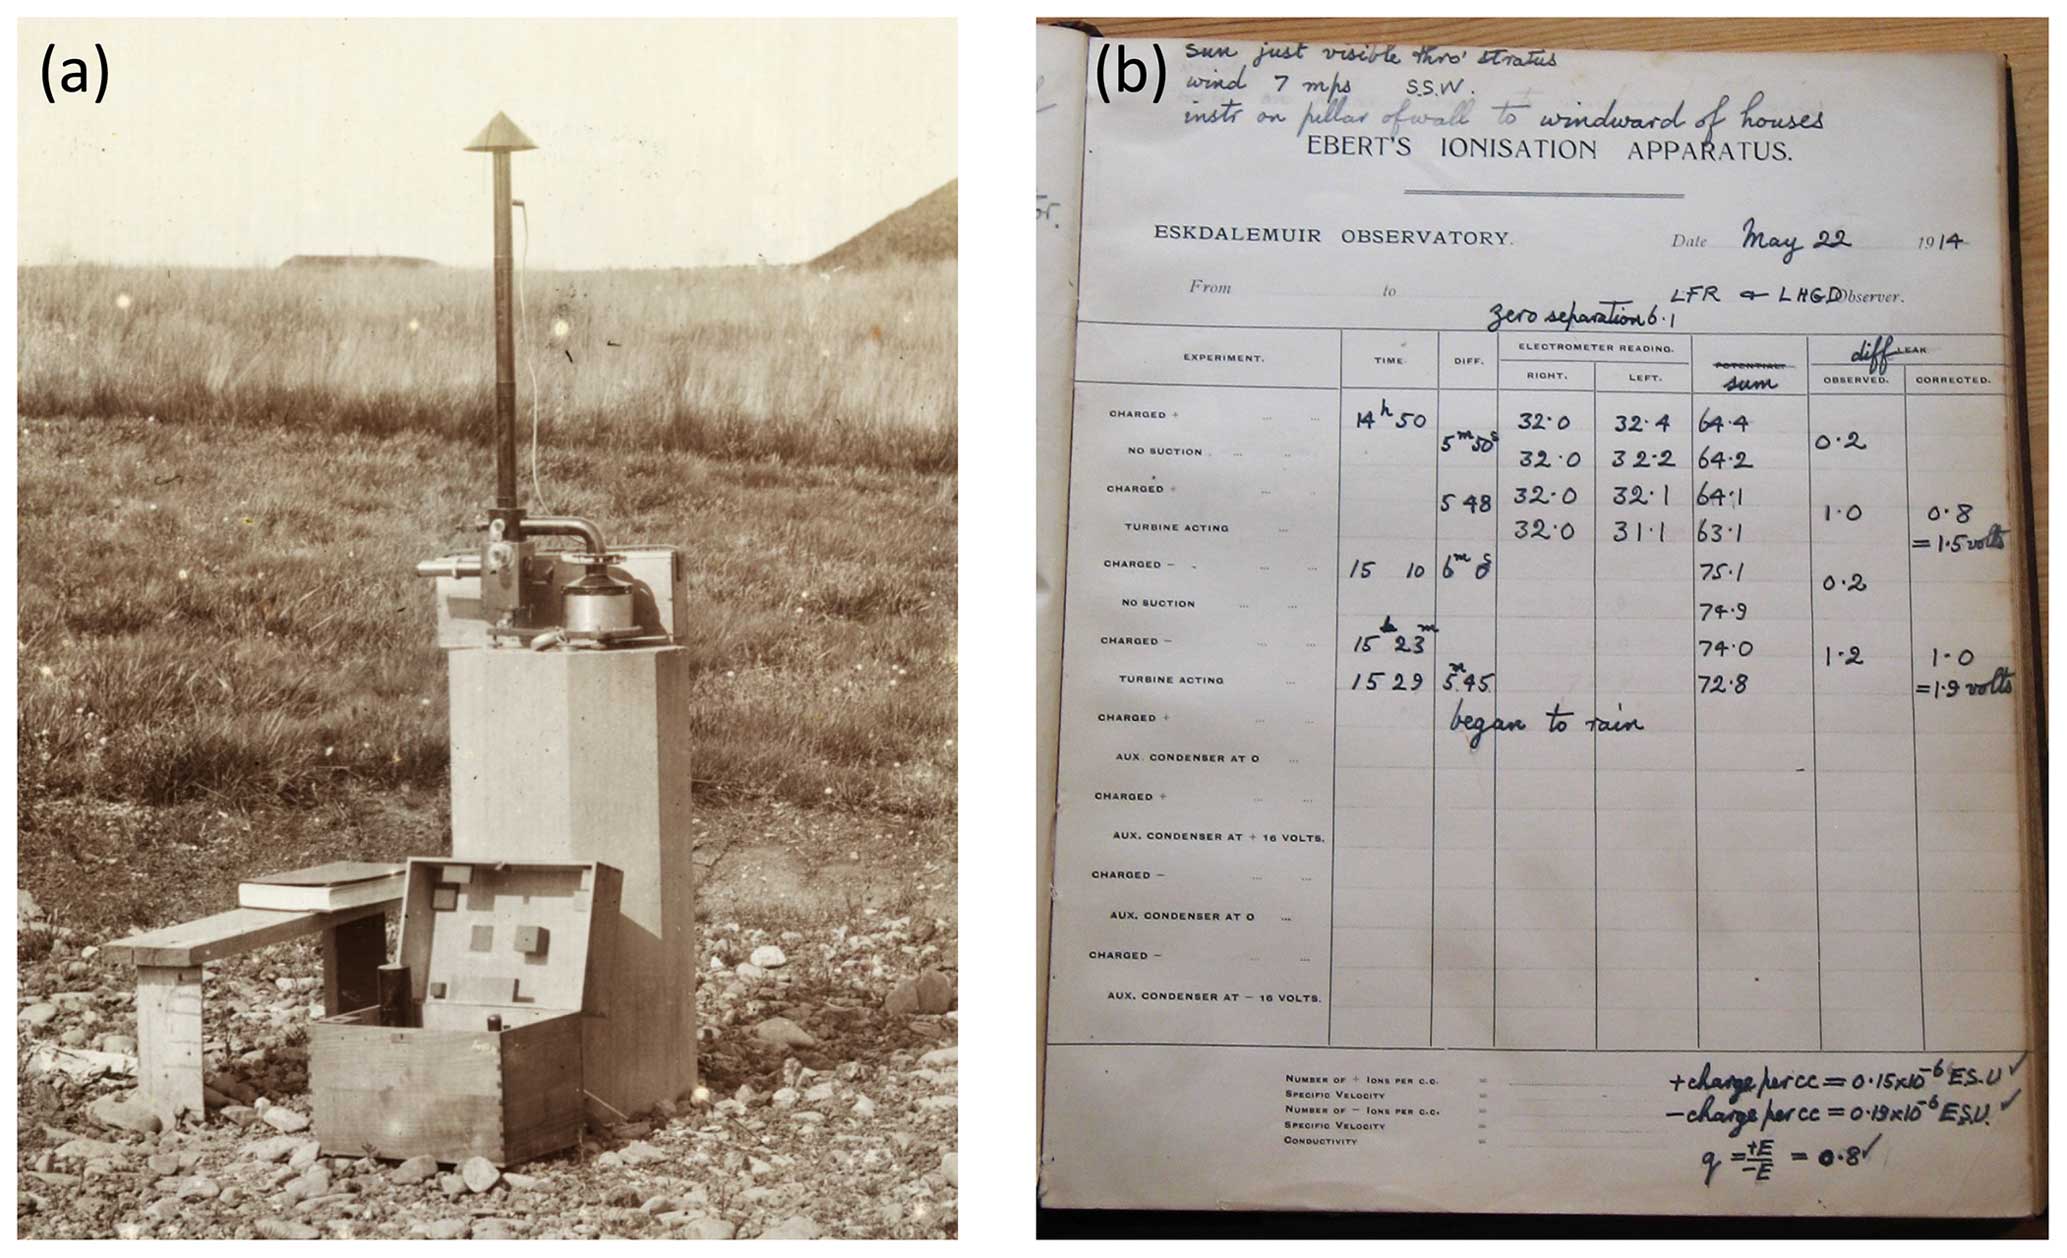
Figure 2(a) Ebert apparatus in use at Eskdalemuir, ca. 1912 (Gendle, unpublished). (b) Measurements recorded from the Ebert apparatus on 22 May 1914. The initials “LFR” are those of the superintendent Lewis Fry Richardson. Image in panel (a) is image RS11499 of the Royal Society Picture Library, reproduced with permission, and panel (b) is from Giles Harrison of the Eskdalemuir archive material.
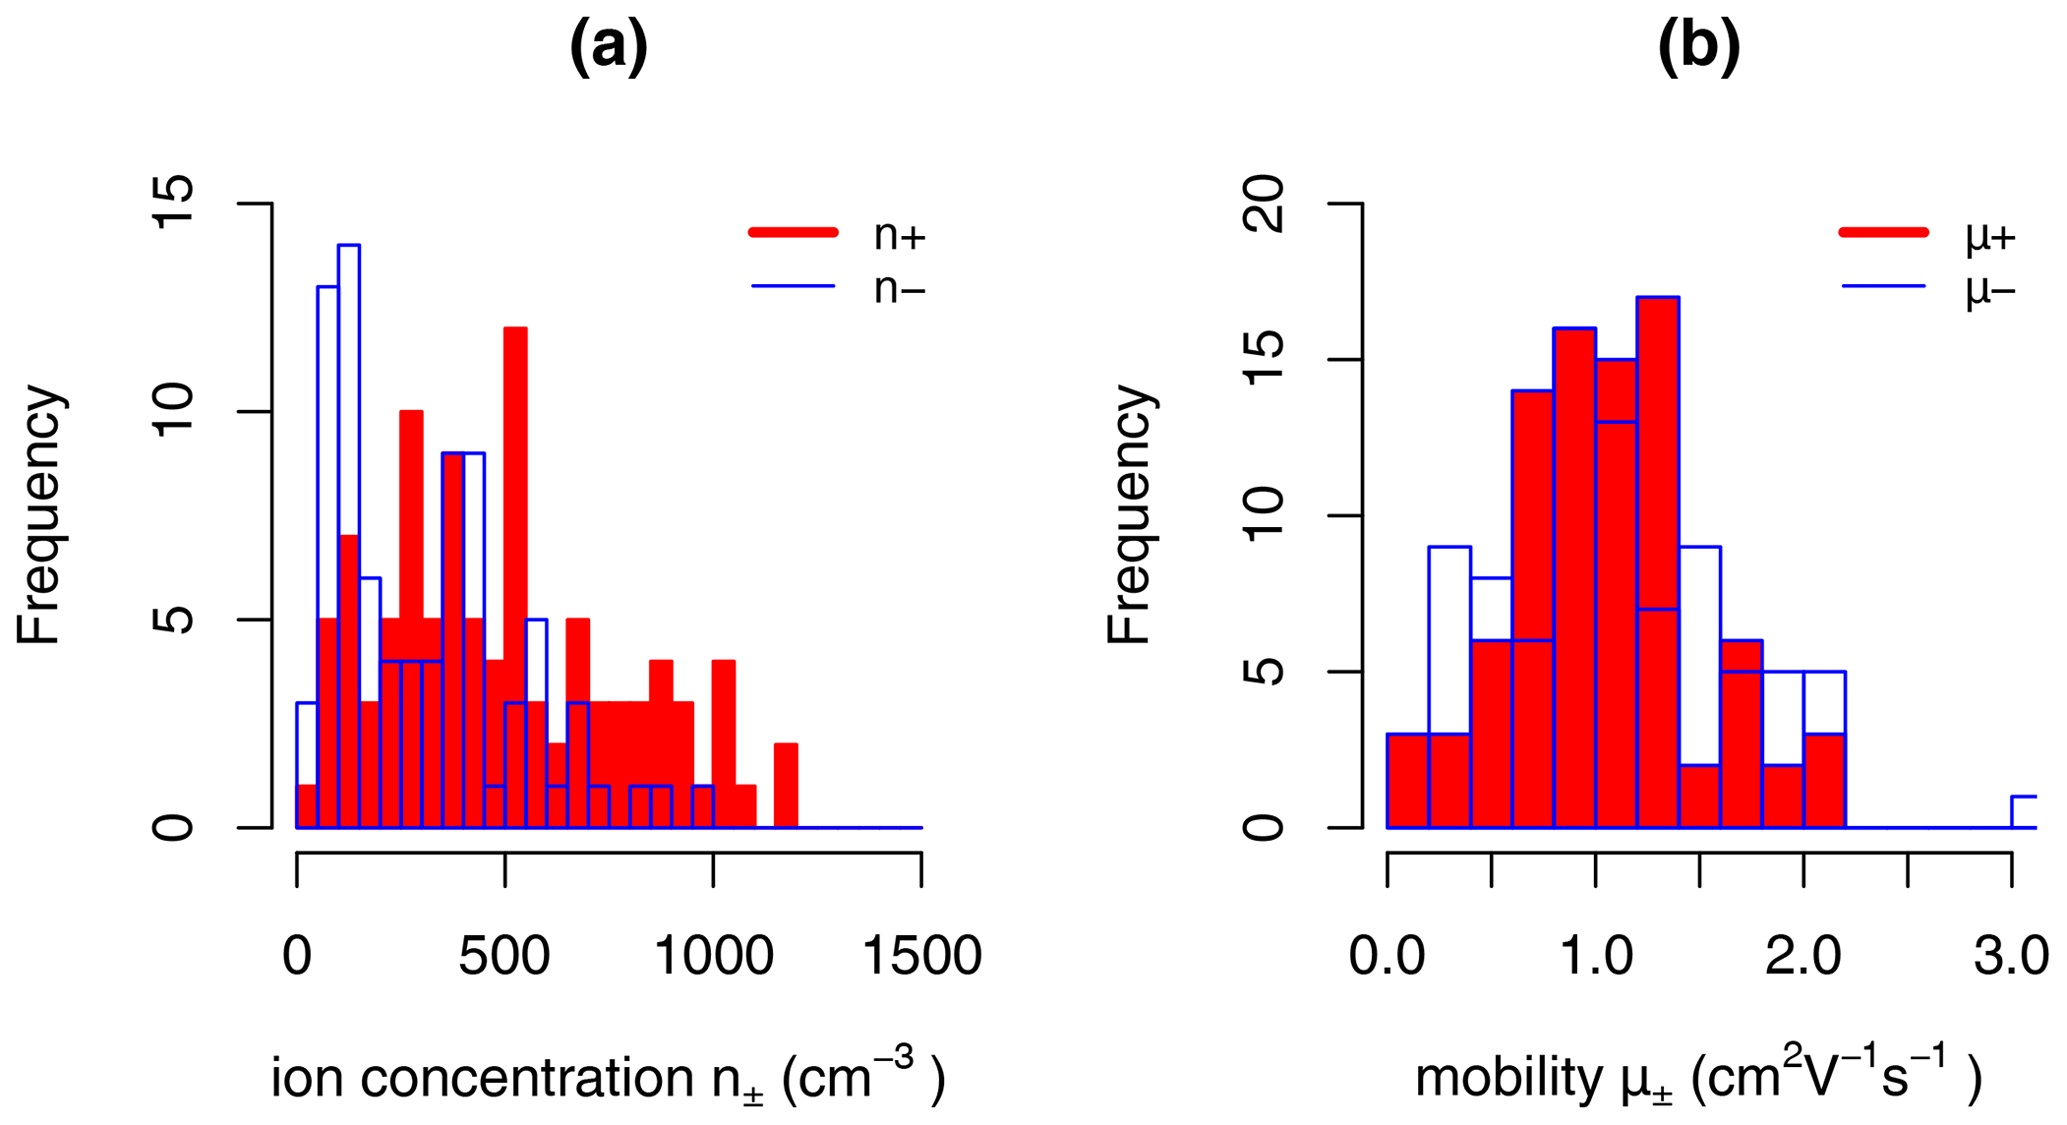
Figure 3Histograms of (a) bipolar ion concentrations and (b) ion mobility measured at Eskdalemuir, 16 February 1909 to 14 December 1911 (Harrison, 2007).
Repeatable ion measurements were obtained at Eskdalemuir, but the Ebert apparatus worked poorly at Kew, which was attributed to the low mobility of the charge carriers present there (Dobson, 1914).
3.2 Potential gradient recording apparatus
Continuous measurement of the potential gradient11 (PG) at the three UK observatories of Kew, Eskdalemuir and Lerwick was achieved through using an exposed sensor (or collector) able to acquire the local electrical potential of the air. Each collector was connected to an electrometer with an attached recording device, together forming a measuring system known as an electrograph, providing chart records known as electrograms.
3.2.1 The electrograph
The original PG apparatus at Eskdalemuir consisted of a Kelvin water dropper (KWD) collector, operational from July 1910 (Walker, 1910). The KWD collector used an insulated sensing pipe, protruding through the north wall of the main building (see Fig. 4). This generated a spray of fine droplets which equalised the potential of the insulated pipe with its surroundings (Aplin and Harrison, 2013). No image of this equipment exists, but it is described extensively by Gendle (unpublished) with an instructive diagram, reproduced in Aplin and Harrison (2013) as their Fig. 2. The sensor was situated above the northeast doors of the observatory, with the KWD located 3.8 m above the access road below, as shown in Fig. 4b.
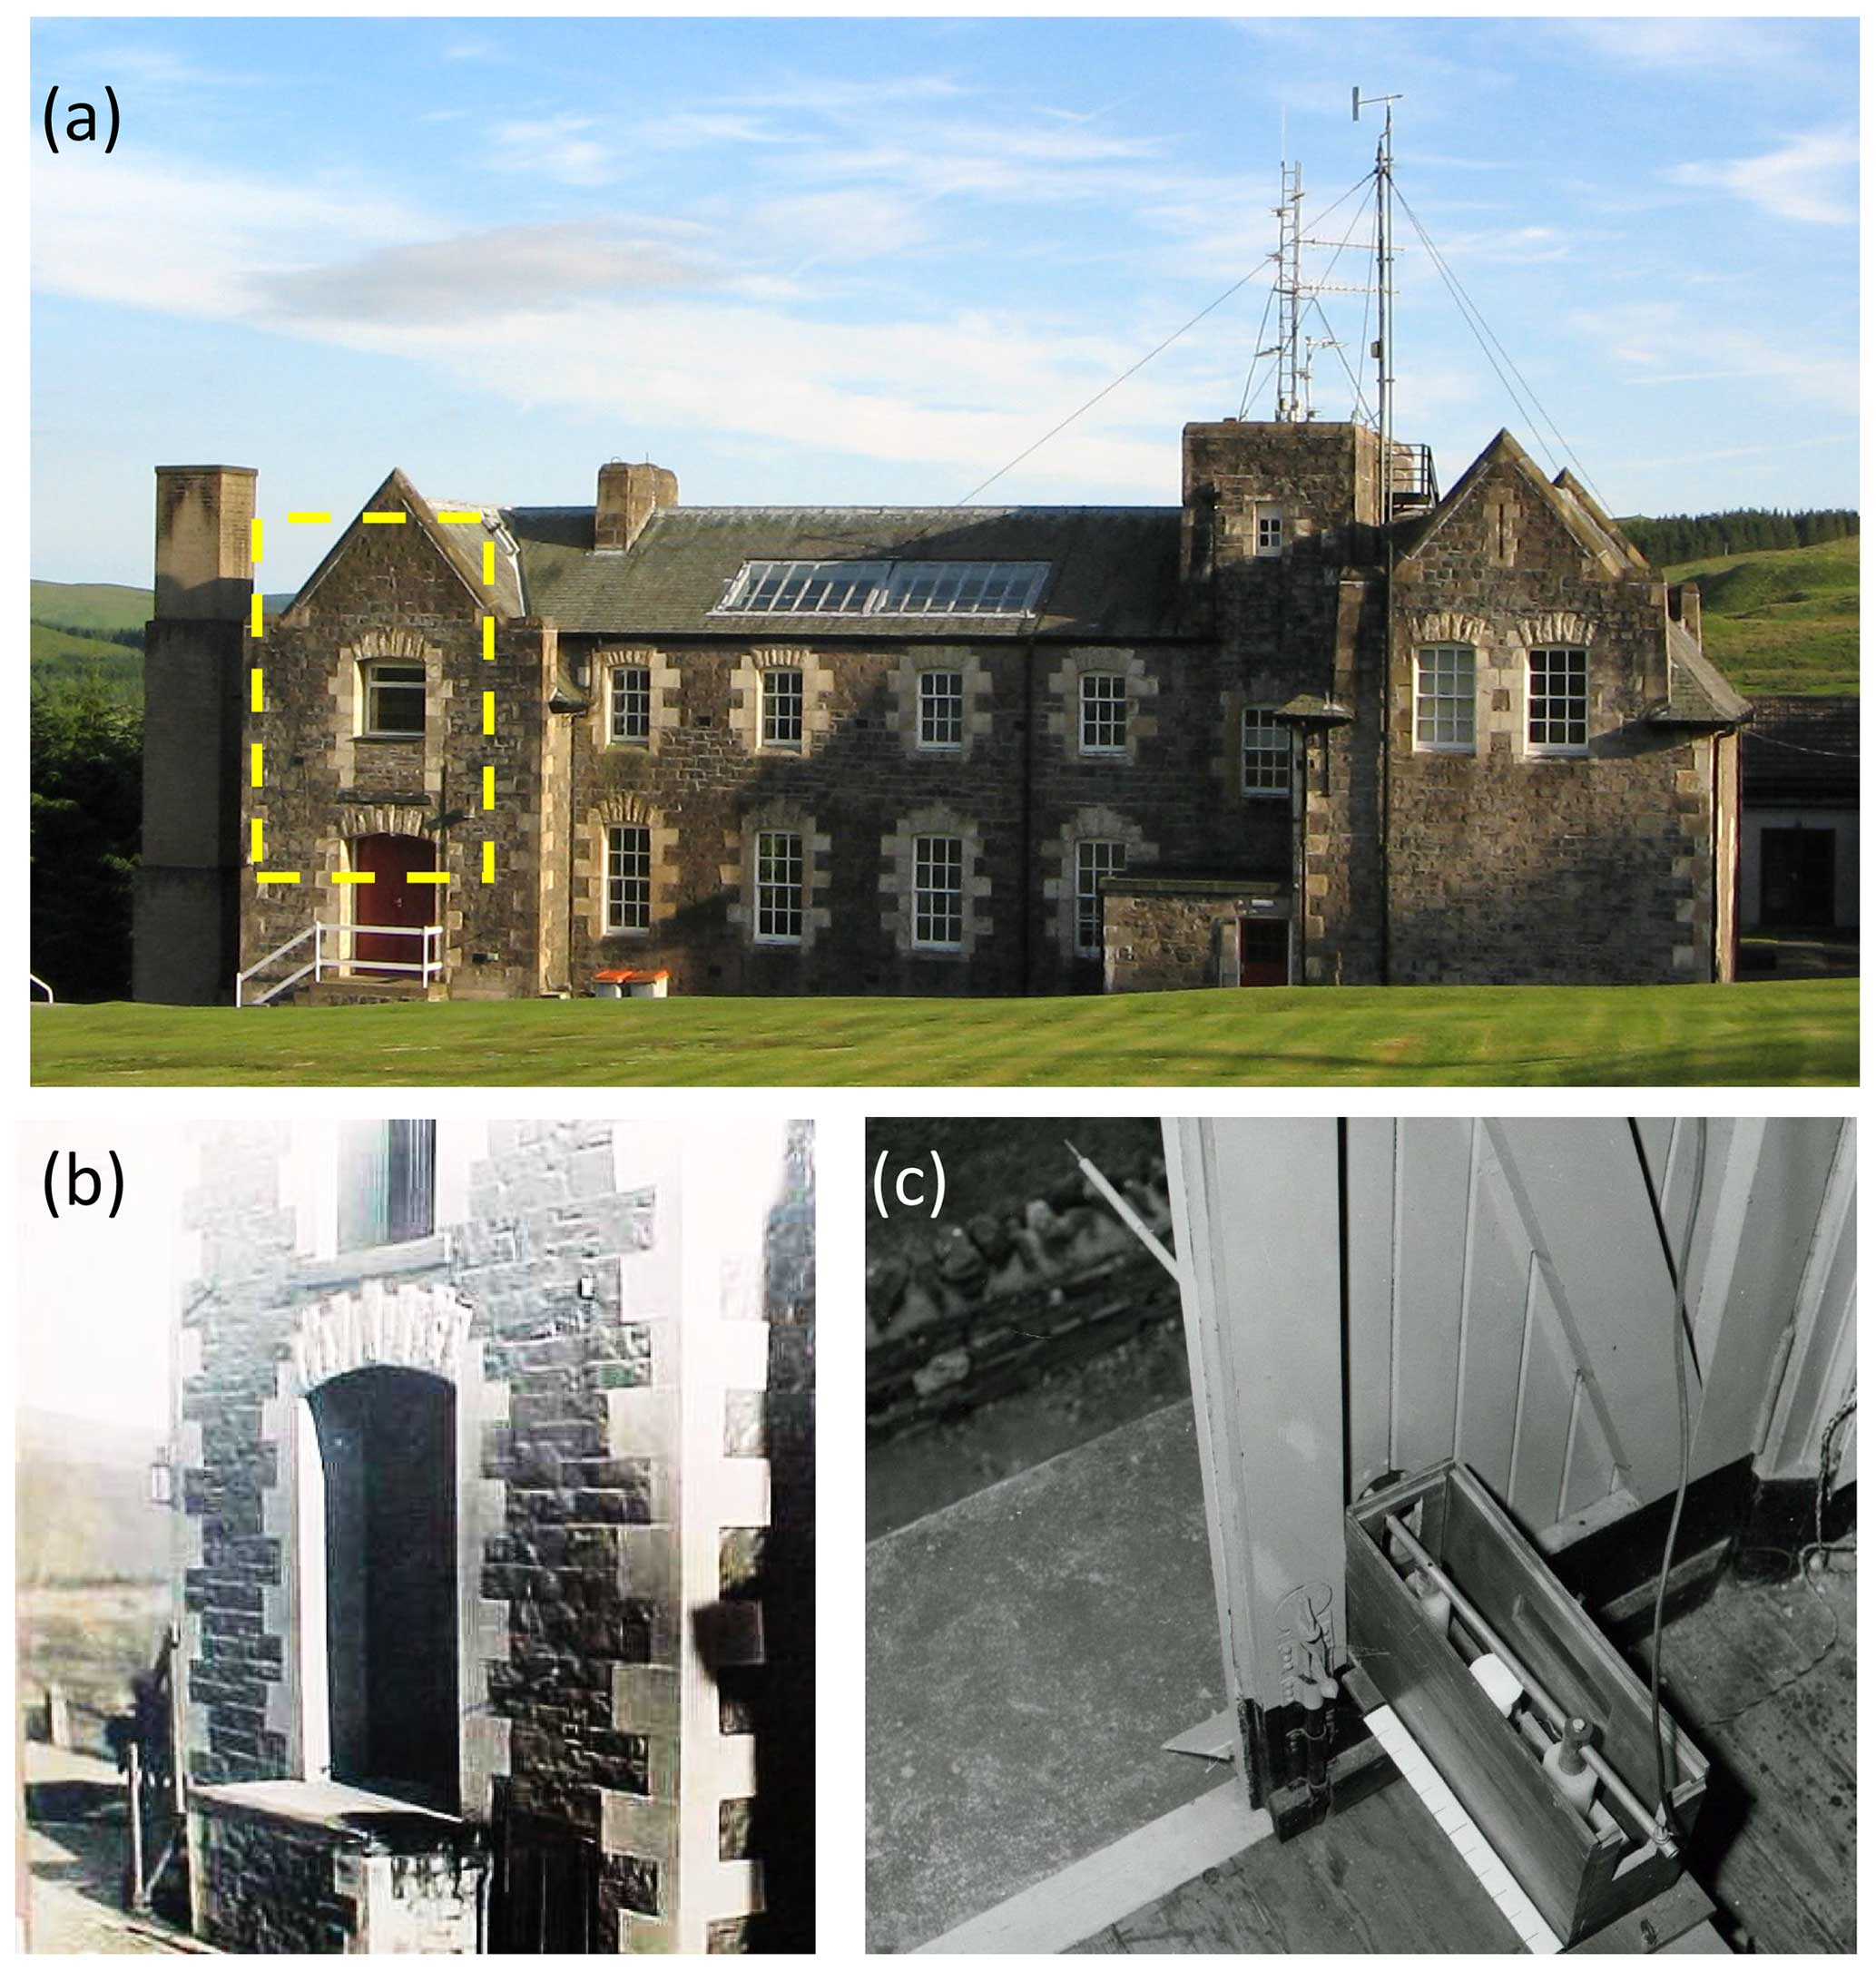
Figure 4(a) Position of the electrograph in the main building of Eskdalemuir Observatory. (b) Evidence of the Kelvin water dropper operation is apparent from the wet lower surface in front of the northeast door. (c) 1964 view of the radioactive collector boom mounted on insulators, protruding from the upper door. Image in panel (a) is from Giles Harrison, and panels (b) and (c) are from the Eskdalemuir Observatory archive.
The water dropper sensing pipe was supplied from a shallow tank, also well insulated, generating a head of water of about 1.6 m. At the end of the insulated pipe, a pair of holes in a nozzle generated water jets on either side, at about 30 cm from the wall. The sensing tube was connected to a recording Dolezalek quadrant electrometer, mounted on a slate slab. In its original form in January 1911, the sensitivity was 10.7 V mm−1 of chart trace deflection, found from fortnightly scale tests, increasing to 13.0 V mm−1 in May 1914 (Richardson, 1914). These standardisations were made using voltages generated by a Zamboni pile, monitored with a Wulf electrometer. The double-water-jet system was implemented to improve the efficiency of the potential equalisation, yielding a time constant of 36 s (Walker, 1910).
Whenever the header tank was filled, at 07:00, 13:00 and 21:00 GMT, zero reference marks were made on the chart paper. In the first measurements undertaken, the zero point was found to vary with thermal expansion of the rear wall, in which a crack was ultimately found by a stonemason (Walker, 1911). Insulation of the electrograph equipment was tested by turning the water jet off, and the system charged from batteries. If the equivalent of less than one-half of the potential was lost in 28 min (as measured over 4 min), the insulation was considered satisfactory (OYB28).
The water dropper equaliser system was replaced by a polonium-plated collector on 1 February 1936, manufactured specially by the Government Chemist (Anonymous, 1955). These collectors were about 50 mm in length, carrying ∼ 100 µCi of activity at one end and threaded at the other end for fitting to a boom. They were regularly changed, with the “Local Staff Instructions” warning staff to handle the collectors carefully and to avoid touching the radioactive tip.12 The boom carrying the collector protruded through the upper external doors of the room at the east end of the observatory office, where the original water dropper electrograph had operated. Initially it was thought that the insulation of the radioactive collector, originally using sulfur insulators, was poorer than for the water dropper (OYB36, p. 163). In October 1957 the sulfur insulators were replaced by polythene insulators. A later view of the arrangement is shown in Fig. 4c, where the position of the collector at the end of the boom can be seen, as well as the polythene insulators supporting the boom.
3.2.2 Standardisation
The photographic chart recordings made by the electrograph, measuring close to the main building, had to be scaled to find the equivalent PG of an open area. From the outset of the PG measurements at Eskdalemuir, this was achieved by making a short set of comparison measurements over open ground – levelled specially for the task (Walker, 1910) – by an observer positioned within a pit at a distance from the main building (Fig. 5a, b, c). The pit had a flat roof which was flush with the close-cropped grass surface to minimise local electric field distortion. An insulated rod was pushed through a hole in the roof cover of the pit to which an ionising device was attached, with the rod connected to a Wulf electrometer mounted on a stone pier. Originally the rod carried a burning fuse of blotting paper impregnated with lead nitrate, at 1 m above the surface, which was later changed to a polonium source to provide ionisation. After the lid was closed, the electrometer voltage was read every 30 s to give up to 20 values. The potential found from these results was regarded as the absolute PG at that location, and a multiplying factor found with which simultaneous measurement of the electrograph could be scaled to give the same PG. This factor was typically ∼ 5.5 (Richardson, 1914). This process of finding the scale factor was repeated on about 5 d each month, with a single smoothed value applied to each month's electrograph readings using a 3-month centred moving average.
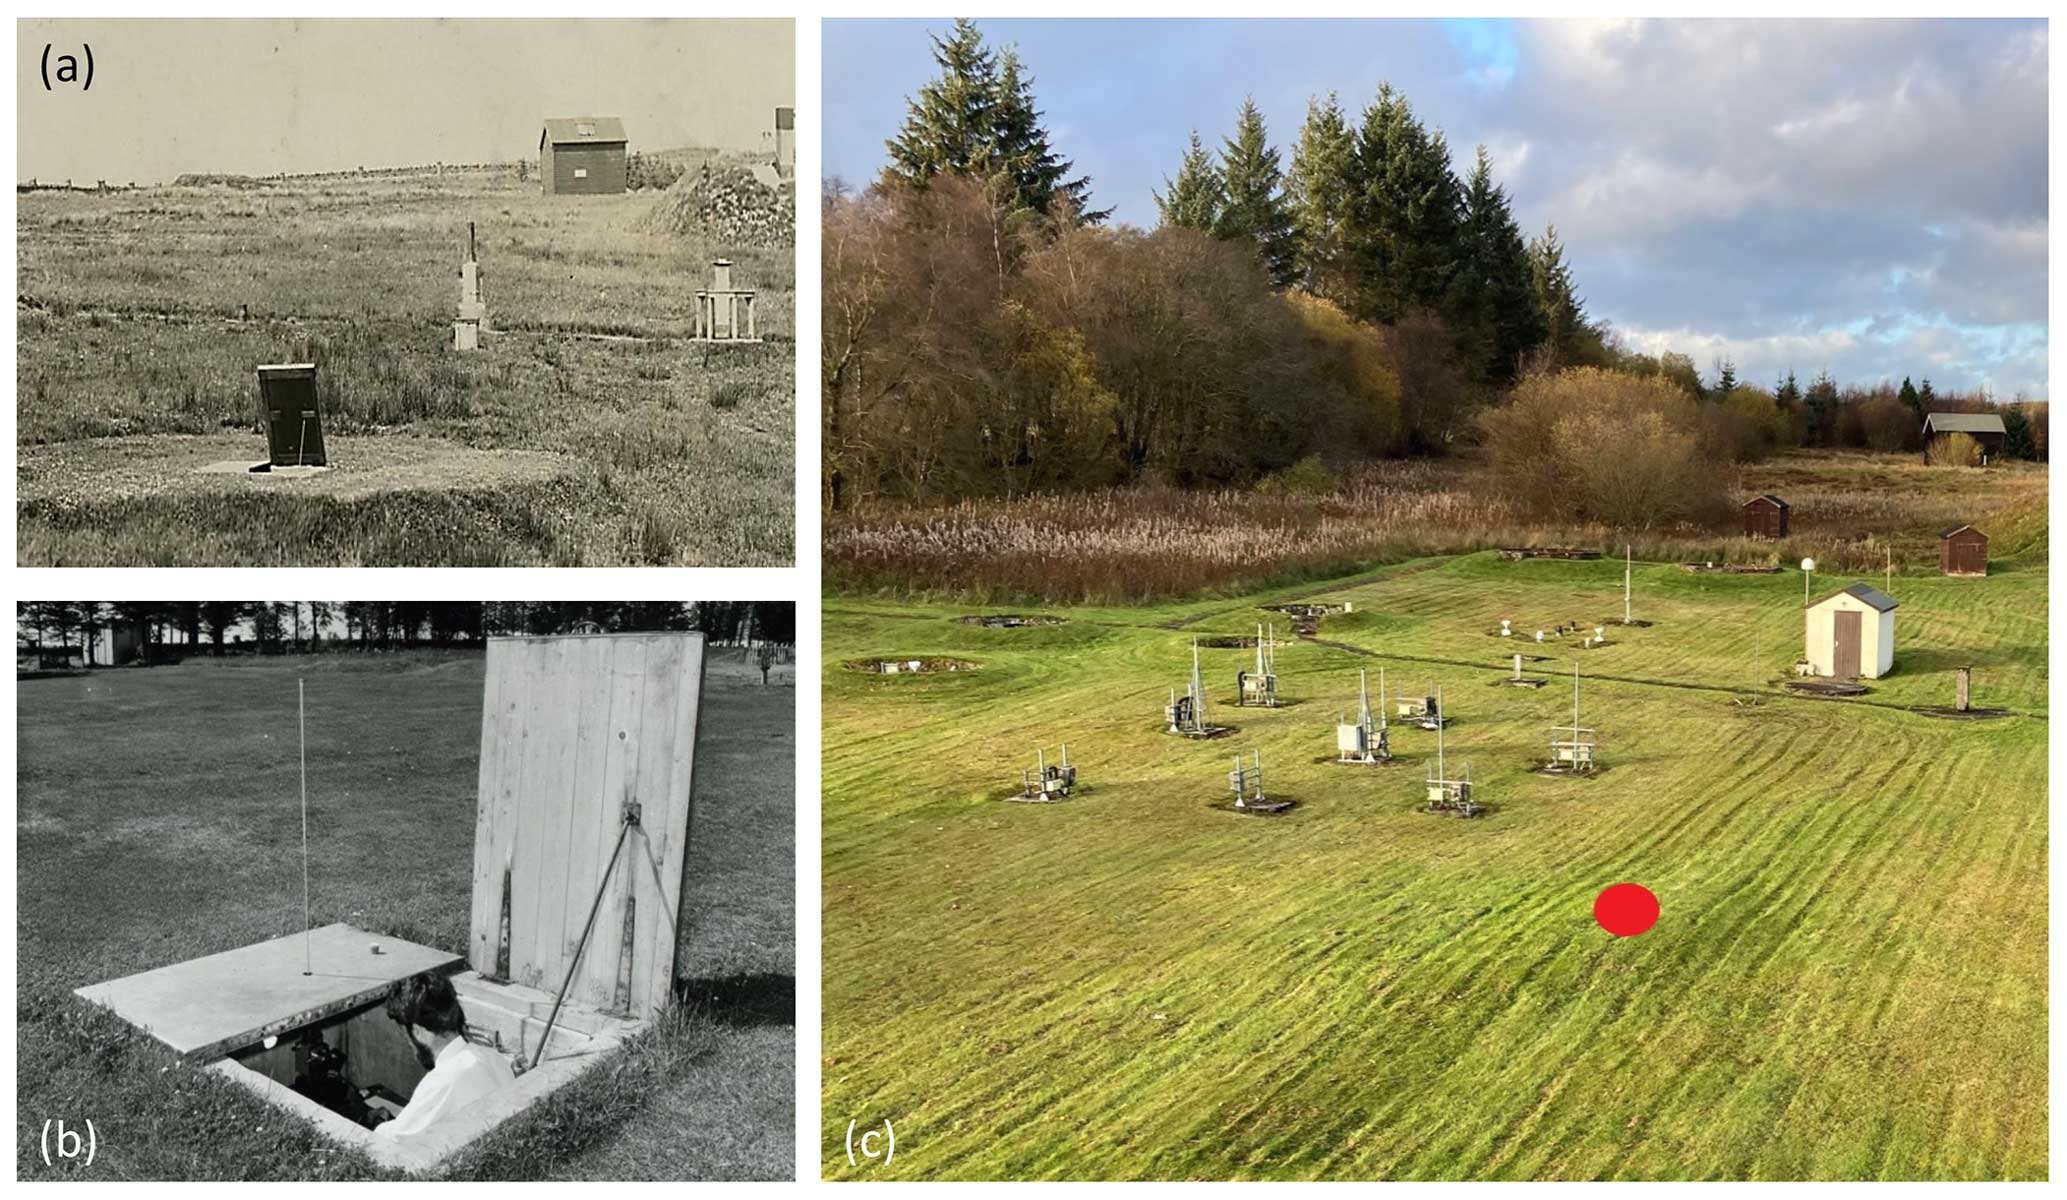
Figure 5(a) Early image of the calibration pit (1923), with the roof open, and (b) later image (1964) showing the use of the pit. (c) View from the main building of the Brewer hut (November 2023). The pit has since been filled in, but its original location is marked with the red circle. (The observer in the pit in panel b is Alan Maule). Images in panels (a) and (b) are from the Eskdalemuir Observatory archive, and panel (c) is from John Riddick.
3.2.3 Stretched wire electrograph
In 1959 a long wire antenna system was introduced, which allowed direct measurement of atmospheric potential with minimal field distortion. This was referred to as the stretched wire electrograph. It was installed near to the middle of the site, at the north end of the Brewer hut beyond the main building (see also Fig. 1b of Harrison, 2004). The stretched wire13 and pit PG values were found to “agree to within experimental error” (OYB65).
The stretched wire for the electrograph consisted of a length of galvanised wire about 10 m long, suspended at 0.5 m above the ground. One end was connected to a signal conditioning amplifier in the Brewer hut and the other end was attached via a polythene insulator to a vertical steel support post. At the wire's centre, a polonium equaliser was attached to hasten the acquisition of the local potential through increasing the air conductivity (see also Fig. 5a of Harrison and Riddick, 2022). The potential of the stretched wire was obtained using a high-input-impedance cathode-follower-valve electrometer, designed for rapid response, wide range and ultra-low current leakage (Brewer, 1953). The output was sufficient to drive a remote centre-zero chart recorder, located in the Galitzen room of the main observatory building (Fig. 6a). The chart recorder appears similar to the type used in Lerwick, where the Brewer design of electrometer was also used (see Fig. 6 of Harrison and Riddick, 2022).
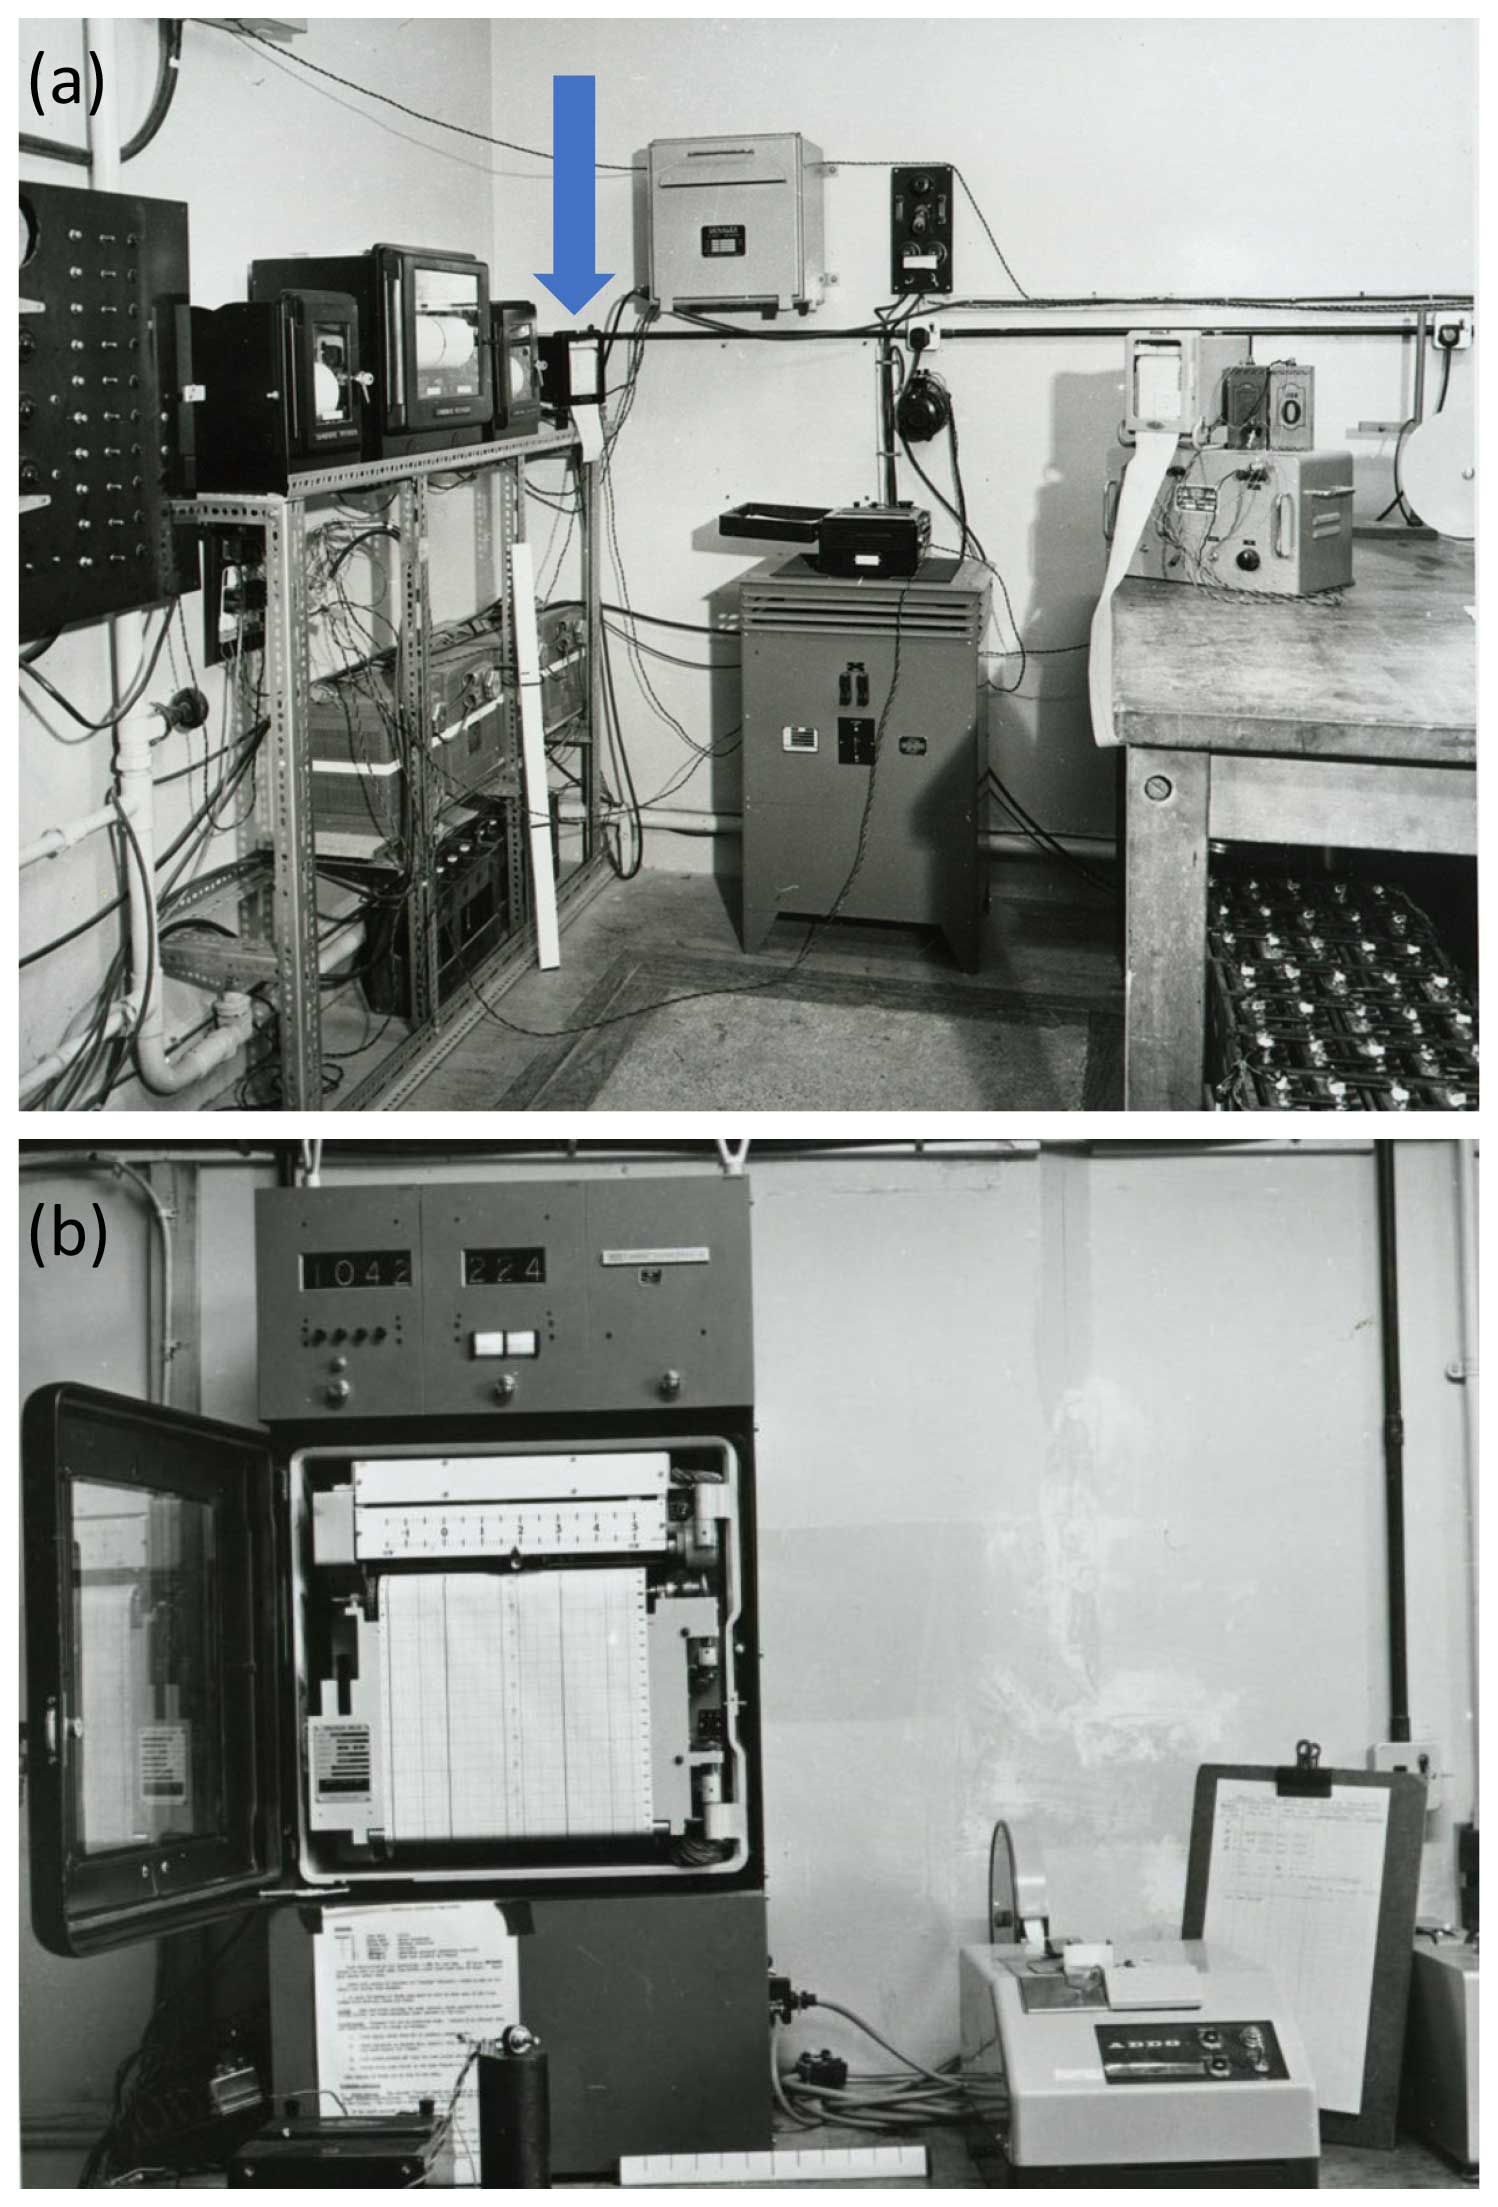
Figure 6Images of the data recorders in the Galitzen room of the main building in the mid-1960s. (a) Chart recorders on the racking include one used with the Brewer electrometer, marked with an arrow. (b) Kent multi-channel potentiometric recorder and punched paper tape Met Office Data-Logging Equipment, “MODLE”. Images in panels (a) and (b) are from the Eskdalemuir Observatory archive.
From 1 January 1965, the stretched wire electrograph was adopted as the standard atmospheric electricity monitoring device. The scaling factor applied to the measurement varied between about 2.4 and 2.5 between 1968 and 1975, which brought the stretched wire potential determined at 0.5 m to an equivalent PG in the open at 1 m.
The output of the valve amplifier from the stretched wire was recorded digitally on the Met Office Data-Logging Equipment (MODLE), also located in the Galitzen room, Fig. 6b. The MODLE was designed for solar radiation measurements, providing up to 12 data channels which were sampled once per minute. The data tapes were sent to the National Radiation Centre14 and printed by the mainframe computer at the Met Office's headquarters in Bracknell (Collingbourne, 1969). A single data channel would have been required for the electrograph. For this, the MODLE electronics digitised the voltage produced by the Brewer amplifier, storing the value obtained on a five-track punched paper tape, which was changed daily. As a backup, the MODLE was equipped with a 12-channel Kent potentiometric paper recorder which provided analogue traces of the PG variations. In the event of a failure of the punched tape hardware,15 values could be extracted by staff from the analogue recording using conventional hand-scaling methods. This data logger was the first implementation of digital recording at Eskdalemuir Observatory.
The Eskdalemuir PG data, and occasional ion property determinations, were discussed in the OYB annually, with attention drawn to the days with anomalous values. Selection of the data for such purposes in the early part of the record followed established geomagnetic practice, which was based on identifying the character of the day, i.e. “disturbed” or “quiet” (undisturbed). Days on which the PG was always positive were classified as “0a”, and those with some negative values but within a daily range of less than 1000 V m−1 are classified as “1a” or “2a”. This method of data classification continued at Eskdalemuir and Lerwick until the late 1950s, when it was replaced by selecting only those hourly PG values during which there was defined to be “Fair Weather”,16 or, at least, no precipitation (described as “No Hydrometeors”), using the local meteorological observations. This later method used the available data more effectively as all the possible hours could be used, and, importantly, this made data selection independent of the measured values themselves.
4.1 PG data time series
Figure 7 shows the combined sets of monthly PG values from the entire data series, spanning 1911 to 1981, when the measurements ceased. The time series are separated into two: panel (a) for the undisturbed (0a) and “Fair Weather” data and panel (b) for more disturbed (1a or 2a) and “No Hydrometeor” data.
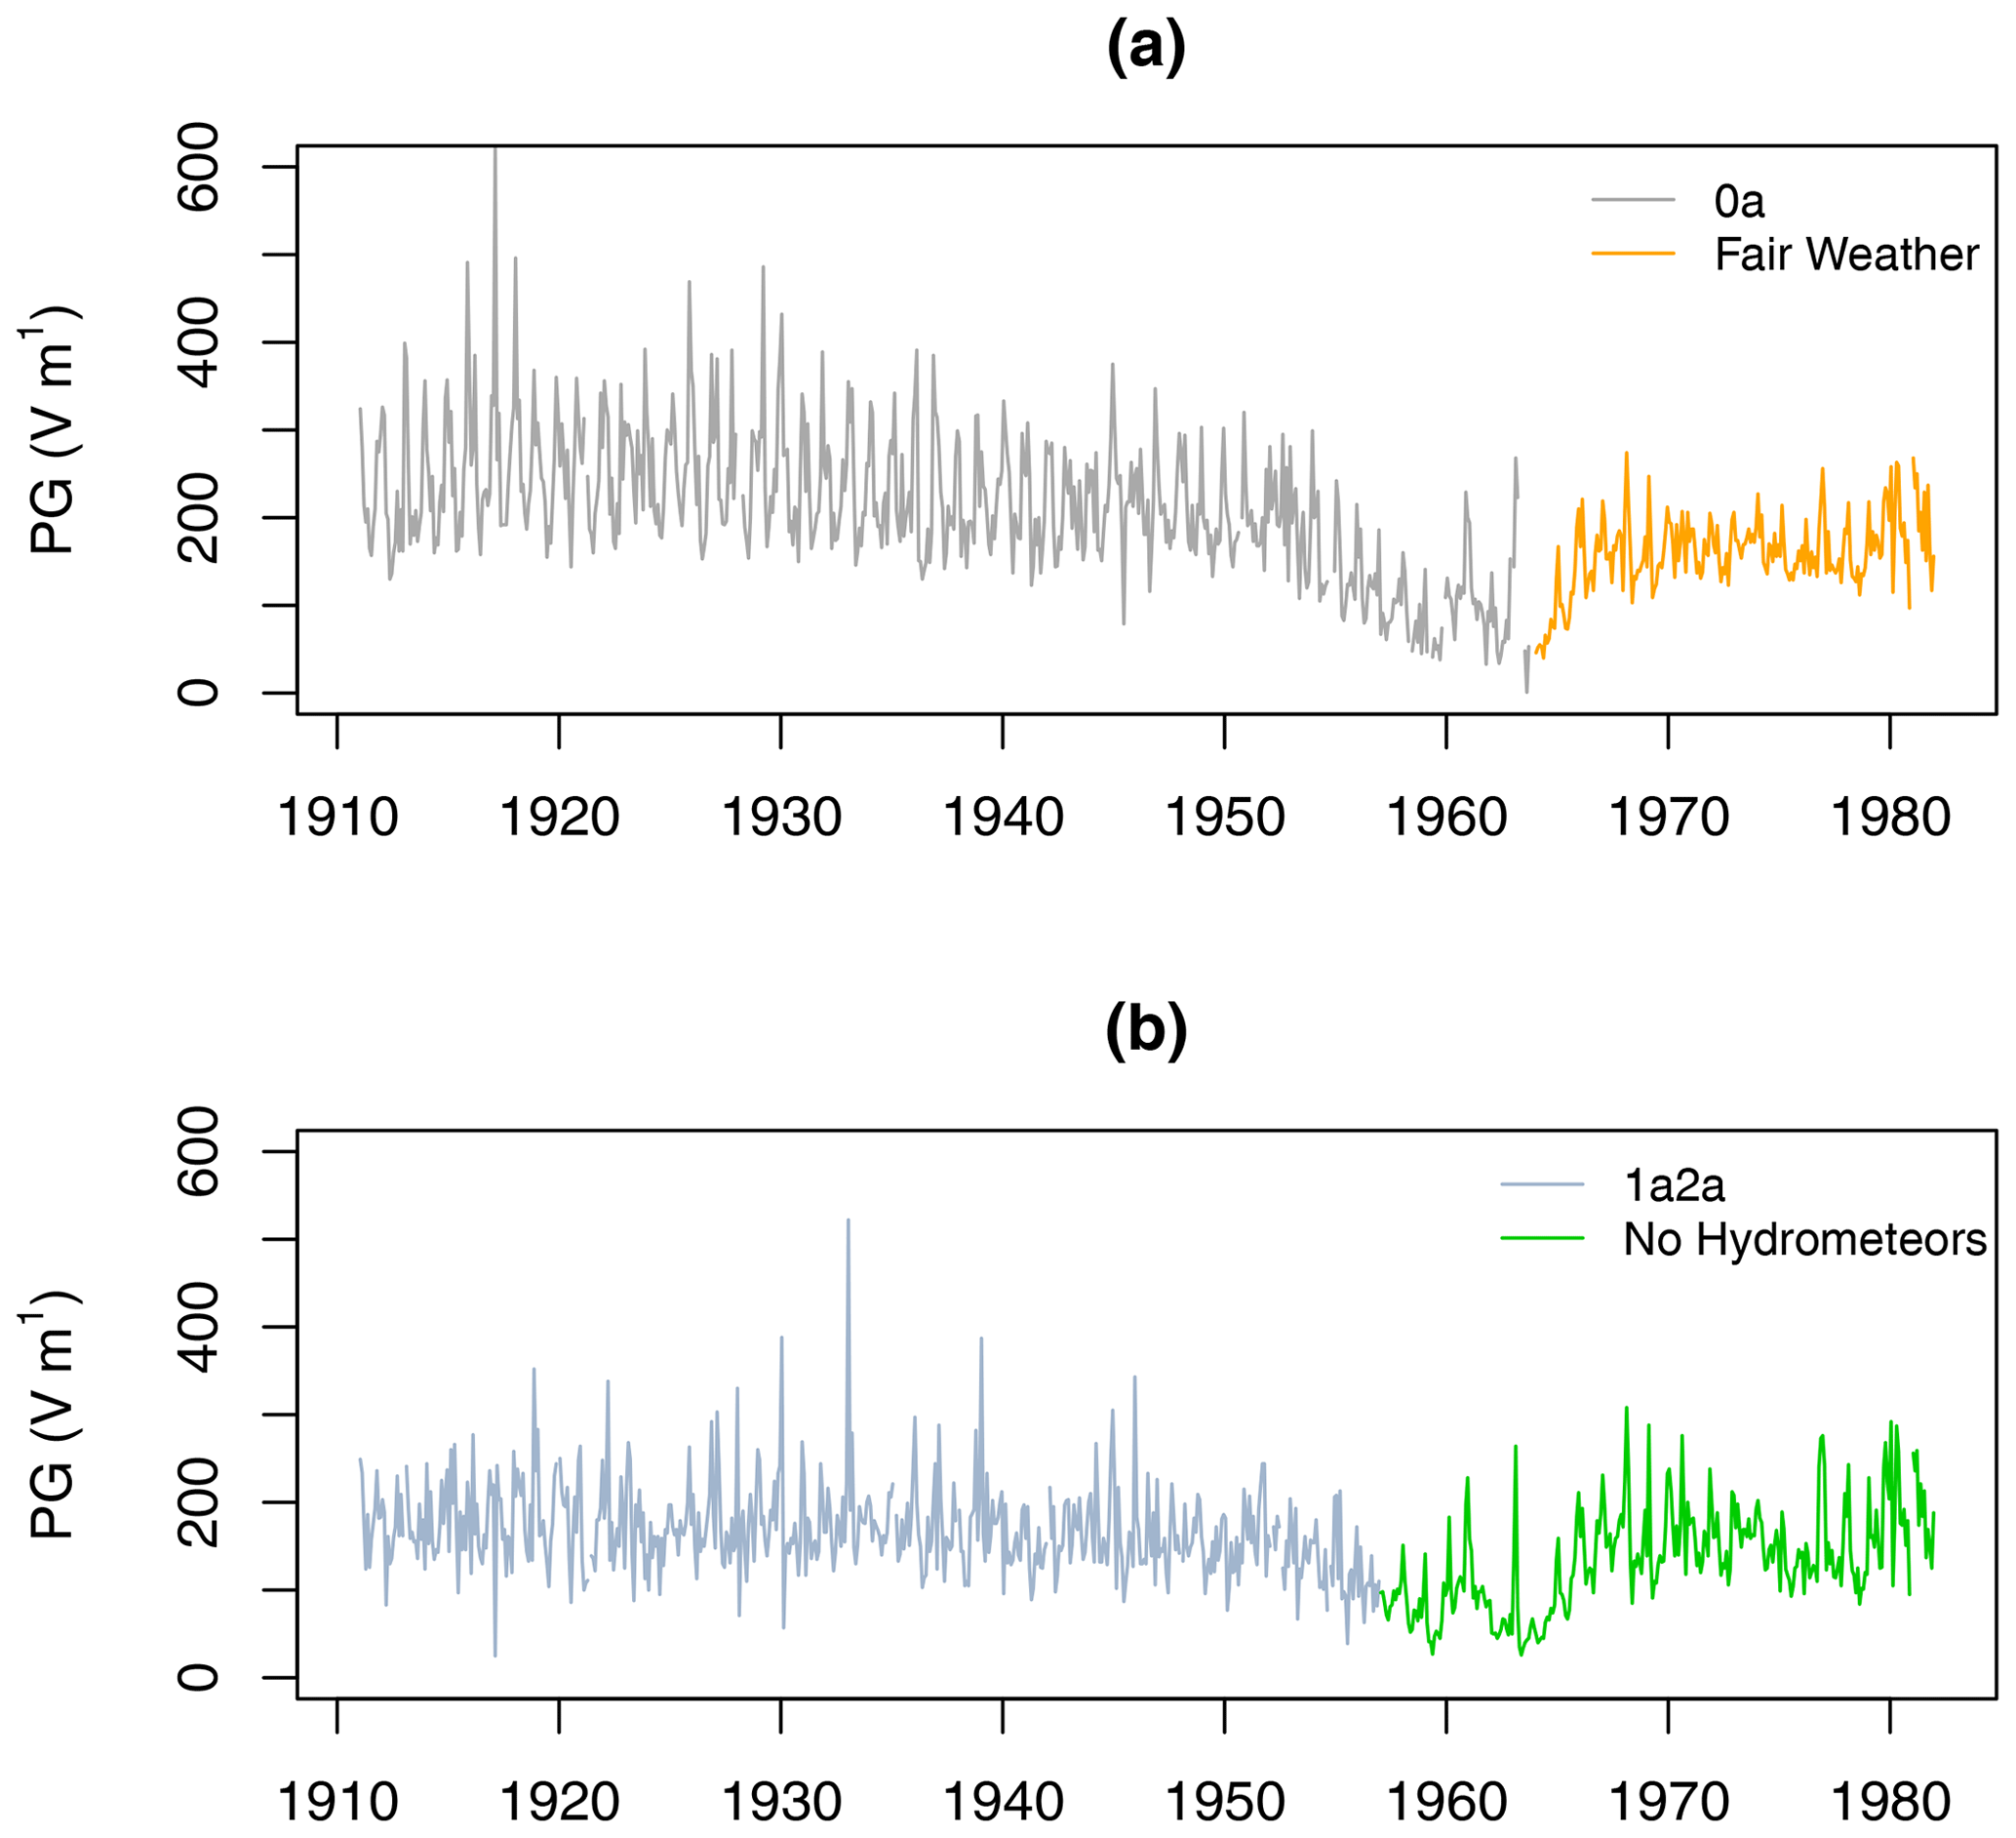
Figure 7Time series of monthly mean PG from Eskdalemuir under different data classifications. (a) Monthly mean PG using (early period) days with no negative values (“0a”, grey line) and (later period) from hours of “Fair Weather” (FW, orange line). (b) Monthly mean PG using (early period) days with PG range less than 1000 V m−1 (“1a2a”, grey line) and (later period) hours with “No Hydrometeors” (NH, green line).
Several features are immediately apparent in the PG series. Firstly, there is an annual cycle present, with some winter values in Fig. 7a exceeding 300 V m−1, especially prior to 1940. Secondly, there is a decrease and recovery in the 1950s and 1960s, known to be associated with the period of atmospheric nuclear weapons testing. Thirdly, the mean values shown in Fig. 7a during the 1970s are generally less than those before the 1950s. Figure 7b shows averages from the more disturbed data, in which there is a less distinct annual cycle, and less variability.
The large PG values derived from 0a d have received attention previously. For example, in a short comparison between 1922 and 1930, the annual mean PG from the 0a classified days was greater than the mean PG found using disturbed days, from which only the positive values were used (OYB30, p. 159). Further, the large PG values occurring on 0a d could not be explained quantitatively by assuming likely local particulate air pollution (Harrison, 2004). To do so required conditions comparable with those at Kew, which had substantial smoke pollution. The Ebert data (Sect. 3.1) also indicated average ion concentrations in the early part of the record typical of a relatively unpolluted site (Sulo et al., 2022; Hõrrak et al., 2000).
To explore and resolve these inconsistencies, data from the different periods using the different classification methods are presented in Fig. 8, before and after the weapons contamination period. Figure 8a shows boxplots of the Eskdalemuir PG data classified as 0a, 1a2a, Fair Weather (FW) and No Hydrometeors (NH) cases. The median PG from the 0a classification is clearly greater than for the other cases, which have much more similar medians. The FW and NH data also show much less variability than for the 0a and 1a2a data. Comparing values from Lerwick where the same classifications were applied, Fig. 8b, there is less spread between the four categories than for the data from Eskdalemuir, with the 0a and FW data more comparable. Taken together, it appears that the 0a PG values at Eskdalemuir were generally much greater than those obtained under any other classifications, at either Lerwick or Eskdalemuir.
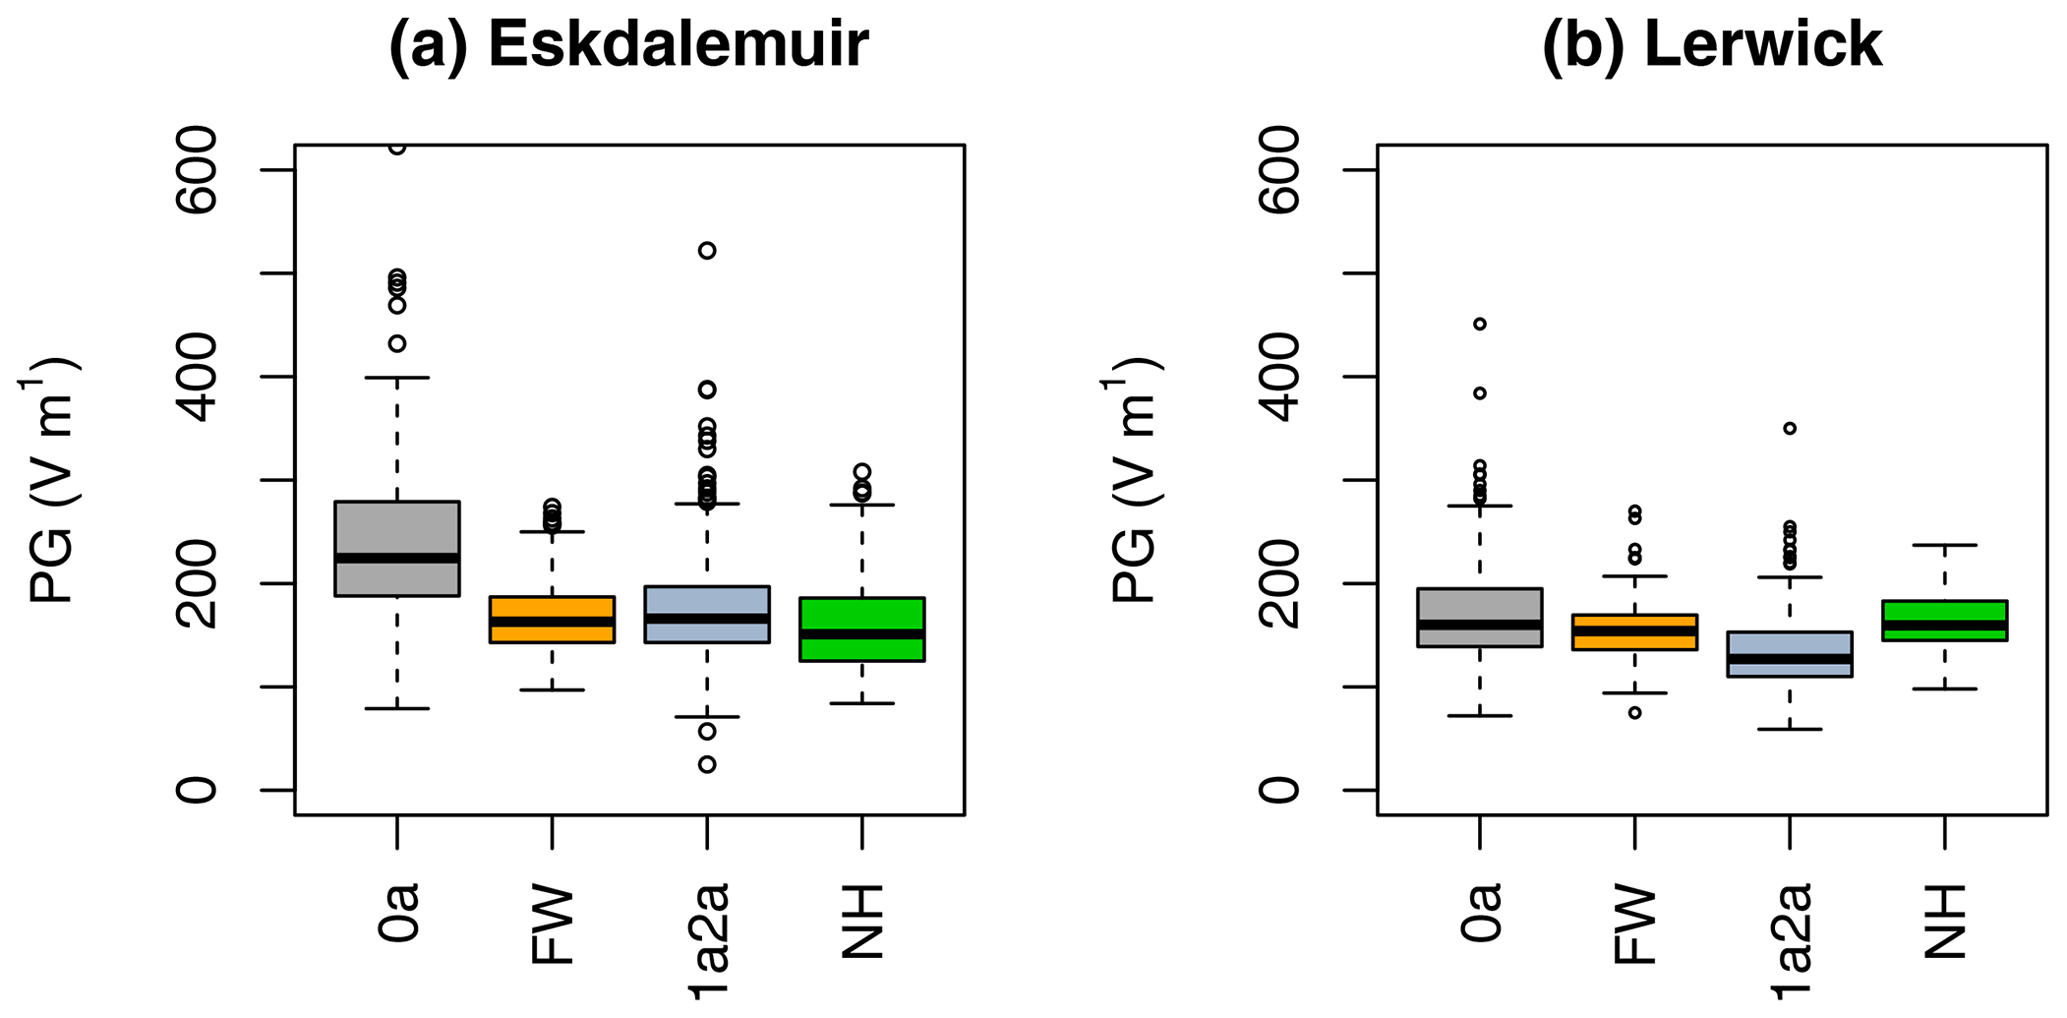
Figure 8Boxplots summarising monthly PG values using different data classifications. (a) Eskdalemuir values from “0a” and “1a2a” classification days (1911–1950) and Fair Weather (FW) or No Hydrometeor (NH) hours (1968–1981). (b) Lerwick values from “0a” and “1a2a” classification days (1927–1950) and Fair Weather (FW) or No Hydrometeor (NH) hours (1968–1984) (boxplots show medians as a solid line, inter-quartile range (IQR) as the size of the box, and whiskers to 1.5 IQR, with outliers beyond that) (Use of colours is consistent with Fig. 7.)
Considering this further, the 0a data selection method at Eskdalemuir chose, by definition, days on which there were no negative PG values from which to derive the monthly averages. This approach was purely based on the character of each day's electrogram. However, such days were not necessarily locally undisturbed meteorologically, as fog or mist could still occur which would increase the PG, positively. Unlike Lerwick, which is a more exposed site, calm conditions at Eskdalemuir could allow fog and mist to develop. The OYB contains occasional suggestions of anomalous effects associated with calm conditions. For example, from 15 to 23 January 1930, the PG varied between 500 and 1350 V m−1, associated with “calms or light airs”, giving a mean of 850 V m−1 (OYB30, p. 159). Further, on 15 January 1935 “During … fog the PG remained above 570 V m−1” but also, on 29 January 1935, “During … clear skies the PG remained above 550 V m−1” (OYB35, p. 70). If calm conditions or fog or mist occurred regularly and consistently, they would act to increase the 0a mean values, despite the intention to identify quiescent conditions. Local effects are consequently likely to have contributed additional variability, although global circuit influences would still emerge if the conditions of the days concerned were relatively consistent.17
4.2 Radioactive contamination
The period of weapons test contamination during the 1950s and early 1960s is apparent in both time series of Fig. 7. The effect arose from surface radioactivity deposition which increased the air conductivity and reduced the PG. A consistent behaviour was observed at several observatory sites internationally (Pierce, 1972). Figure 9a gives more detail of the annual changes at Eskdalemuir, together with those at Lerwick and Kakioka, Japan (Kamogawa et al., 2023). It is apparent that the Eskdalemuir changes around 1950 are proportionately greater than for the other two sites, and that the Eskdalemuir change begins to emerge from the typical variability slightly earlier.
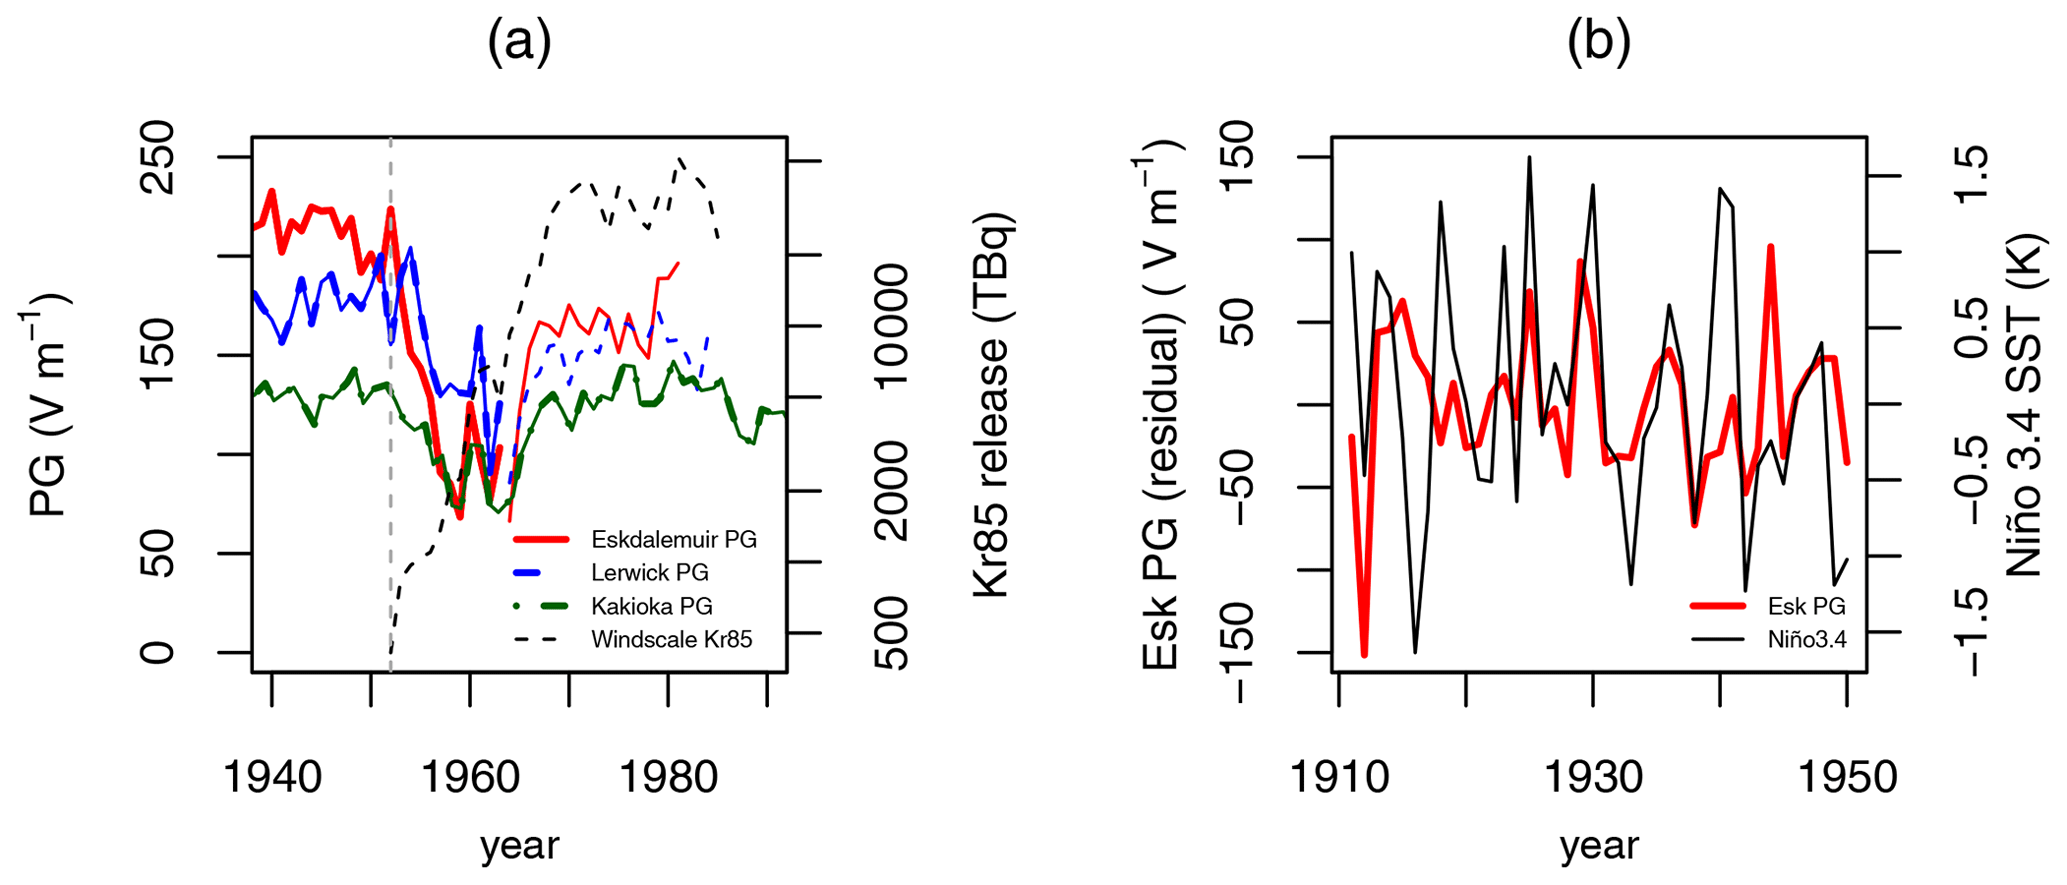
Figure 9(a) Time series of PG from Eskdalemuir (red lines), Lerwick (blue lines) and Kakioka (green lines), during 1940 to 1980, showing the detail of the weapons-testing period. The thin dashed line shows the 85Kr released from the Windscale nuclear reprocessing plant (right-hand axis), whose opening is shown with the vertical dashed line. (Data for Eskdalemuir and Lerwick come from “0a” d followed by FW days; Kakioka data show “calm days” throughout.) (b) Eskdalemuir “0a” PG for December only, detrended (red line) and December sea surface temperature (SST) anomalies from the HadSST1 dataset in the Pacific Ocean Niño 3.4 region (thin line), which covers the dateline to the South American coast (5° N to 5° S and 170 to 120° W).
One possible explanation for the earlier reduction in PG at Eskdalemuir, when compared with the other locations, would be an additional radioactive source, prior to the deposition from nuclear weapons testing. The possibility of a local source at Windscale (now known as Sellafield,18) was first suggested by Pierce (1958). To consider this, Figure 9a also includes estimates of krypton-85 emissions from Windscale, derived by Jackson et al. (1998). Although krypton-85 has been suggested to have possible direct effects on atmospheric electricity because of its atmospheric lifetime (Harrison and ApSimon, 1994), its use here is primarily as a proxy for other isotopes emitted at the same time. The initial emissions from Windscale therefore approximately coincided with the initial PG reductions at Eskdalemuir, so it remains possible that they are related, as the sites are only about 75 km apart with the prevailing wind direction transporting material from the southwesterly to the northeast. The effect of wind direction is important: no radioactivity was detected at Eskdalemuir following the Windscale fire of October 1957 (Stewart et al., 2020), as there was the additional complication of a weather front moving towards the southeast, with light winds limiting the northwards spread of the initial release (Crabtree, 1959).
4.3 El Niño–Southern Oscillation
A relationship is known to exist between sea surface temperature (SST) fluctuations in the Pacific Ocean, resulting from the El Niño–Southern Oscillation (ENSO), and distant measurements of PG. This occurs through modification of the convective regions which generate current flow in the global atmospheric electric circuit, as confirmed by the modelling of Slyunyaev et al. (2021). This effect was first identified in PG data from Lerwick in Decembers during the 1970s and later found for 1927–1954 at Lerwick (Harrison et al., 2011, 2022). The Eskdalemuir PG data provide, in principle, a longer period for comparison.
Figure 9b shows the mean PG at Eskdalemuir during December, between the beginning of measurements in 1911 and 1950, after which the sharp decrease in PG associated with radioactive contamination began. The SST anomalies are overlaid on the same graph. Some agreement is apparent, which improves after the initial period. The Spearman rank correlation is used to assess the correlation, as a linear response is not expected, and because of the non-linearities already identified in the 0a data considered. For the 40 annual values, the Spearman correlation is 0.41 (p< 0.02), which becomes 0.54 (p< 0.003) for just 1920–1950. (In both cases, the probability p of a chance correlation is found by allowing for persistence (Ebisuzaki, 1997).) This shows that the relationship between ENSO and the global circuit is present in the early part of the PG record, from 1911, prior to that identified at Lerwick.
Atmospheric electricity measurements were made from 1911 to 1981 at Eskdalemuir, with the PG data of value because of the global information potentially contained within. These measurements followed the systems and procedures which were already well established at Kew Observatory, as Eskdalemuir was intended as a replacement due to the operating conditions at Kew becoming increasingly unsuitable.
The operation of the Eskdalemuir electrograph is well documented in different sources, with attention to detail and reliable calibration of the PG measurements very evident throughout its operation. However, the classification method of the data in the pre-weapons-test period, i.e. before about 1957, seems to have been unsatisfactory. This approach selected days with solely positive values, applying existing geomagnetic analysis practices to atmospheric electricity data. A consequence of using this approach was the preferential selection of days on which the PG was enhanced due to local effects at the site, such as calm conditions or fog. Instead, by applying the FW/NH classification method on an hour-by-hour basis, these local meteorological effects were able to be removed. This improved selection approach was only implemented during the 1960s when there was also radioactive contamination present. Only after the decay of the contamination did the benefits of the new method become fully apparent in reducing the variability. Ideally, therefore, the hourly values prior to this change should be reclassified, using local meteorological data.
The atmospheric electricity aspects of the Eskdalemuir site have also been well characterised over a long time. Hence, as for the observatory at Lerwick, the PG data at Eskdalemuir are useful for studies of changes in the global circuit, and, as many of the original electrograms are still available, the possible evaluation of transient effects such as those induced by space weather changes.
The monthly PG data for Eskdalemuir are available at https://doi.org/10.17864/1947.000506 (Harrison et al., 2023a), Eskdalemuir ion measurements 1909–1916 are available at https://doi.org/10.17864/1947.000523 (Harrison, 2023), and data for Lerwick are available at https://doi.org/10.17864/1947.000505 (Harrison et al., 2023b). Scans of the annual volumes of the Observatories Year Book and the British Meteorological and Magnetic Year Book for Eskdalemuir are at http://www.geomag.bgs.ac.uk/data_service/data/yearbooks/esk.html (BGS, 2024). The Pacific Ocean temperature anomalies were obtained from https://climexp.knmi.nl/selectindex.cgi (Rayner et al., 2003; https://doi.org/10.1029/2002jd002670).
RGH drafted the initial manuscript with help from JCR. Both RGH and JCR revised the manuscript.
The contact author has declared that neither of the authors has any competing interests.
Publisher’s note: Copernicus Publications remains neutral with regard to jurisdictional claims made in the text, published maps, institutional affiliations, or any other geographical representation in this paper. While Copernicus Publications makes every effort to include appropriate place names, the final responsibility lies with the authors.
This article is part of the special issue “Atmospheric electrical observatories”. It is not associated with a conference.
The Met Office originally obtained the data discussed. Ian Dawson (Eskdalemuir Observatory) provided valuable assistance in the early part of this work. Karen Aplin encouraged submission of this paper for the Special Issue on “Atmospheric electrical observatories”.
This paper was edited by Kristian Schlegel and reviewed by two anonymous referees.
Anonymous: The National Physical Laboratory during 1908, Nature, 80, 109–111, https://doi.org/10.1038/080109a0, 1909.
Anonymous: The government laboratory polonium service, Nature, 4466, 965, https://www.nature.com/articles/175965b0.pdf (last access: 20 March 2024), 1955.
Anonymous: Notes and News – Kew Observatory, Meteorol. Mag., 109, p. 215, https://digital.nmla.metoffice.gov.uk/IO_1e31f585-2cd9-462c-98dd-d260faa4a3cc/ (last access: 20 March 2024), 1980.
Aplin, K. L. and Harrison, R. G.: Lord Kelvin's atmospheric electricity measurements, Hist. Geo Space. Sci., 4, 83–95, https://doi.org/10.5194/hgss-4-83-2013, 2013.
Benndorf, H.: Über ein mechanisch registrierendes elektrometer für luftelektrische messungen, Physische Zeitschrift, 7, 98–101, 1906.
BGS (British Geological Survey): Eskdalemuir Magnetic Observatory Yearbooks and Historical Articles, http://www.geomag.bgs.ac.uk/data_service/data/yearbooks/esk.html, last access: 20 March 2024.
Blackwell, M.: Eskdalemuir Observatory – the first fifty years, Meteorol. Mag., 87, 129–132, 1958.
Booth, D.: One hundred years at Eskdalemuir, Planet Earth, 32, https://geomag.bgs.ac.uk/documents/eskdalemuir_100years.pdf (last access: 24 November 2023), 2004.
Boys, C.V.: Obituary – G.W. Walker, Nature, 108, 188, https://doi.org/10.1038/108188a0, 1921.
Brewer, A. W.: An electrometer valve voltmeter of wide range, J. Sci. Instrum., 30, 91–92, https://doi.org/10.1088/0950-7671/30/3/308, 1953.
Chree, C.: Observations on atmospheric electricity at the Kew Observatory, P. Roy. Soc. London, 60, 359–367, https://doi.org/10.1098/rspl.1896.0021, 1897.
Chree, C.: A discussion of atmospheric electric potential results at Kew from selected days during the seven years 1898 to 1904, Philos. T. R. Soc. Lond., 206, 402–412, https://doi.org/10.1098/rsta.1906.0020, 1906.
Chree, C.: Atmospheric electricity II – A comparison of the years 1914, 1915, 1916 at Kew (Richmond) and Eskdalemuir Observatories, British Meteorological and Magnetic Year Book, 4, 85–86, 1916.
Collingbourne, R. H.: Kew – The National Radiation Centre, Meteorol. Mag., 98, 223–227, 1969.
Crabtree, J.: The travel and diffusion of the radioactive material emitted during the Windscale accident, Q. J. Roy. Meteor. Soc., 85, 362–370, https://doi.org/10.1002/qj.49708536605, 1959.
Crozier, W. D.: Measuring atmospheric potential with passive antennas, J. Geophys. Res., 68, 5173–5179, https://doi.org/10.1029/jz068i018p05173, 1963.
Dawson, I. K.: Eskdalemuir Observatory, Weather, 60, 66–69, https://doi.org/10.1256/wea.218.03, 2005.
Dobson, G. M. B.: A comparison of the electrical conditions of the atmosphere at Kew and Eskdalemuir, with notes on observations of atmospheric electricity made in other countries, in: Geophysical Memoirs, vol. 7, HMSO, London, 155–169, https://digital.nmla.metoffice.gov.uk/IO_b00b163b-3ff7-4749-82fa-8dd8cad911e3/ (last access: 20 March 2024), 1914.
Ebert, H.: Aspirationsapparat zur Bestimmung des ionen gehaltes der Atmosphäre, Physik Zeitschrift, 2, 662–664, 1901.
Ebisuzaki, W.: A method to estimate the statistical significance of a correlation when the data are serially correlated, J. Climate, 10, 2147–2153, https://doi.org/10.1175/1520-0442(1997)010<2147:AMTETS>2.0.CO;2, 1997.
Everett, J.: Results of observations of atmospheric electricity at Kew Observatory, and at King's College, Windsor, Nova Scotia, Philos. T. R. Soc. Lond., 158, 347–361, https://doi.org/10.1098/rstl.1868.0012, 1868.
Galton, F. J.: Report of the Kew Observatory Committee for the year ending December 31, 1899, P. R. Soc. London, 66, 424–433, https://doi.org/10.1098/rspl.1899.0115, 1900.
Harrison, G.: Atmospheric electricity at Durham, Weather, 73, 82–83, https://doi.org/10.1002/wea.3197, 2018.
Harrison, G. and Bennett, A.: Electricity measurements, in: Handbook of Atmospheric Measurements, edited by: Foken, T., Springer Nature, Switzerland, 431–456, https://doi.org/10.1007/978-3-030-52171-4_14, 2022.
Harrison, R. G.: Long-term measurements of the global atmospheric electric circuit at Eskdalemuir, Scotland, 1911–1981, Atmos. Res., 70, 1–19, https://doi.org/10.1016/j.atmosres.2003.09.007, 2004.
Harrison, R. G.: Electrical properties of surface atmospheric air at Eskdalemuir, 1909–1911, Atmos. Res., 84, 182–188, https://doi.org/10.1016/j.atmosres.2006.08.001, 2007.
Harrison, R. G.: Eskdalemuir ion measurements 1909–1916, University of Reading [data set], https://doi.org/10.17864/1947.000523, 2023.
Harrison, R. G. and ApSimon, H. M.: Krypton-85 pollution and atmospheric electricity, Atmos. Environ., 28, 637–648, https://doi.org/10.1016/1352-2310(94)90041-8, 1994.
Harrison, R. G. and Nicoll, K. A.: Fair weather criteria for atmospheric electricity measurements, J. Atmos. Sol.-Terr. Phys, 179, 239–250, https://doi.org/10.1016/j.jastp.2018.07.008, 2018.
Harrison, R. G. and Riddick, J. C.: Atmospheric electricity observations at Lerwick Geophysical Observatory, Hist. Geo Space. Sci., 13, 133–146, https://doi.org/10.5194/hgss-13-133-2022, 2022.
Harrison, R. G., Joshi, M., and Pascoe, K.: Inferring convective responses to El Niño with atmospheric electricity measurements at Shetland, Environ. Res. Lett., 6, 044028, https://doi.org/10.1088/1748-9326/6/4/044028, 2011.
Harrison, R. G., Nicoll, K. A., Joshi, M., and Hawkins, E.: Empirical evidence for multidecadal scale global atmospheric electric circuit modulation by the El Niño-Southern Oscillation, Environ. Res. Lett., 17, 124048, https://doi.org/10.1088/1748-9326/aca68c, 2022.
Harrison, R. G., Nicoll, K. A., and Mkrtchyan, H.: Eskdalemuir Observatory monthly mean Potential Gradient 1911–1981, University of Reading [data set], https://doi.org/10.17864/1947.000506, 2023a.
Harrison, R. G., Nicoll, K. A., and Mkrtchyan, H.: Lerwick Observatory monthly mean Potential Gradient 1925–1984, University of Reading [data set], https://doi.org/10.17864/1947.000505, 2023b.
Hatakeyama, H.: On Benndorf's Self-recording Electrometer, J. Meteorol. Soc. Jpn., 12, 501–510, 1934.
Hõrrak, U., Salm, J., and Tammet, H.: Statistical characterization of air ion mobility spectra at Tahkuse Observatory: Classification of air ions, J. Geophys. Res.-Atmos., 105, 9291–9302, https://doi.org/10.1029/1999JD901197, 2000.
Jackson, D., Zimmerman, C. H., and Gray, J.: Discharges of krypton from Sellafield, 1951-1997, and the resultant doses to members of the public, J. Radiol. Prot., 18, 111–118, https://doi.org/10.1088/0952-4746/18/2/006, 1998.
Kamogawa, M., Suzuki, T., Minamoto, Y., Nagao, T., Kodama, T., Fujiwara, H., and Kudo, T.: Continued atmospheric electric field measurements following cessation of the long-term water dropper potential equalizer at Kakioka, Japan, Geosci. Data J., 1–9, https://doi.org/10.1002/gdj3.224, online first, 2023.
Lynch, P.: The Emergence of Numerical Weather Prediction: Richardson's Dream, Cambridge University Press, Cambridge, ISBN-10 0521857295, 2006.
Macdonald, L. T.: Kew Observatory and the Evolution of Victorian Science, 1840–1910, University of Pittsburgh Press, https://doi.org/10.2307/j.ctv1fxmdj, 2018.
Nagamachi, S., Arita, S., and Hirota, E.: Historical data of atmospheric electric field observations in Japan, Geosci. Data J., 10, 45–62, https://doi.org/10.1002/gdj3.143, 2023.
Pierce, E. T.: Some topics in atmospheric electricity, in: Recent Advances in Atmospheric Electricity, Proceedings of the Second Conference on Atmospheric Electricity, Portsmouth, New Hampshire, 20–23 May 1958, Pergamon Press, 5–16, 1958.
Pierce, E. T.: Radioactive fallout and secular effects in atmospheric electricity, J. Geophys. Res., 77, 482–487, https://doi.org/10.1029/jc077i003p00482, 1972.
Rayner, N. A., Parker, D. E., Horton, E. B., Folland, C. K., Alexander, L. V., Rowell, D. P., Kent, E. C., and Kaplan, A.: Global analyses of sea surface temperature, sea ice, and night marine air temperature since the late nineteenth century, J. Geophys. Res.-Atmos., 108, 4407, https://doi.org/10.1029/2002jd002670, 2003 (data available at: https://climexp.knmi.nl/selectindex.cgi, last access: 20 March 2024).
Richardson, L. F.: Notes on the electrograph at Eskdalemuir for 1913 and 1914, British Meteorological and Magnetic Year Book, 79–80, 1914.
Slyunyaev, N. N., Ilin, N. V., Mareev, E. A., and Price, C. G.: A new link between El Nino – Southern Oscillation and atmospheric electricity, Environ. Res. Lett., 16, 044025, https://doi.org/10.1088/1748-9326/abe908, 2021.
Stewart, N. G., Crooks, R. N., and Fisher, E. M. R.: Measurements of the radioactivity of the cloud from the accident at Windscale Works (Sellafield, England) in October 1957: Data submitted to the International Geophysical Year (IGY; July 1957-December 1958), J. Radiol. Prot., 40, 633, https://doi.org/10.1088/1361-6498/ab70cc, 2020.
Sulo, J., Lampilahti, J., Chen, X., Kontkanen, J., Nieminen, T., Kerminen, V.-M., Petäjä, T., Kulmala, M., and Lehtipalo, K.: Measurement report: Increasing trend of atmospheric ion concentrations in the boreal forest, Atmos. Chem. Phys., 22, 15223–15242, https://doi.org/10.5194/acp-22-15223-2022, 2022.
Walker, G.: Notes on the Electrograph at Eskdalemuir, in: British Meteorological and Magnetic Yearbook, 84–85, https://geomag.bgs.ac.uk/data_service/data/yearbooks/YBpdf/YB_ESKKEW_1911b.pdf (last access: 20 March 2024), 1911.
Walker, G. W.: Eskdalemuir Observatory. Introduction to the summaries of results of the observatory for the year 1910, in: Summaries of results of geophysical and meteorological observations in the year ended 31st December 1910, W. F. Parott, Teddington, 40–42, https://geomag.bgs.ac.uk/data_service/data/yearbooks/YBpdf/YB_ESKFALKEW_1910.pdf (last access: 20 March 2024), 1910.
Walker, M.: History of the Meteorological Office, Cambridge University Press, Cambridge, https://doi.org/10.1017/CBO9781139020831, 2011.
OYByy and BMMYyy in the text refer to an annual volume of the Observatories Year Book or British Meteorological and Magnetic Year Book for the year 19yy.
Albert Gendle (1886–1923), scientific assistant at Eskdalemuir 1908–1913, later in charge of the RAF meteorological service, killed in Baghdad in 1923.
The remote parish of Eskdalemuir is said to have been selected originally by rolling a sixpence around a UK rail map. The coin's size and the scale of the map allowed a site 10 mi (16 km) from possible disturbances to be identified (Booth, 2004).
George W. Walker FRS (1874–1921) seismologist and leader of British Isles magnetic survey (Boys, 1921).
Gordon Miller Bourne Dobson FRS (1889–1976), meteorologist, experimental physicist and climatologist at the University of Oxford, after whom the Dobson unit of stratospheric ozone is named.
Lewis Fry Richardson FRS (1881–1953), mathematician and pioneer of numerical weather forecasting (see also Lynch, 2006). He resigned from the Met Office in August 1916, to join the Friends Ambulance Unit in Flanders (Walker, 2011).
Group Captain James Stagg (1900–1975), weather forecaster to Dwight D. Eisenhower for D-Day (June 1944).
Alexander Crichton Mitchell (1864–1952), geomagnetic physicist and meteorologist and inventor of the “indicator loop” for submarine detection.
A water dropper equaliser continued in use at Kakioka Magnetic Observatory until February 2021 (Nagamachi et al., 2023).
For example, the Kew electrograms were lent to Charles Thomson Rees, “CTR”, Wilson in Cambridge (Galton, 1900).
The PG is equal to −Ez, where Ez is the vertical atmospheric electric field. In fine and undisturbed conditions – “Fair Weather” – the PG is positive.
Radioactive sources were used in atmospheric electricity with radiological safety considerations now unrecognisable, possibly with tragic consequences for frequent users (Harrison, 2018). Different approaches with improved electronics have entirely removed the need for radioactivity (Harrison and Bennett, 2022).
Stretched wires can be used with or without additional radioactive or burning fuse equalisers. In the absence of an equaliser, stretched wires slowly acquire the local potential when local turbulence is sufficient to provide the exchange of charge, and they are referred to as “passive antennas” (Crozier, 1963).
This was initially situated at Kew and later at Beaufort Park.
This early implementation of digital technology was not without its trials. One of the authors (JCR) recalls how whenever a paper tape spool became tangled, due to the centre falling out, it would be taken to the tower of the observatory and dropped over, to allow it to be rewound by hand.
“Fair Weather” for atmospheric electricity purposes was defined as circumstances having no hydrometeors, no low stratus cloud, less than three-eighths cumuliform cloud and mean hourly wind speed less than 8 m s−1 (Harrison and Nicoll, 2018).
This is possibly apparent in Fig. 3a of Harrison (2004), which demonstrated a correlation between the Eskdalemuir PG and simultaneous PG measurements made on the Carnegie in the Atlantic over 5 d in September 1928. The variability and mean values in the time series differ.
Windscale was renamed Sellafield in 1981.