the Creative Commons Attribution 4.0 License.
the Creative Commons Attribution 4.0 License.
 | 08 Jul 2024
Conjugate aurora observations by the Gjøa and Discovery expeditions
Alv Egeland
From 1901 to 1912 – known as the “heroic period” of Arctic and Antarctic exploration – great inroads were made (not only geographic but also scientific) to our knowledge of the continent. At Amundsen's Expedition through the Northwest Passage, measurements of the geomagnetic field and visual auroras were carried out for 19 months at Gjoa Haven (Gjøahavn in Norwegian; geographic coordinates 68°37′10′′ N, 95°53′25′′ W). Scott's Discovery Expedition – at Cape Armitage, McMurdo (coordinates 77.86° S, 166.69° E), Antarctica – carried out the same type of measurements. Their observations were carried out geomagnetically conjugate to Gjoa Haven, with both stations close to 78° magnetic latitude. In addition, measurements were overlapping in time during 1903–1904. However, these two stations are located at different longitudes, so there is a difference in local time between the stations of about 6.5 h. Gjoa Haven and Cape Armitage are conveniently located for separating disturbances in the polar cap regions caused by solar electromagnetic radiations or the solar wind.
Auroras were observed during 7 months per year. This gave a unique possibility to compare conjugate characteristics of polar cap auroras. Comparing conjugate geophysical data introduces some difficulties. During the winter season at Gjoa Haven, they had a bright summer in Antarctica, and visa versa. Thus, simultaneous temporal and spatial ionospheric variations can be marked differently. Still, the average diurnal and seasonal variations were similar. The quantity of the auroral data from Cape Armitage was larger because there they had a continuous watch of the sky.
The main findings regarding polar cap auroras are the following. Three different auroral forms dominate the polar cap. Low-intensity auroral bands – then called streamers – were the dominating auroral forms morning and afternoon. The number of auroral events in 1903 was nearly twice that in 1902 and 1904. A marked midwinter maximum was observed at both stations. Many displays were observed poleward of the oval. The large fraction was associated with weak magnetic disturbances.
Some forms of polar cap aurora have special magnetic signatures and seem to be anti-correlated with Kp. They can be mapped even if they are not seen. According to recent satellite measurements (Newell et al., 2009), they are probably caused by polar rain and/or photoelectrons.
- Article
(5455 KB) - Full-text XML
- BibTeX
- EndNote


During the first decade of the 1900s – known as the “heroic era” of Arctic and Antarctic exploration – new inroads were made to the continent (cf. Huntford, 1982; Barraclough and Malin, 1981; Silverman and Smith, 1994; Egeland and Deehr, 2014). Roald Amundsen (1872–1928) and Robert F. Scott (1868–1912) led expeditions, pioneering geological, glaciological, and meteorological discoveries. During Amundsen's Gjøa Expedition through the Northwest Passage, measurements of the Earth's magnetic field (Graarud and Russeltvedt, 1928) and aurora were carried out at Gjoa Haven (GH) on King William Island (previously King William Land; geographic coordinates 68°37′10′′ N, 95°53′25′′ W) for 19 months. The data have now – for first time – been analyzed based on what we have learned during the space age.
During this work, it was discovered that Scott's Discovery Expedition to Cape Armitage (CA), McMurdo (coordinates 77.86° S, 166.69° E), in Antarctica, carried out the same type of measurements and that there was an overlapping time with those measurements at GH during 1903–1904. New calculations showed that Cape Armitage was nearly geomagnetically conjugate to Gjoa Haven at 78° magnetic latitude. This gave us a unique possibility to compare conjugate polar cap auroras.
The Gjøa and Discovery expeditions
Amundsen's and Scott's knowledge of geomagnetism and auroral physics was limited, but Amundsen at least lay the groundwork for serious scientific observations when preparing the expedition. His main mentor was the deputy director of the Norwegian Meteorological Institute in Oslo, Dr. Axel S. Steen, and he also met with Professor Kristian Birkeland (1867–1917). In addition, he cooperated with two German experts, Professor Georg von Neumayer in Hamburg, director of the Deutsche Seewarte institute, and Professor Adolf Schmidt at Potsdam Observatory. Together with one of his crew, they made three trips to Hamburg and Potsdam, Germany. He also traveled to Birkeland's observatory at Bossekopp, in Northern Norway, to learn about geophysical observations. His diary from this expedition (Kløver, 2017b; Egeland and Deehr, 2014) contains some interesting auroral observations and comments regarding the connections between auroras and geomagnetic disturbances.
Scott's science background and interests for space physics were less. As far as we have found, he never looked over the data. Scientists at the Royal Academy in London were responsible for both the field measurements and the first preliminary presentation (cf. Chree, 1909; Bernacchi, 1908).
As Fig. 1 shows, Scott's Discovery Expedition at CA was located conjugate to GH, but there is a difference in local solar time between the stations of about 6.5 h. Because of this location, disturbances caused by solar electromagnetic radiations or the solar wind can be separated.

Figure 1The figure shows the Earth's magnetic field coordinates at the surface superimposed on a map of the world in rectilinear geographic coordinates. The magnetic longitude – the numbers with the degree mark – is given in degrees east from the point where it intersects the Greenwich meridian. The magnetic latitude close to the poles is also given in “L values”. These are integer numbers in Earth radii of the distance from the center of the Earth to the point where the field line intercepts the geomagnetic equator (Egeland and Deehr, 2014).
For interpretation of auroral observations, it was discovered (around 1950) that it was an advantage to use a coordinate system based on the geomagnetic field and magnetic time. Such a system is briefly presented.
The Earth's magnetic latitudes and longitudes are referred to as a system with the z axis along the geomagnetic dipole axis through both magnetic poles, which is inclined 11° from the geographic pole in the Northern Hemisphere, and the 180° longitude – also called the geomagnetic meridian – goes through both the geomagnetic and the geographic north pole. The latitude circles from 0–90° north (N) and south (S) are perpendicular on the geomagnetic meridians.
Local solar time (LT) is defined by the location of the geographic longitude of the station with respect to the Sun, while universal time (UT) is referred to as a geographic system with the zero meridian through Greenwich. At local noon and midnight UT, the longitude of the observer is aligned with the Sun and the geographic 0 and 180° meridian through the geographic pole.
We here compare observations from stations in opposite hemispheres. So rather than consider the station in the Southern Hemisphere as 11 h ahead of Greenwich (UT), we refer to this station as 13 h behind in UT and 6.5 h behind GH, which itself is 6.5 h behind in UT.
The intensity and the direction of the Earth's magnetic field is continuous but slowly changing. Based on a new geomagnetic reference field (1969.75 IGRF, International Geomagnetic Reference Field), the geographic and geomagnetic coordinates for years 1905 and 1970 for the two stations have been recalculated. These calculations show that the magnetic coordinates of CA and GH have changed less than 2° west in longitude (10 min) and 0.25° in latitude (equivalent to ∼ 25 km) relative to one another from 1900 to 1970.
Table 1A list of UT, local solar times, magnetic midnight (MdNt), magnetic noon, and average auroral substorm (SS) onset for the two observatories (Egeland and Deehr's, 2024, private archive).
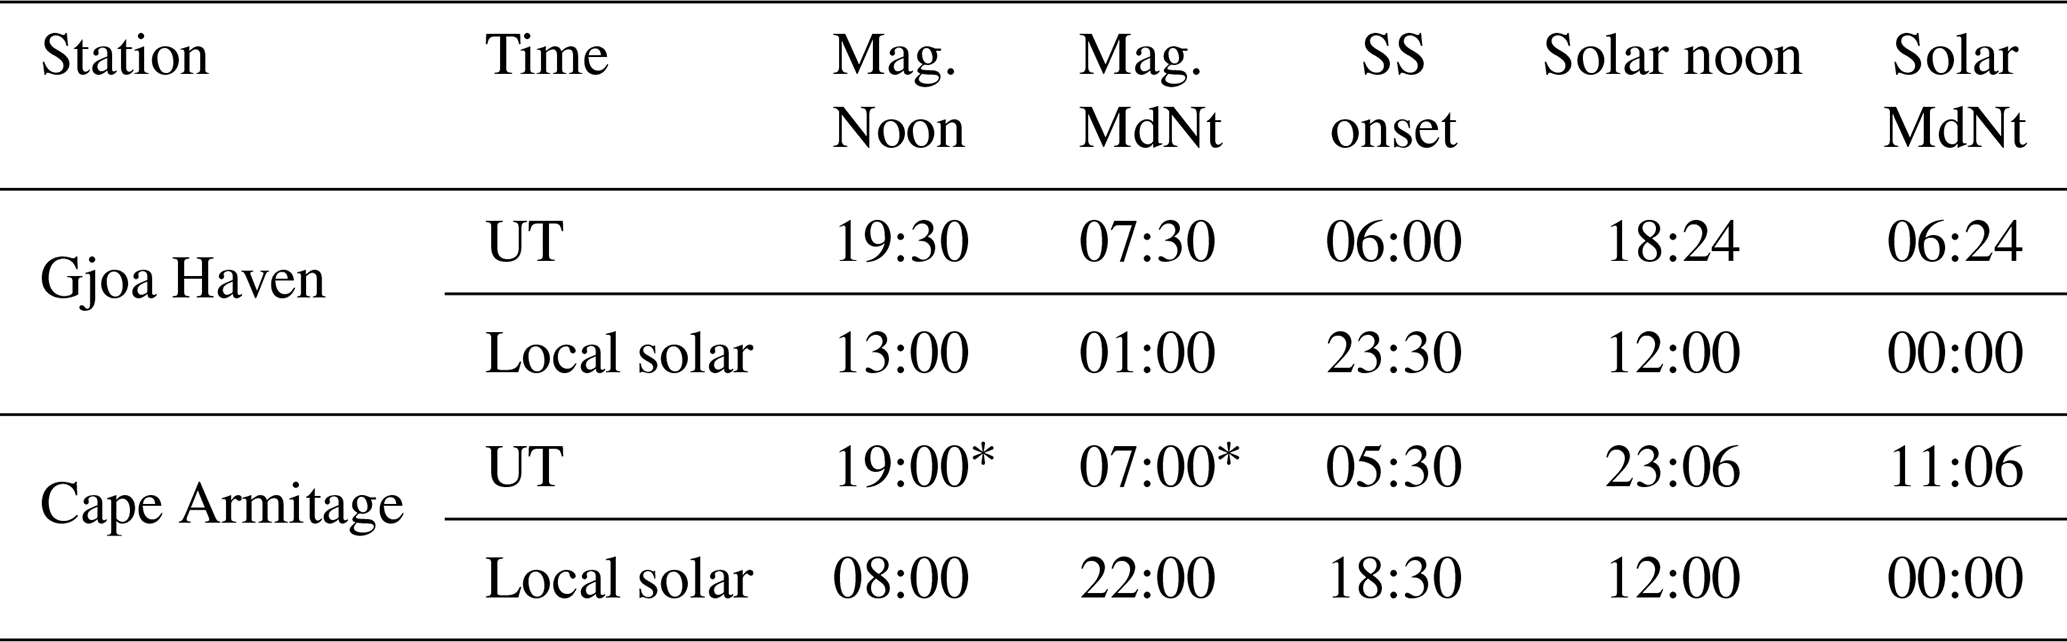
* The station Cape Armitage may be 15 to 60 min east of Gjoa Haven in magnetic time.
Magnetic midnight and noon are the local times when the station passes through the plane containing the Sun and the geomagnetic pole at night and day, respectively. Thus, magnetic midnight occurs near 07:30 UT and at 01:00 local time (LT). The most dynamical changes and poleward expansion in the auroral zone normally occurs between 22:00 MLT and magnetic midnight.
Around 1900, the study of aurora was still an emerging science. The main question at that time was the relationship between the aurora and magnetic disturbances (Birkeland, 1908, 1913).
In his lecture to the Norsk Geografisk Selskap (Norwegian Geographical Society), on 25 November 1901, Amundsen (1902) presented his plan for “The Voyage Through the North West Passage” (Kløver, 2017a, b).
Amundsen had read Sophus Tromholt's (1885) book, Under the Rays of the Northern Lights and had visited Birkeland in his famous Terrella laboratory at the university. Nansen's (1897) drawings of northern lights from the Fram Expedition were well known. Auroral observations at those high latitudes were unprecedented.
Auroras around the 19th century were mainly subject to observations with the naked eye – i.e., visual observations. The pragmatist Amundsen included auroral observations before bedtime in his daily station activities.
Some basic new auroral facts learned during the space age will briefly be mentioned. Spacecraft – after 1960 – gave us the opportunity to explore space between the Earth and the Sun with in situ observations. With Explorer 1, launched in 1961, the first measurements across the near-Earth space – called the magnetosphere – were carried out. Interplanetary space, not long ago believed to be empty of matter, was filled with streaming electrons and ions of solar origin. These streaming particles, called the solar wind, were for the first time observed during the 1960s. The solar wind is the important connecting link between solar activity and geophysical disturbances. The interplanetary magnetic field (IMF) is an extension of the solar magnetic field carried by the solar wind as the plasma leaves the Sun (Kivelson and Russell, 1995).
The map in Fig. 3 illustrates the location of GH observatory relative to both the geographic and the magnetic north pole, the Arctic Circle, and the location of the new auroral station at Spitsbergen.
Auroral occurrences before the space age were normally referred to as the Fritz' (1881) auroral zone, with maximum around 67° magnetic latitude or 23° from the magnetic poles. The Gjoa Haven station is located close to 78° magnetic latitude.
Observations were carried out from late September to early March by Peter Ristvedt (Kløver, 2017b). Ristvedt's original auroral handwritten notebook is not easy to read, but Graarud (1932) translated his notes into English, word for word. The first page in Graarud's version – out of four – is shown in Fig. 2. Amundsen reported 15 events in his diary (Kløver, 2017b) in addition to those listed by Ristvedt.

Figure 2One page of auroral collection at Gjoa Haven (Gjøahavn) is shown. Important events – year, dates, and times – are briefly commented on in the text. From Graarud (1932).

Figure 3A map of the Arctic region where the locations of Gjoa Haven and the magnetic and the geographic poles are marked (from Egeland and Deehr's, 2024, private archive).
No official classification of different auroral forms existed then. The first aurora atlas was not published before 1930, by Størmer (1930, 1955). All data from this expedition are stored by Videnskabs-Selskabets (1920).
The following terms were used in the auroral protocol:
-
“streamers/strips”, which have been taken to mean active auroral rays;
-
“band(s)”, which seem to be a common name for both arcs and bands;
-
“crown”, which is interpreted as corona;
-
“auroral clouds”, which are interpreted as large surfaces of lights;
-
“auroral patches”; this form is not defined but is probably like clouds but smaller.
Words such as “auroral fire”, “flaming auroras”, or “flickering streamers” of lights are also listed in the original protocol.
Amundsen shows scientific effort for the observing program, but few recordings are included in his book The Northwest Passage (Amundsen, 1908), except the once connected with the drift of the magnetic north pole since Ross' (1834) measurements in 1831. They are further summarized in his lecture at the Royal Geographic Society, London, on 11 February 1907 (Amundsen, 1908).
However, Amundsen appointed a committee consisting of Dr. Aksel S. Steen, deputy director at the Norwegian Meteorological Institute, as chairman, while Dr. Karl Falk Wasserfall and the meteorologist Nils Russeltvedt were the other two members. In fact, the editing and preparation of the observations were not complete until 1933 (Steen et al., 1933). Northern lights poleward of the auroral zone are called polar cap auroras. Hardly any documentation of this type of aurora existed when these expeditions were carried out. As a clever expedition leader, Captain Amundsen knew the value of keeping day-to-day records. However, the instructions indicate that visual monitoring of aurora did not have the highest priority. Fortunately, the detailed diaries of the crew members have now been published (Kløver, 2009, 2016, 2017a, b, c).
The dataset has limitations because (1) observations were not carried out around the clock, (2) no illustrations or sketches exist, and (3) the available descriptions are scanty. During the epic voyage through the rest of the Northwest Passage to Alaska, they also observed some displays, but they are not included here.
Scientific results of the Gjoa Haven auroral observations
The text for the first event on 4 November 1903 is “Streamers of northern lights from southeast (SE) to the zenith (Z) were seen in the early local evening (from 5 pm.)”. In Amundsen's diary (p. 124), it is listed that the temperature was −25 °C, and he “saw northern lights from early afternoon. They appear as a semi-circular formation approximately 30° above the southern horizon. Five rays stretched to the zenith from the semi-circular formation. The rays came and disappeared, intermittently. These lasted about a quarter of an hour and then disappeared. I also saw a fan-shaped cloud to the NW”. The magnetic record for 4 to 5 November is shown in Fig. 5.
This event is illustrated in Fig. 4. The regular oval auroral −30° above the southern horizon, together with three arcs stretching poleward from the oval, are shown.

Figure 4This is a schematic illustration of the aurora on 4 November 1903 at GH, in magnetic time (MLT) and magnetic latitude (MLAT), covering the region from the magnetic pole (MP) to 70° north. The viewing perspective is the polar upper atmosphere with the oval – in yellow–green, from 06:00, via noon to 18:00 MLT. The direction to the Sun is up in the figure. The location of GH is marked. Three reddish Sun-aligned polar arcs stretching from the oval past the zenith are shown. From Egeland and Deehr's (2024, private archive).

Figure 5The magnetic field recordings – as a function of time in UT – from 4 to 5 November 1903. The three curves – marked Z, H, and D – illustrate the vertical, the horizontal, and the declination components of the magnetic field. The upper curve shows the temperature in the recoding hut and the baseline, while the bottom curve gives the hours. The vertical scale illustrates the magnetic intensity in nT. The photosensitive paper used for the recordings was changed daily near 06:00 UT, i.e., near magnetic noon. Notice that the magnetic activity is very low around magnetic midnight. The original magnetogram has been redrawn to show more details including magnetic noon and midnight. From Egeland and Deehr's (2024, private archive).
Thus, this auroral event started before magnetic noon. When the intensity of the lights changed rapidly and moved poleward, some small magnetic disturbances were recorded, as shown in Fig. 5.
The mistake of identifying an auroral event as a fire indicates that these “luminous beams” had a marked reddish color. The emperor Tiberius, in the year 37 CE, ordered a troop of solders to rescue the village of Ostia which was reported to be on fire. It was an unusual fire seen from large distance, which was “an auroral fire”. There are a few more recent examples of “auroral fires”. The one reported from London on 15 September 1839, when the whole sky was one vast sheet of reddish light, is well documented. It had a most alarming appearance.
An “auroral fire” was also reported at GH. According to Amundsen – p. 134 in the diary – the northern lights on 14 November lasted past midnight. This event was observed by the crew who were out reindeer hunting. The temperature was −20 °C. On their return, they saw a big reddish display in the sky and were afraid the whole camp was on fire.
We saw the luminous beam above the lodge and believed that the camp was on fire, but reaching the top of the hill, we discovered the light to be aurora. It had the shape of a large fire on the ice between us and the horizon. Near midnight aurora was sending up streamers toward zenith.
Northern lights were also observed on 18 and 20 November, as well as on 22 and 23 November, but without magnetic activity.
During the first Christmas Eve, “a strong band of northern lights ∼ 30° above the southern horizon” was seen. In addition, streamers of lights reaching the zenith were observed. This is an event like the one mentioned on 4 November. The activity lasted from early afternoon to after local midnight. Amundsen was surprised – p. 151 in diary – as he wrote: “The strong aurora I saw at Christmas was almost with no geomagnetic disturbances”. Regarding the auroral event he wrote: “Very strong aurora as streamers SW–NE though zenith is seldom. Later in the afternoon, strong auroras were seen near zenith. Several larger and smaller spots in lively motion with hardly any magnetic disturbances”.
In the diary on p. 172, Amundsen wrote: “We saw active northern lights over the whole sky on 8 February 1904 and it lasted three days. They seem to come from all directions. Around midnight the lights spread over a large part of the sky, and faint auroras were even seen all up to the north”. No auroras were seen in the south. Strongest auroras in the western horizon with poleward moving up to zenith are mentioned. They appear one moment and disappear the next. As the rays were deep reddish, it may indicate an observation of Sun-aligned arcs. The arcs were most clearly seen on the darker eastern part of the sky. These observations were carried out 2 h before magnetic midnight. The day after, Amundsen wrote: “The northern lights I observed yesterday have slightly disturbed magnetic activity”.
February 1905 was also an active period with auroras 5 d in a row. For one event, the text is “Aurora in SE to NW, brisk motions, sometimes dispersed over the entire sky and with much deeper colors”.
The last observation from Gjoa Haven is on 2 March 1905. “Aurora is seen all over the entire sky from a strongly bright pavilion in zenith.”
The total numbers of nights per month and year when auroras were observed are shown in Table 2.
Table 2Total number of auroras per month and year observed at Gjoa Haven. The events reported in the diaries by all crew members have been included. Thus, this table is different from the one by Graarud (1932).
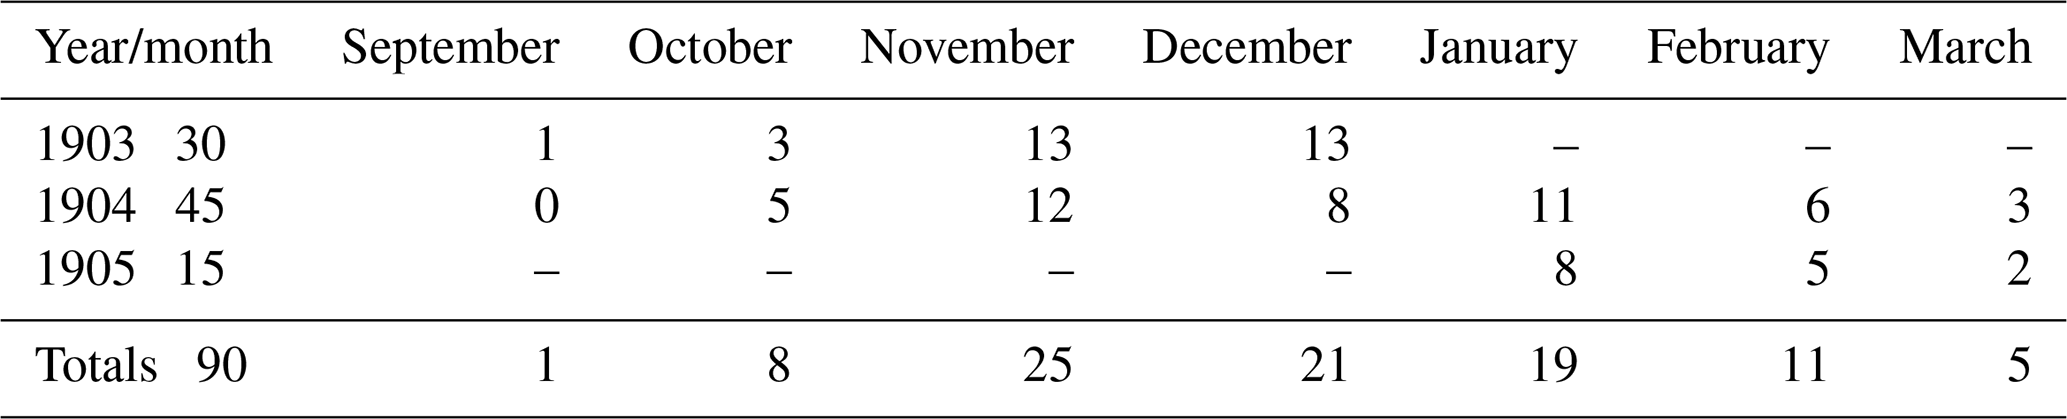
Ninety events were recorded. The overwhelming number of events were of moderate or low intensity; 26 out of 90 events extended to zenith. Only on 7 of the 90 events was color listed. The most dynamical changes and poleward expansions of auroras normally occurred between 22 h MLT (cf. Sect. 6.2) and magnetic midnight. Polar cap auroras were visible from magnetic noon in December, i.e., from 13:00 LT, but few observations were listed after 15:00 LT.
The observations were led by Bernacchi (1908) but carried out around the clock by “the meteorologist on duty with a check every hour”. Dr. Louise Bernacchi was called up when significant, large auroral sightings were observed. Even if the observers were at outlook for 24 h d−1, the conclusion is “still some faint or moderate bright auroras might have failed to be noted”. A similar auroral classification as at GH is used. Regarding auroral intensity, the conclusion is: “Their brilliances were rarely more intense than stars of the 4th magnitude or the Milky Way”.
Luminous patches are mentioned – sometimes small and at other times occupying almost the whole sky, which frequently looks like the appearance of clouds. Streamers are often listed and can represent different forms. Several vertical rays close together, similar to the form by Størmer (1930) called “draperies” are mentioned. Spectral observations were tried, but no results were reported, even if long time integration was tried.
Arcs and bands touching the horizon at both ends were rarely seen. The auroras were particularly visible during the dark Moon periods. During exceptional extensive displays, Dr. Louise Bernacchi called Edward A. Wilson, the expedition junior surgeon who also was an artist, to clearly see the largest displays. Wilson contributed with two dozen charcoal drawings of aurora australis. From these sorties, one is shown in Fig. 7.
The year 1903 was special with the strongest magnetic storms on 31 October during that century. It is interesting to notice that a similar series of storms – called the Halloween storms – were recorded 100 years later. Is it just a coincidence?
Scientific results of the auroral observations at GH and CA
Two main objectives are achieved by submitting the GH and CA data to modern analysis: firstly, to compare these old data – both in quality and accuracy – with those observed late in the 20th and early in the 21st century, and secondly, to check the Sun and solar wind activity as well as its influence on the Earth several decades before these processes were directly discovered.
Since the 1950s, auroral observations have been carried out continuously at many auroral observatories, and the statistical locations of the auroral ovals have been safely established. Its location – both north and south – for moderately disturbed conditions – Kp = 2 and different local times – is shown in Fig. 6. The red sector of the oval illustrates when daytime auroras dominate.
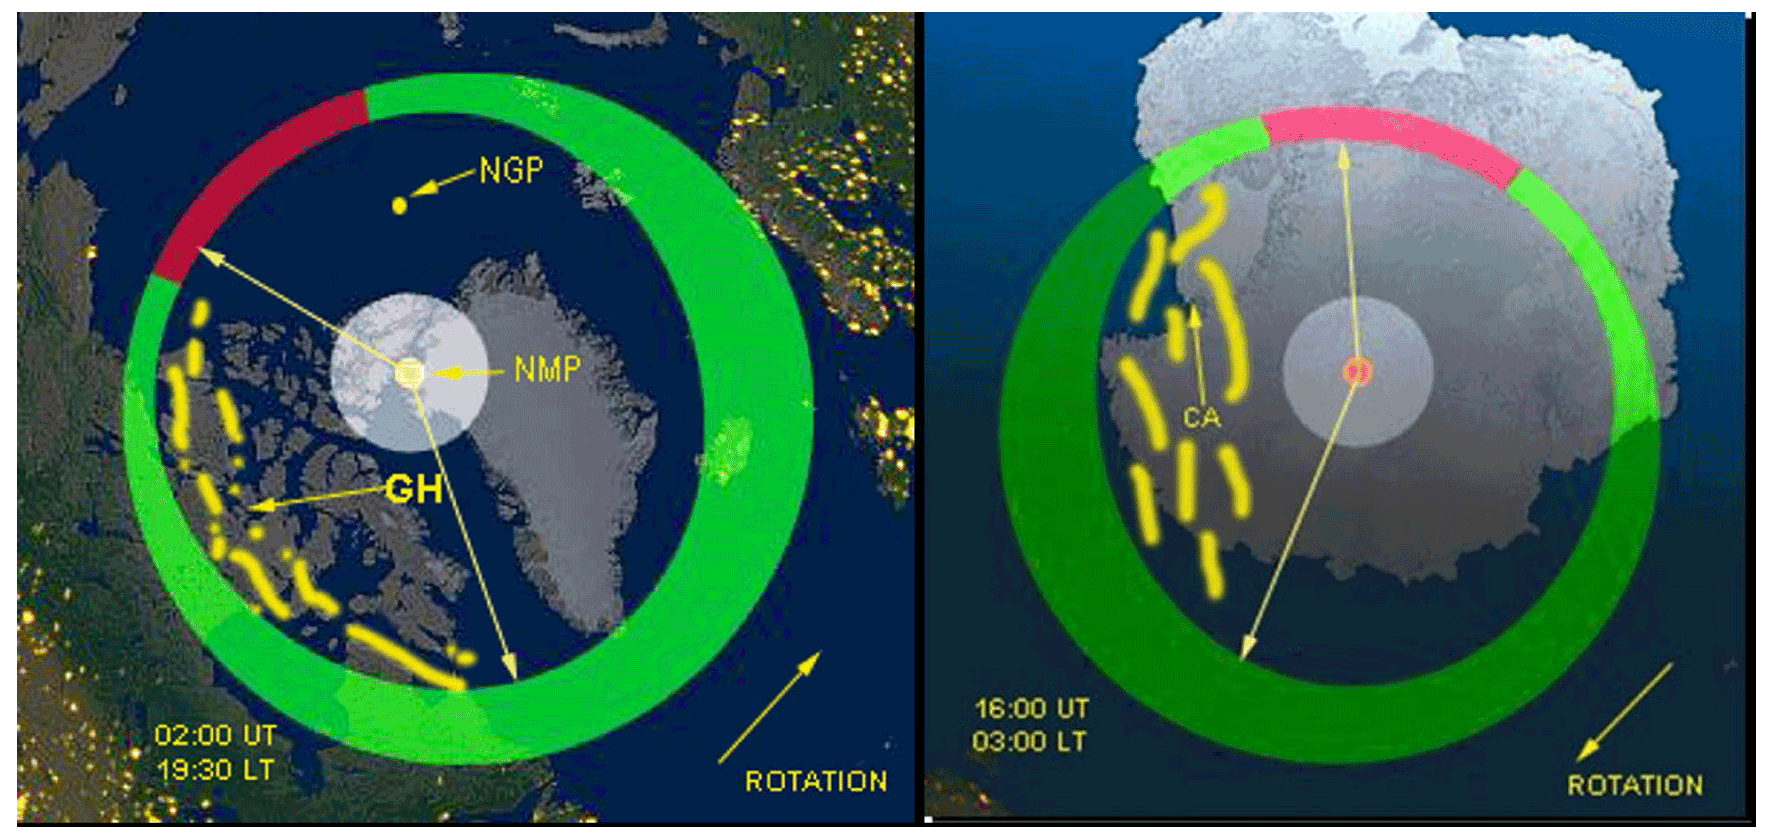
Figure 6This figure illustrates the location of the Arctic and Antarctic auroral oval during moderately disturbed magnetic condition (Kp at both stations around 2) according to Breedveld (2020) and Sigernes et al. (2011).
The locations of the two stations GH and CA are marked. Approximately 30 % of the events are observed poleward of the oval. The rotation direction – marked by the yellow arrows – is opposite in the two hemispheres. Low-intensity yellow auroral bands observed mainly in the geographical western hemisphere – called “Sun-aligned arcs” – were the dominating auroral form poleward of the oval at both GH and CA (from Egeland and Deehr's, 2024, private archive).
The accurate location and extent of the oval depend on several different scientific processes in this dynamic region. The measurements at GH and CA clearly show maximum occurrence during midwinters at both hemisphere, and its connection with magnetic disturbances is low, which shows that our data are observed poleward of the oval. This also indicates that the production source of polar cap auroras is different from those oval auroras.
One of the charcoal auroral drawings from CA is presented in Fig. 7. To the author, it looks like a nice folding curtain drawn by A. Wilson when he looked at the display.
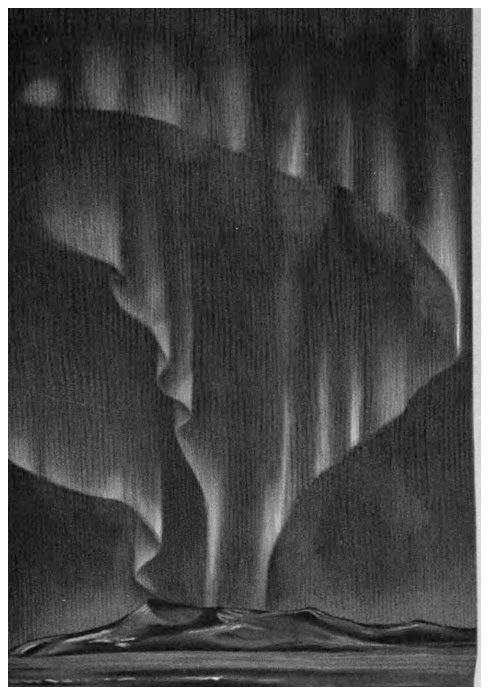
Figure 7A charcoal rendering of the aurora observed at CA on 9 April 1902, at 02:25 LT, of an event classified as streamers from north with intensity such as a star of magnitude 3. Its title is “Auroral Streamers”. Copied from Bernacchi (1908).
The average diurnal variation of auroral events at CA for the two winters 1902 and 1903 is shown in Fig. 8. This sighting reveals that a large fraction was observed as poleward expansions from the auroral zone. Weather and moonlight tend to decrease the number of dayside auroras. According to Bernacchi (1908), “many of the observations were made when the magnetic curves were quiet, or even very quiet”.
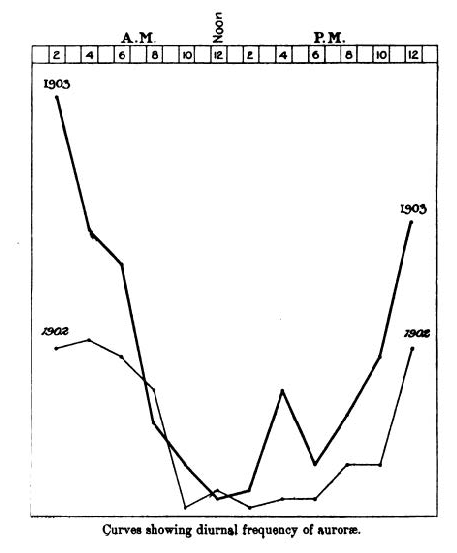
Figure 8The average diurnal variations of auroral occurrence versus local time are shown for the winters of 1902 and 1903 (Bernacchi, 1908). Maximum was observed in both years between 22:00 and 04:00 LT. The curve for 1903 clearly illustrates a second maximum during early afternoon. The peak around 3 and 4 local time overlaps with low-energy electron precipitation observed by auroral rockets in northern Norway. The number of events is listed in Table 3.
Table 3The recorded auroral events for different months in 1902 and 1903 are listed. As the table shows, auroras were recorded between March and September – particularly many in 1903. The main activity was found in both years during June and July. Surprisingly, few auroral events are observed in May for both years, even less than in April (Bernacchi, 1908). Notice that the number is significantly higher – nearly double – in 1903 compared to 1902. Maximum occurrence was recorded in both years midwinter. The activity is very high in April in both years, while the numbers of days with auroras are nearly equal in both May and August. Notice that more events were even seen in April than in May. This confirms well with what was found at GH and proves clearly that aurora is a very dynamic phenomenon.
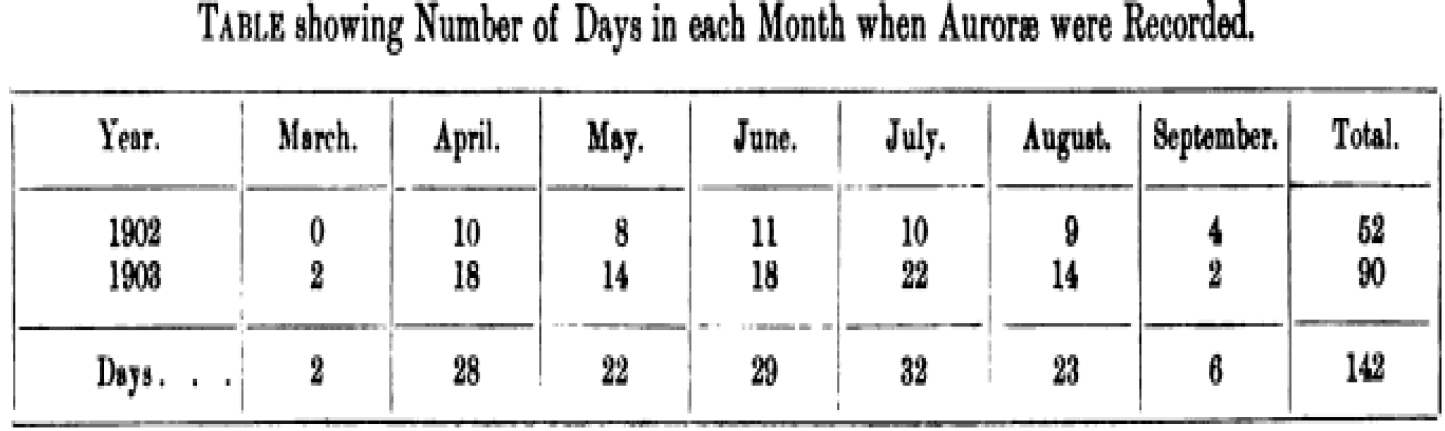
According to Bernacchi (1908), the time of occurrence appeared to depend upon the latitude where the displays were observed. If the events happened closer to the pole, it usually started to appear earlier. Maximum was first observed in the region which first got dark. Several events north of the auroral zone were observed in early afternoon. During the other months, there was too much daylight for auroral observations. The fact that many more events were observed in 1903 than in 1902 is explained by the fact that the number of sunspots was higher in 1903, namely, 53 compared to 24 spots in 1902 (Chree, 1909). Up to 1960, a close connection between auroral occurrence and sunspots was reported in many publications, but that has changed during the space age.
Regarding interpretation of the observations, Chree (1909) discussed electric atmospheric currents in the following way: “The existence of very bright auroral bands or streamers may mean an electric current of unusually high intensity contributes”.
The average diurnal variations at both stations are shown in Fig. 9. The data from GH are in blue, while the CA measurements are in red. The number of auroral days is given by the left vertical scale. Local afternoon (Aft), magnetic noon (Noon), and magnetic midnight (Midnt) at both GH and CA are marked. The bottom horizontal yellow line illustrates when observations were not possible at CA – because of too much sunlight – while the horizontal blue line illustrates that systematic auroral observations at GH were not carried out after 22:00 LT. The two stations are 6 h separated in local time, and magnetic time rotates in opposite directions in the two hemispheres.
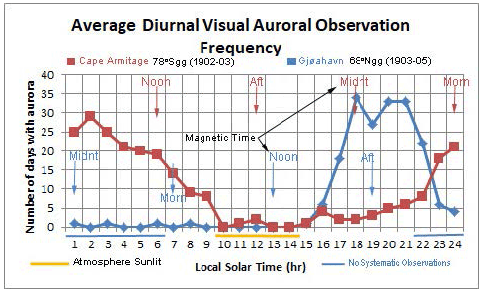
Figure 9The average diurnal variations in auroral occurrence at GH in the blue curve and at CA in red, as a function of local solar time, is shown. The number of days with auroras is given by the left vertical scale. The times for local afternoon, magnetic noon, and magnetic midnight are marked. The bottom horizontal yellow line illustrates when observations were not possible at CA – because of too much sunlight, while the blue, horizontal line illustrates that no systematic observations at GH were carried out between 22:00 and 12:00 LT (from Egeland and Deehr, the “Fram project”, recommended for publication in 2025). The stations are 6 h separated in local solar time. When disturbances are 6 h separated between GH and CA, solar electromagnetic radiations are likely the important sources. From Egeland and Deehr' private archive.
The diurnal variations follow closely local solar time with a marked maximum near local midnight. The GH data also show high activity early afternoon – when we observe the Sun-aligned arcs. Aurora around magnetic noon – called daytime auroras, were observed. At GH it was too much sunlight near magnetic noon to carry out observations. The observations indicate that the polar cap auroras – with maximum occurrence during midwinters – contribute significantly to the total occurrence. In addition, the relations between auroral occurrence and magnetic time are different from what has been observed in the auroral oval (cf. Sandholt et al., 2005).
The correlation with magnetic disturbances is low, which is different from that found for oval auroras. Maximum occurrence is found several hours after magnetic midnight. Thus, these data indicate that the diurnal variation is not controlled by the solar wind, but that photoelectrons are important.
Observations of visual auroras require dark nights. Even if observatories on both hemispheres are carried out, auroras can only be sporadically recorded. It has therefore been investigated if it is possible to establish a relationship to geomagnetic signatures. Then the magnetic signatures could be used as proxies for the occurrence of certain auroral forms. Three different auroral forms dominate the polar regions, and they are discussed in the following subsections.
6.1 Theta polar cap arcs (TPAs)
The form called “theta” aurora was observed first in the 1980s when we got satellite photographs of the entire polar sky. The name theta was chosen early on because – with an arc stretching from one side of the oval to the other – this form is like the Greek letter theta (cf. Fig. 10). Thus, the arc has a “noon-to-midnight” alignment. The arc across the polar cap has a definite orientation in the Sun–Earth direction. This theta form is now generally called “transpolar arc” (TPA) in international literature. These arcs are primarily excited by low-energy (< 100 eV) electrons (Sandholt et al., 2005). This conclusion is based on many satellites recordings. Excited oxygen atoms above 200 km are yielding weak reddish aurora at 630 nm and virtually no emissions below. This form of aurora is generally not associated with magnetic disturbances on the ground. Because its intensity is low, this auroral form is very rarely seen by the naked eye. From the ground, only a small part of the theta form can be seen because a large part of the form is stretching outside the field of view of the observers.
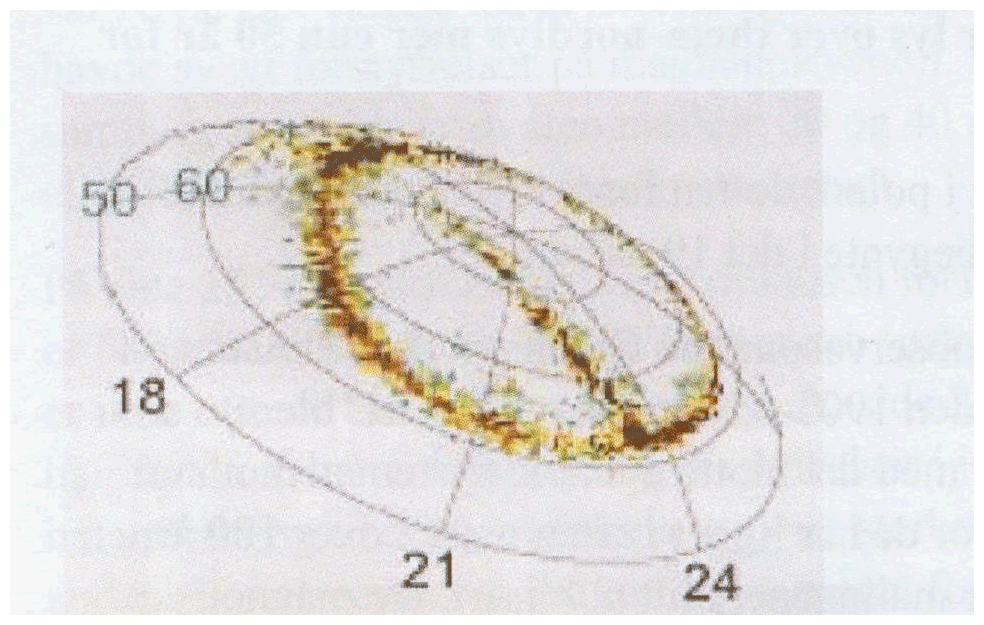
Figure 10Picture of theta aurora over at the Northern Hemisphere – as a function of latitude and time – taken by the IMAGE satellite in 2002. The Sun is in the upper part of the picture (photo: NASA).
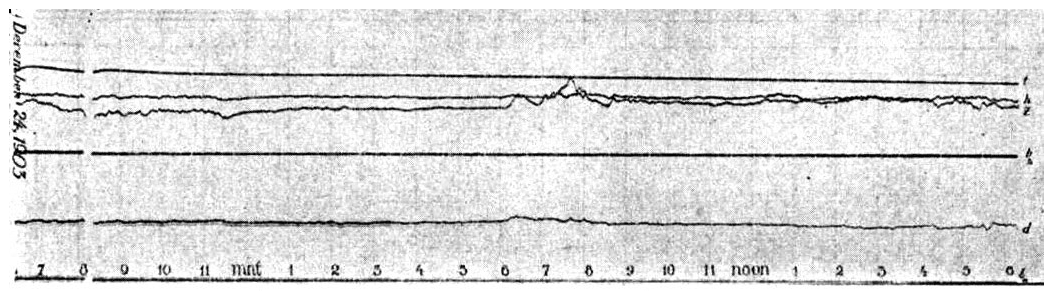
Figure 11The magnetic recording at GH of a TPA form shows no magnetic activity in the D and H components, but some weak disturbances can be recorded on the vertical component, as shown in the figure (Steen et al., 1933).
6.2 Poleward-moving substorm arcs (PSAs)
Also, this form is seldom seen by the naked eye, but the magnetic substorm can be marked, as seen in Fig. 12. On 14 December 1903, near 22:30 local solar time (see figure on the next page), a poleward expansion form associated with the onset of an auroral substorm – both at GH and CA, 1 h before magnetic midnight – was recorded.
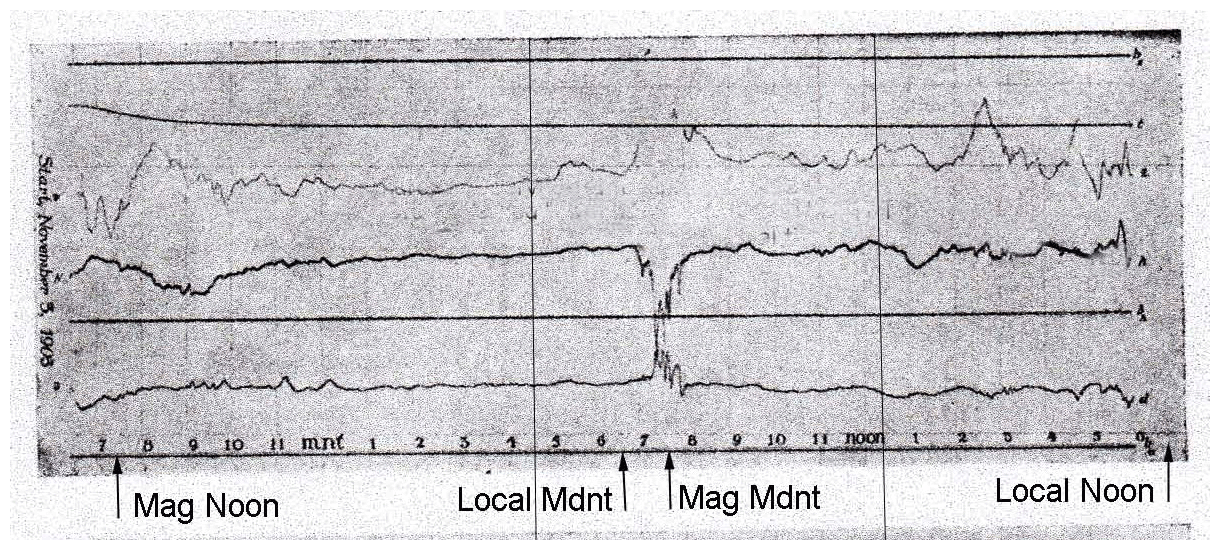
Figure 12This magnetogram from GH shows the auroral substorm with disturbances in all three components near magnetic midnight, or at 07:30 UT. This recording is typical for relatively small auroral substorms. Similar auroral substorms have been observed at both stations during the occurrence of PSA auroras, and they are mentioned in the report by Egeland and Deehr (2014). From Egeland and Deehr's (2024, private archive).
Similar magnetic substorm effects of poleward expansion of auroras were observed simultaneously in 1903, a few times in both hemispheres, near 22:00 MLT.
6.3 Sun-aligned auroral arcs (SAAs)
Low-intensity auroral bands poleward of the oval – called Sun-aligned auroral arcs (SAAs) – are often observed in the polar cap. The occurrence of such an auroral form is illustrated in Fig. 6 by the yellow–green strips. They are the overwhelming number of auroral forms which can be observed by the naked eye poleward of the oval. However, no such forms are observed ±2 h around local midnight. Magnetic recording for such events (see Fig. 5) shows that the magnetic activity is extremely low around solar midnight, while some activity may be observed both before and after. As we have no drawings from CA of this form, a satellite picture from has been used for this SAA illustration. The location is pointed out by the arrow. This SAA – recorded from a satellite – is shown in Fig. 13. Notice that this arc is located well poleward of the oval (Fig. 11).
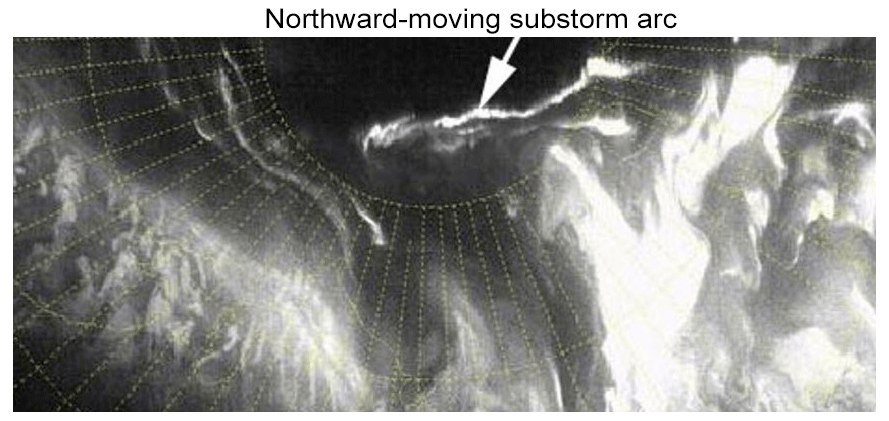
Figure 13Example of a Sun-aligned auroral arc, north of the oval – marked by a white arrow in the picture. The picture is taken from a Defense Meteorological Satellite Program (DMSP) satellite. Egeland and Deehr's (2024, private archive).
SAAs occur almost daily, as a part of the geomagnetic solar quiet variation – called the Sq variation. They appear to be emanated from the merging of the interplanetary magnetic field (IMF, Bz). The intensity of the SAA and the annual, diurnal, and solar cyclical occurrence frequency suggest that they are embedded in “polar rain” and dependent on the density and energy of local photoelectrons.
The Gjøa and Discovery expeditions to the northern and southern polar caps (1901–1906) carried out visual auroral and geomagnetic observations from Gjoa Haven (GH) and Cape Armitage (CA). These unique stations were geomagnetically conjugate to within less than 1° of 78° geomagnetic latitude and 30 min of geomagnetic time (cf. Fig. 1). CA is 6.5 h in solar time behind GH. During midwinter conditions at GH, they had midnight Sun at CA. The Discovery data were organized by the Royal Society in London, and preliminary results were published in internal reports nearly 20 years before the GH data (cf. Chree, 1909; Steen et al., 1933; Egeland and Deehr, 2014). These observations have not received much attention.
At the beginning of the 20th century, it was generally concluded that when auroras appeared overhead the Earth's magnetic field is disturbed (cf. e.g., Tromholt, 1885; Birkeland, 1908; Størmer, 1955; Chapman, 1968). On p. 141 in his diary, Amundsen wrote: “Until now we have had opportunities to see several times how certain strong northern lights haves no magnetic influence whatsoever”.
The average diurnal and seasonal variations at both stations show great similarities. The maximum occurred near midwinter at both hemispheres. The number of events was nearly double in 1903 compared to 1902 and 1904. Many events moved to zenith and some events moved further poleward. A large fraction of the observations were associated with very weak magnetic disturbances.
Unique geomagnetic signatures of polar cap aurora were found using data from the expeditions and observations during the space age. The three main types of polar cap aurora were transpolar arcs (TPAs), poleward substorm arcs (PSAs), and Sun-aligned arcs (SAAs). The first two are infrequent polar cap features probably originating in the plasma sheet. These forms seem to be connected with special magnetic signatures and may be mapped even if they are not seen.
On 14 December 1903, a poleward expansion aurora event was observed at GH and most probably simultaneously at CA. Similar magnetic effects of poleward expansion of auroras were observed in both hemispheres, near 22:00 MLT. Unfortunately, we lack statistical data to prove this finding of similarity at both hemispheres.
SAAs occur nearly daily and are probably connected to the geomagnetic solar quiet Sq variation as is observed at magnetic observatories. The SAA forms appear to emanate from the merging of the interplanetary magnetic field (Egeland and Deehr, 2014). The intensity of SAA and the annual, diurnal, and solar cyclical occurrence frequency suggest that they are embedded in “polar rain” and dependent on the density and energy of local photoelectrons. East or west currents are associated with SAAs around magnetic noon. According to recent satellite measurements, polar cap auroras are caused either by solar electromagnetic radiations, polar rain, and/or photoelectrons (cf. Newell et al., 2009).
No data sets were used in this article.
The author has declared that there are no competing interests.
Publisher’s note: Copernicus Publications remains neutral with regard to jurisdictional claims made in the text, published maps, institutional affiliations, or any other geographical representation in this paper. While Copernicus Publications makes every effort to include appropriate place names, the final responsibility lies with the authors.
The author expresses his special warm thanks to Dr. Charles Deehr, Fairbanks, Alaska, who was an active coworker with valuable contributions during the first year. However, after a later family illness, he has withdrawn from this work.
I would also like to thank the Fram Museum, Oslo, for financial support and several valuable discussions.
This research has been supported by the Fram Museum, Oslo.
This paper was edited by Kristian Schlegel and reviewed by two anonymous referees.
Amundsen, R.: A Proposed Expedition to the North Magnetic Pole, Geogr. J., Vol. XIX, 484–489, 1902.
Amundsen, R.: The Northwest Passage, Archibald Constable & Co. Ltd., London, 1908.
Barraclough, D. and Malin, S.: 150 years of the north magnetic field, Nature, 291, p. 377, 1981.
Bernacchi, L. C.: Antarctic Observations of Aurora with discussions by various authors, The Royal Society, London, 1908.
Birkeland, K.: The Norwegian Aurora Polaris Expedition 1902-03, Vol. I, Aschehaug, Kristiania, 1908.
Birkeland, K.: The Norwegian Aurora Polaris Expedition 1902-03, Vol. II, Aschehaug, Kristiania, 1913.
Breedveld, M. J.: Predicting Auroral Oval Boundaries, Master thesis, Univ. of Tromsø, Norway, 2020.
Chapman, S.: Historical introduction to aurora and magnetism, in: The Birkeland Symposium on Aurora and Magnetic Storms, 18–22 September 1967, edited by: Egeland, A. and Holtet, J., Centre National de la Recherche Scientifique, Paris, 21–29, 1968.
Chree, C.: British National Antarctic Expedition (1901–1904), Magnetic Observations, Various Authors The Royal Society, London, 1–210, 1909.
Egeland, A. and Deehr, C. S.: The north Magnetic Pole, The FRAM Museum, 2014.
Fritz, H.: Das Polarlicht, F. A. Brockhaus, Leipzig, 1881.
Graarud, Å.: METEROLOGY, observations arranged and reduced, Geofys. Publ. no VI, 1932.
Graarud, Å. and Russeltvedt, N.: Die Erdmagnrtische Beobachtungen der Gjøa Expedition 1903–1906, Geofys. Publ., III, 3–14, 1928.
Huntford, R.: Scott and Amundsen expeditions, 1–288, ISBN 82-03-10296-4, 1982.
Kivelson, M. G. and Russell, C. T.: Introduction to Space Physics, Cambridge Univ. Press, 1–536, 1995.
Kløver, G. (Ed.): Cold Recall, Reflections of a Polar Explorer, The FRAM Museum, Oslo, 2009.
Kløver, G.: Gustav Juel Wiiks dagbøker: The Northwest Passage 1903-05, The FRAM Museum, Oslo, 2016.
Kløver, G.: Peder Ristvedt's dagbøker: The Northwest Passage 1903-05, The FRAM Museum, Oslo, 2017a.
Kløver, G.: Roald Amundsen's diaries: The Northwest Passage 1903-05, The FRAM Museum, Oslo, 2017b.
Kløver, G.: The Diaries of Gustav Juel Wiik, from the Gjøa expedition, The Farm Museum, 2017c (in Norwegian).
Nansen, F.: Fram over Polhavet, Aschehaug, Kristiania, 1897.
Newell, P., Lou, L., and Wilson, R.: Polar cap particles precipitation and aurora. Review and commentary, J. Atmos. Sol.-Terr. Phys., 71, 199–215, 2009.
Ross, J. C.: On the position of the north magnetic pole, Philos. T. R. Soc. Lond., 124, 47–51, 1834.
Sandholt, P. E., Carlson, H., and Egeland, A.: Dayside and Polar Cap Aurora, Kluwer Academic Publishers, VII, 1–309, ISBN 0-306-47969-9, 2005.
Sigernes, F., Dyrland, M., Brekke, P., Chernouss, S., Lorentsen, D. A., Oksavik, K., and Deehr, C. S.: Two methods to forecast Auroral display, J. Space Weather Spac., 1, A03, https://doi.org/10.1051/swsc/2011003, 2011.
Silverman, S. M. and Smith, M. E.: Amundsen and Edmonds: Institutional Exploration, Am. Geophys. Union, Washington DC, 69–79, 1994.
Steen, A. S., Russeltvedt, N., and Wasserfall, K. F.: The scientific data from the Norwegian Arctic Expedition in the Gjøa, 1903–1906, Geophys. Publ., 7, 1–309, 1933.
Størmer, C.: Classification of auroral forms, Oslo, 1930.
Størmer, C.: The Polar Aurora, Claredon Press, Oxford, 1955.
Tromholt, S.: Under the rays of the Aurora Borealis in the Land of the Lapps and the Kvaens, Vol. 1 & 2, Houghton, Mifflin, & Co., Boston, 1885.
- Abstract
- Introduction
- General information about aurora
- The auroral observations at Gjoa Haven
- Auroral observations at Cape Armitage
- Daily variations in the occurrence of auroras at CA and GH
- Magnetic signatures of polar cap auroras
- Summary and conclusions
- Data availability
- Competing interests
- Disclaimer
- Acknowledgements
- Financial support
- Review statement
- References