the Creative Commons Attribution 4.0 License.
the Creative Commons Attribution 4.0 License.
 | 16 Jun 2023
New Zealand's first gauge-based sea level measurements
James Cook's second voyage to the South Seas, undertaken to settle the question regarding the existence or otherwise of the “Great Southern Continent” (Terra Australis Incognita), involved two vessels, the Resolution and Adventure. The Board of Longitude appointed two astronomers from the Royal Observatory, Greenwich, to the voyage, William Wales and William Bayly, respectively, one to each vessel. They were instructed, in addition to their astronomical duties, to observe the height and time of the tides. To this end, Bayly and Wales fabricated tide gauges and conducted timed measurements of sea level during their stopovers in New Zealand during 1773. This paper reviews those tidal observations, the first of their kind in New Zealand, using modern understanding of the tide, assuming that no significant change in the tidal regime at each location has taken place during the intervening period. When compared to the predicted (hindcast) astronomical tide, the majority (80 %) of the observed ranges and times agreed within 20 cm and 30 min, respectively. Whilst their observations have little scientific value today (other than indicating the quality attainable in the late 18th century), Bayly and Wales can not only rightfully lay claim to making New Zealand's first tide gauge measurements but also, as far as it possible to ascertain, be justifiably proud of the quality of their endeavours.
- Article
(5196 KB) - Full-text XML
- BibTeX
- EndNote


When James Cook (1728–1779) embarked on his first voyage to the South Seas (1768–1771) aboard HMS Bark Endeavour, he carried two sets of secret orders. The second of these, to be opened on completion of observing the transit of Venus on 3 June 1769 from Tahiti (the subject of the first order), directed Cook to sail south to a “Continent or Land of great extent … or the Latitude of 40∘” (Beaglehole, 1955, p. cclxxxii) whichever he arrived at first.
Although Cook's voyage was judged a success by many measures, the question of the “Great Southern Continent” (Terra Australis Incognita) remained unanswered. In the postscript to his Endeavour journal, Cook suggested that New Zealand would serve as an ideal staging location for further discoveries in the South Seas, particularly in support of exploring the highest of latitudes (Beaglehole, 1955, p. 479).
Plans for another expedition began to unfold little more than 2 months after Cook's return to England. The Admiralty instructed the Navy Board to purchase “two proper vessels of about 400 tons for service in remote parts” (Beaglehole, 1961, p. 899) – two ex-merchant colliers were duly acquired, refitted, and renamed HMS Resolution and HMS Adventure.
Cook (now promoted to the rank of Commander) was assigned to the Resolution, and Lieutenant Tobias Furneaux (1735–1781) was appointed captain of Adventure, the smaller of the two vessels. The Board of Longitude1 appointed two astronomers, both from the Royal Observatory, Greenwich, to the voyage: William Bayly (1737–1810) and William Wales (1734–1798). Bayly joined the company aboard the Adventure while Wales accompanied Cook on the Resolution.
In addition to their astronomical duties, Bayly and Wales were to “Observe the height of the Tides and the time of high and low water, particularly at the full and change2 of the Moon and Whether there be any difference and What, between Night and Day tides” (Beaglehole, 1961, p. 727). These instructions were more specific than those given to Cook for his Endeavour voyage, which simply required the “direction and Course of the Tides and Currents” to be obtained. Woodworth and Rowe (2018) provide a review and assessment of the quality of the tidal observations made by Cook during his Endeavour voyage, based on modern tide information.
During stopovers made in 1773 by the Resolution and Adventure at Dusky Bay3 and Queen Charlotte's Sound 4 (see Fig. 4), Wales and Bayly conducted the first gauge-based sea level measurements made in New Zealand (see Table 1). These observations, along with the astronomers' extensive celestial observations, determinations of time, and comparisons of the time keepers carried on the ships, were published in Wales and Bayly (1777).
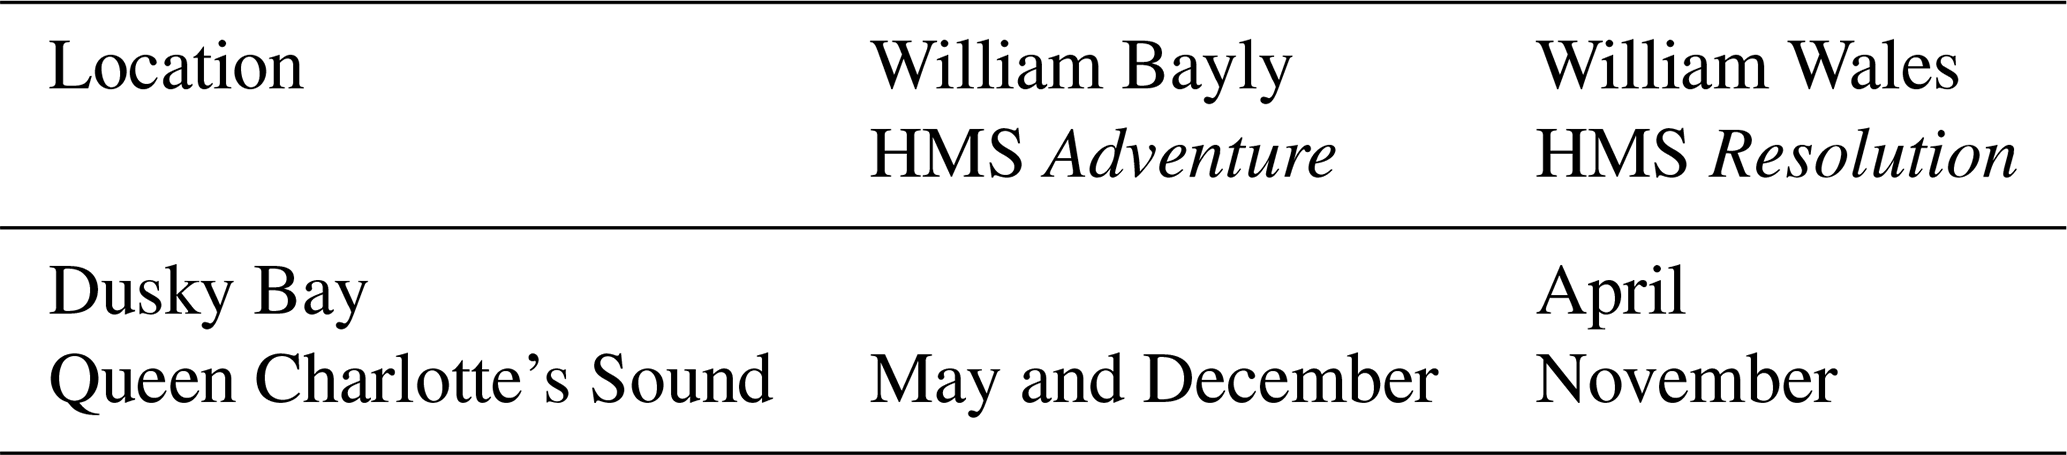
Table 1Locations and dates of tide observations carried out in New Zealand during 1773 by Bayly and Wales as well as the vessels that they sailed on.
Whilst the intent of Cook's second voyage (1772–1775) was, prima facie, to discover and explore any lands that might lie in the unexplored part of the Southern Hemisphere, the voyage, being commissioned by the British government, also had the strategic objective of taking, in the name of the King of Great Britain, any land encountered, subject to the consent of any natives should it be inhabited (Beaglehole, 1961, p. clxviii). Cook was to observe the characteristics of his discoveries (and the nature of any peoples), including gathering information that would be useful to either navigation or commerce. This paper details the tide observations made by Bayly and Wales during their stopovers in New Zealand and examines their results in terms of tide predictions based on modern data recorded at tide stations near the sites that they occupied during 1773.
2.1 William Bayly (1737–1810)
A farmer's son, William developed an early interest in mathematics which was fostered by those who recognised the boy's abilities. Such was his aptitude that Bayly came to the attention of Nevil Maskelyne (1732–1811), the Astronomer Royal, and was duly appointed as an assistant at the Royal Observatory, Greenwich. Bayly would serve as astronomer on Cook's second and third (1776–1779) voyages, otherwise fulfilling his duties at the observatory until 1785. During this latter period, Bayly was involved in writing the scientific account of Cook's third voyage. On leaving the observatory, Bayly took up the post of Headmaster at the Royal Naval Academy at Portsmouth, a position he held for 22 years before retiring aged 70. No portrait of Bayly is known to exist (Orchiston, 2016, pp. 152–153).
2.2 William Wales (1734–1798)
Like Bayly, William Wales, Fig. 1, showed an ability in mathematics from an early age and, in 1766, was commissioned by the Astronomer Royal to carry out the computations for the first edition of The Nautical Almanac. After returning from Cook's second voyage Wales accepted the position of Master of the Royal Mathematical School and also undertook, with Bayly, the task of publishing the scientific observations made during the voyage. Later still, Wales completed the scientific account of Cook's first voyage which he published 17 years after that voyage had ended. In 1765, Wales married Mary, the sister of Charles Green, the astronomer on Cook's first voyage, and his accomplishments were recognised when he was elected Fellow of the Royal Society in 1776. At the time of his death, Wales was Secretary of the Board of Longitude (Orchiston, 2016, pp. 154–155).
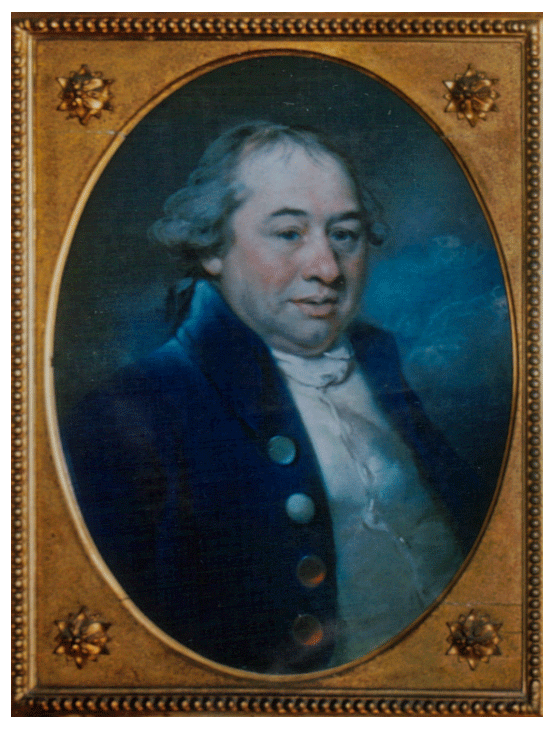
Figure 1Pastel portrait of William Wales painted by John Russell in 1794, now at Christ's Hospital, Horsham (photograph courtesy of Wayne Orchiston).
3.1 Tide gauges
In the extensive introduction to their account of the astronomical observations that they made during the voyage (Wales and Bayly, 1777), the authors describe the use of the various items of equipment with which they had been provided, but tide gauges are conspicuously absent from the inventory. It would seem that Bayly and Wales were each responsible for supplying or constructing their own tide gauge device.
Bayly used a narrow glass tube that functioned as a stilling well during his first visit (May 1773) to Queen Charlotte's Sound, with the zero being set near low water, but there were times when he recorded negative tide heights. Upon his return in December 1773, Bayly deployed a pair of wooden posts that served as tide boards from which visual readings could be made. Bayly read the water level on his gauges to a precision of 0.25 in. (∼6 mm).
Wales fabricated a square wooden tube into a stilling well at Dusky Bay, and he assembled a simple dual-post arrangement half a year later at Queen Charlotte's Sound, as his tube had, in the meantime, been stolen by natives at Tahiti (Wales and Bayly, 1777, p. 56). Wales set zero for his gauges at both locations high so that all his water levels were measured below the reference mark, normally to the nearest inch (only on rare occasions to half that interval).
More detailed descriptions of these tide gauges are included in the discussion of each set of tide observations (see Sect. 6.1–6.4).
3.2 High-water observations
The following discussions will show that the astronomers' measurements at high water were more comprehensive than those of low water, with the latter being rarely more than a single observation. In addition to timing and measuring the highest water level, equal numbers of tide gauge readings were made before and after the maximum level. The clock time was recorded at every observation as well as the apparent time5 at high water.
Bayly's observations were often made at 10 min intervals and were twice as numerous as those made by Wales. Figure 2 shows a typical sequence of sea level measurements made by Wales at Dusky Bay (in this case high tide on 17 April 1773). Here, we see his gauge readings when the water level was 7, 10, and 14 in. below, before and after, high water; unlike Bayly, Wales did not make his observations at regular time intervals. As the distances to the water level were measured down from the top of the tube, the least distance is associated with high water. Clock time is given for each measurement, and apparent time is included for the time of high water.
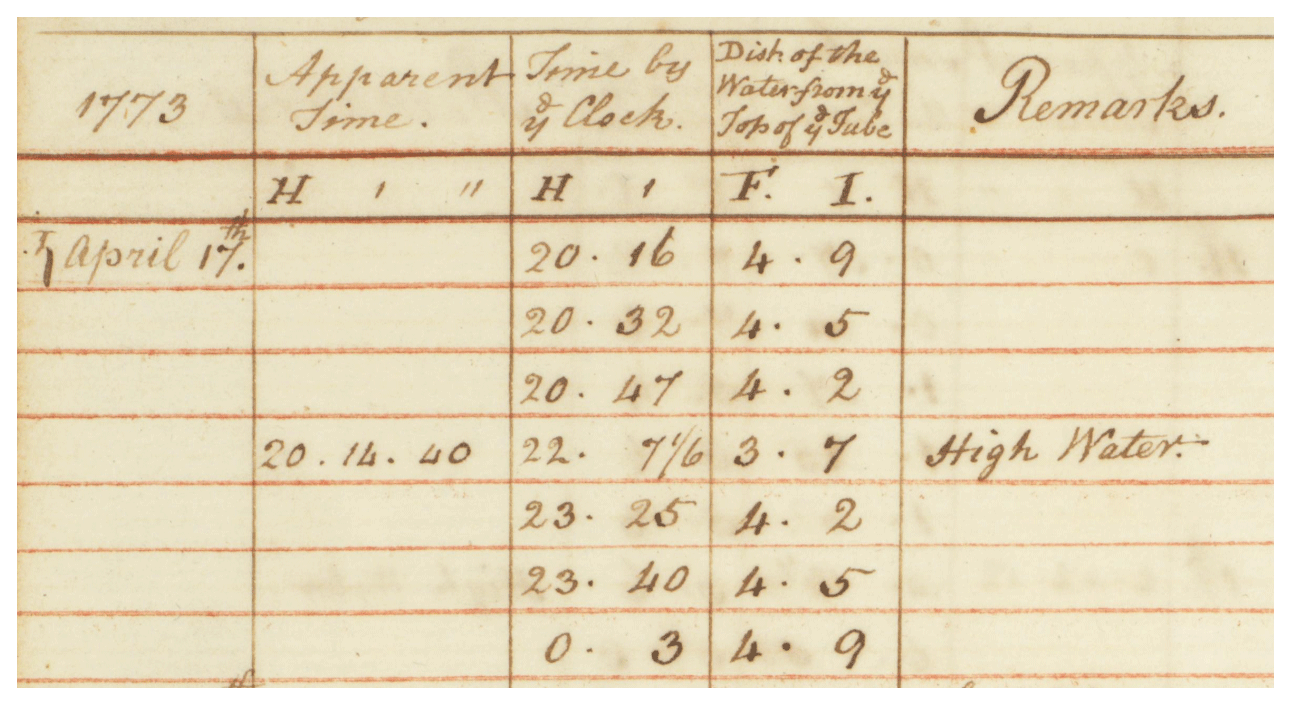
Figure 2Wales's sequence of observations before, at, and following a high tide on 17 April 1773 at Dusky Bay (Wales, 1775b, p. 8).
3.3 Low-water observations
As mentioned previously, Bayly and Wales paid far less attention to low water than they did to high water. Indeed, low-water observations normally consisted of a single reading of the gauge, and many by Wales comprised a height only, without an associated clock time. Bayly appears to have been more conscientious, often recording the period that the water level remained steady during his low-water observations; an example of such a comment is shown in Fig. 3: “The Water sunk Inches below nothing on the scale & stood from 6h.20′ to 6h.50′ & then began to rise”. (In the preceding quote, “” denotes 2.25 in.)
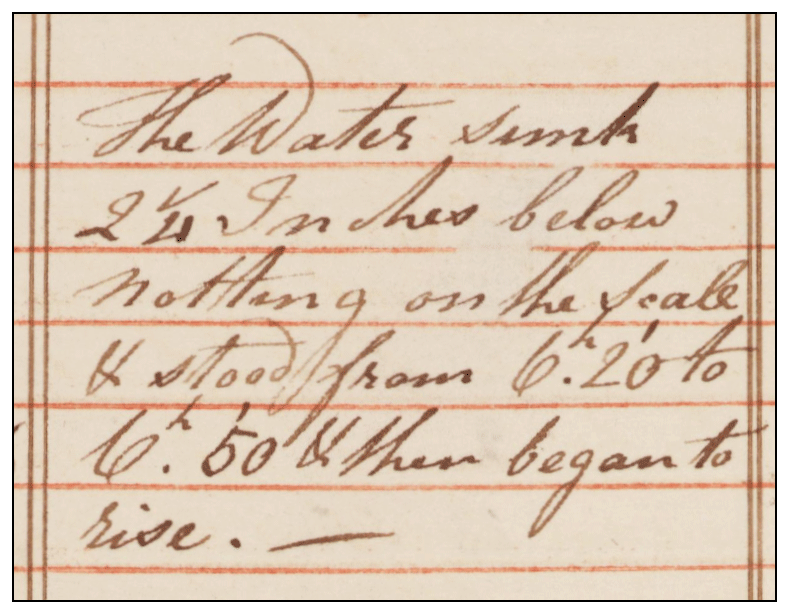
Figure 3Bayly's observation of a low water on 7 May 1773 at Queen Charlotte's Sound (Bayly, 1774b, p. 36).
3.4 Comments
Whilst there appears to be no reason to doubt the veracity of the observations that Bayly and Wales recorded in their handwritten records (Bayly, 1774b; Wales, 1775b) and subsequently published in Wales and Bayly (1777), these surely cannot be the only gauge readings that they made to determine the time and height of these tide events. The handwritten records (as illustrated in Fig. 2) are too immaculate to have been penned at the gauge, and so it seems likely that a subset of the observations was transferred from a field book to their respective observation log books (Bayly, 1774b; Wales, 1775b). Without access to those original records, it is not possible to know how extensive their tide measurements really were, nor the criteria used to select the subset of observations that were published (and used in this paper).
Tide predictions have been generated for 1773 based on our modern knowledge of the tide and with the implicit assumption that the main characteristics of the tide have not changed in the last 250 years. The modern information comes from sea level measurements at stations located near where Bayly and Wales carried out their observations.
4.1 Modern tide stations
Modern tide stations at Motuara Island and Many Islands, within Queen Charlotte Sound/Tōtaranui and Tamatea/Dusky Sound, respectively, are indicated by the blue squares in Fig. 4a and b, respectively, whilst the locations of the 1773 observations are shown by the red dots.
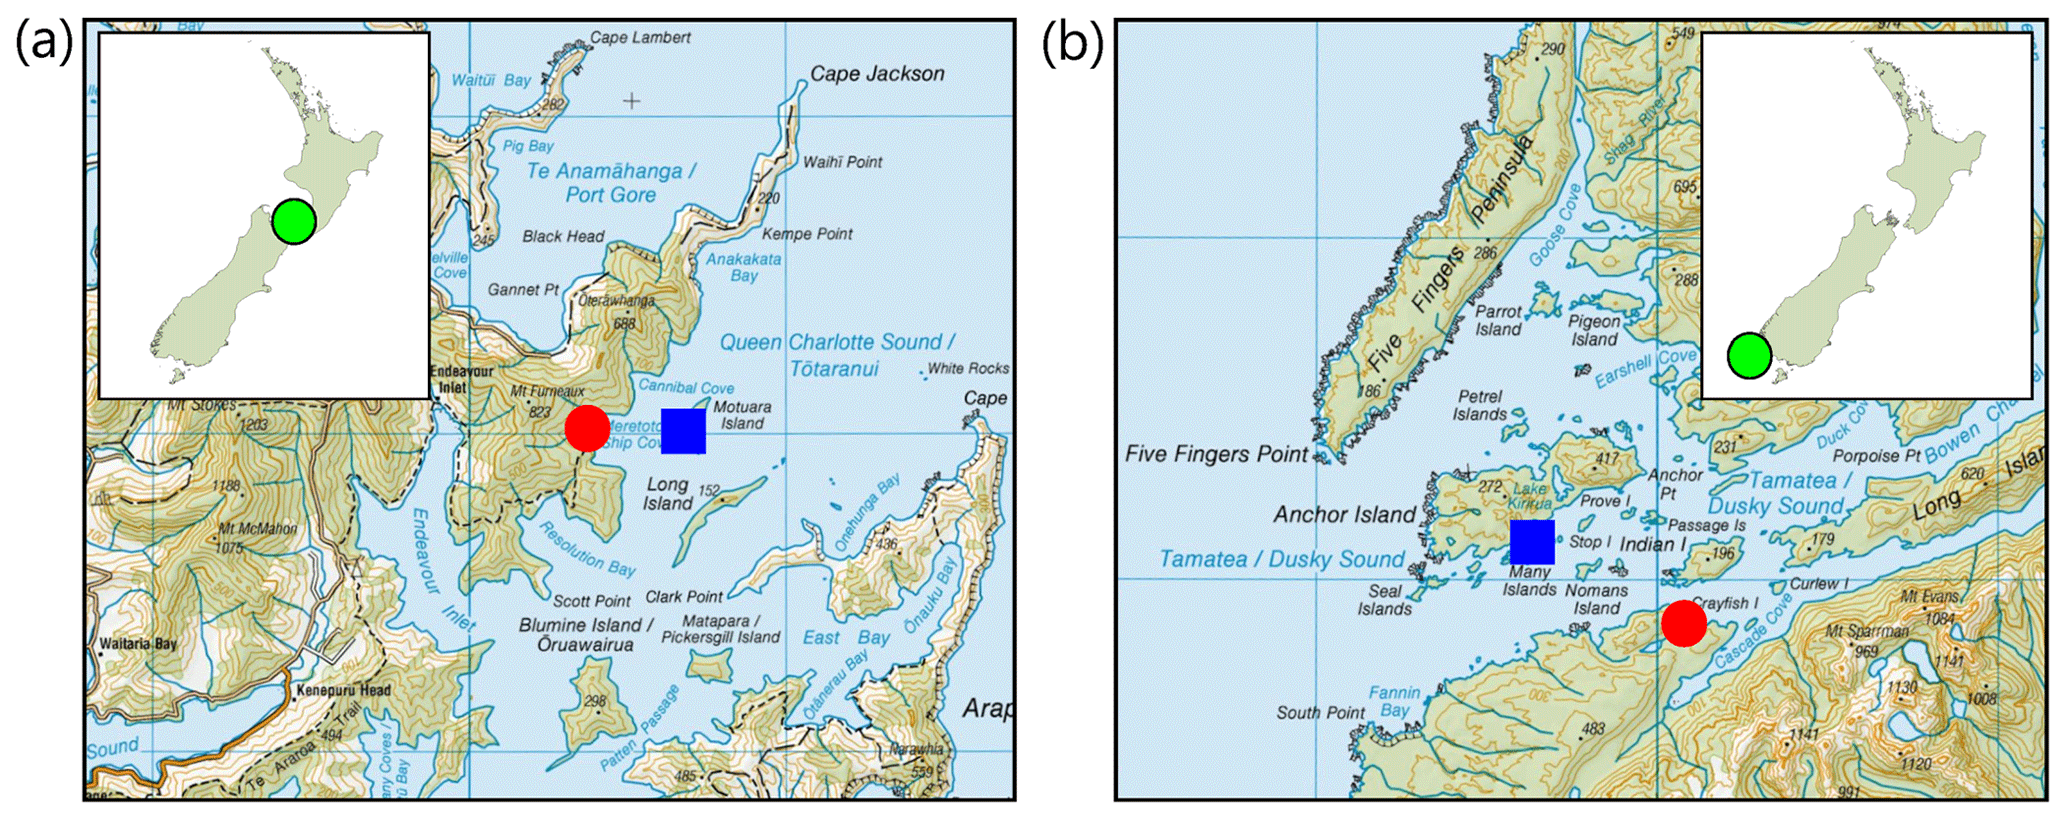
Figure 4(a) Map of Queen Charlotte Sound/Tōtaranui showing Ship Cove, the location of Bayly's and Wales's tide gauges (now known as Meretoto/Ship Cove), at the red dot and a blue square at Motuara Island. (b) Map of Tamatea/Dusky Sound showing the location of Wales's gauge at Pickersgill Harbour (red dot) and a blue square at Many Islands. Insets show the location within New Zealand. The grid lines are at a spacing of 10 km. (The map in panel a was extracted from LINZ Topo250 Map 13, the map in panel b was extracted from LINZ Topo250 Map 24, and the coastline polygon for insets was sourced from LINZ Data Service at https://data.linz.govt.nz, last access: 30 August 2022).
4.2 Analysis of modern sea level data
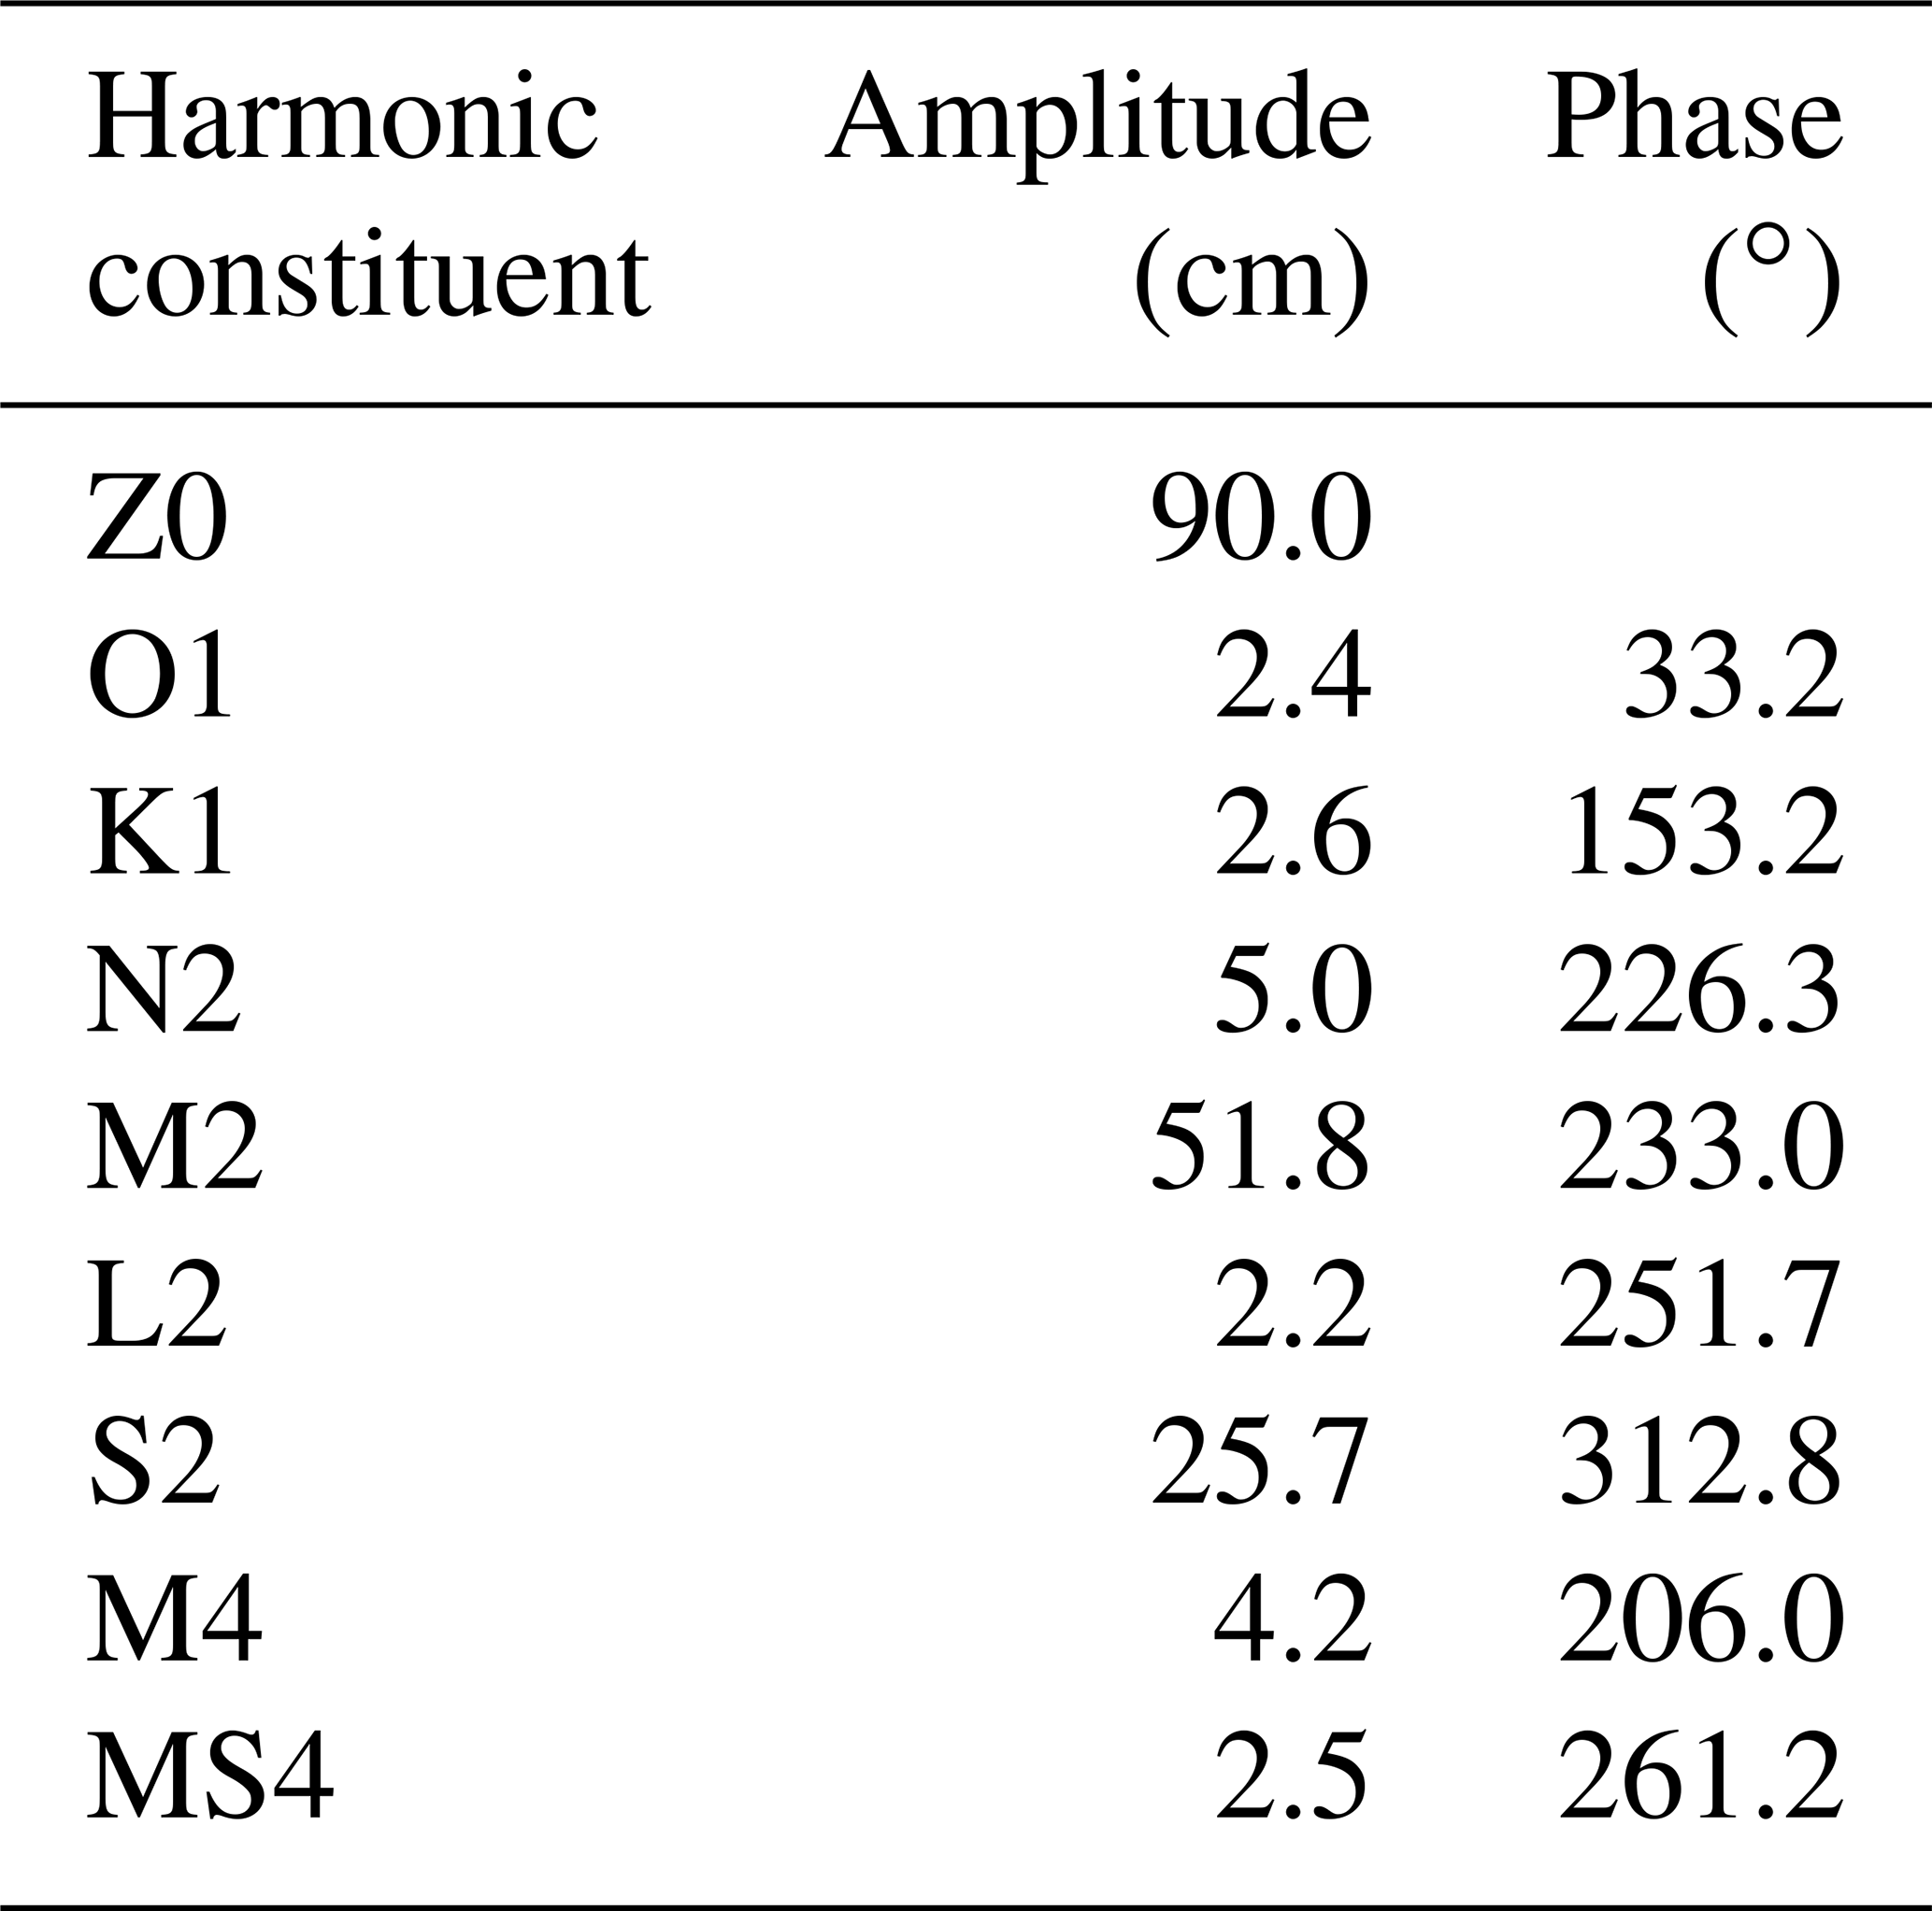
Harmonic analysis, using software based on that of Foreman (1977, updated 2004), of hourly sea level data recorded at Motuara Island (over 8 months during 2022) and Many Islands (44 d during 2017) produced a set of tidal constituents (harmonic constants) for each island.
4.3 Tide predictions
Foreman's software can also be used to combine the amplitudes and phase lags of a location's tidal constituents to create tide predictions for a specified period of time for that place.
Normally, the times of such tide predictions would be in terms of a standard time meridian – for New Zealand today this is 180∘ E, New Zealand Standard Time (NZST). Obviously, Bayly and Wales were not operating in today's time zone regime; however, their recorded clock and apparent times can be converted to local mean time (see Sect. 5.1). To generate tide predictions in terms of local mean time, the phase lags of the modern harmonic constants for Motuara Island and Many Islands were transformed from the standard meridian (180∘) to the meridians of Meretoto/Ship Cove6 (174∘14′ E) and Pickersgill Harbour7 (166∘34′ E). The predicted times then had 12 h deducted to align with the astronomical day (which begins at noon, 12 h after the beginning of the civil day) in order to conform to the time system used by Bayly and Wales. The amplitudes of the tidal constituents for the modern tide stations have been assumed to also be applicable to the historic sites. The amplitudes and phase lag values of the harmonic constants are provided in Appendix B.
Foreman's software has been used to harmonically combine those constants to calculate the times and heights of high and low waters, as well as heights at 10 min intervals for plotting purposes (see Figs. 5, 6, 7, 8, 10, 11, and 12), throughout 1773 at Ship Cove and Pickersgill Harbour.
5.1 A common time system – local mean time
In order to compare the observations made by Bayly and Wales to the predicted data, both datasets must be expressed in terms of the same time system.
As mentioned above (Sect. 3.2 and 3.3), a clock time was recorded for almost every tide gauge observation, with apparent time included whenever the time of high or low water was recorded with a clock time. Whilst the reliability and accuracy of clocks were improving during the 18th century, they were not yet perfect. For this reason, the astronomers were required to attend to the watches and to compare them against apparent time derived from morning and afternoon observations of the Sun as well as against one another. The time kept by the clocks entrusted to Bayly and Wales (they had two time-keepers each) could differ from true time by 1–2 h; thus, the astronomical determinations of time (apparent time) were needed to find the offsets and rates of the clocks.
The rate of apparent time is not uniform due to the varying speed of the Earth in its elliptical orbit around the Sun; thus, this irregularity, known as the “equation of time”, needs to be corrected for. Accordingly, the apparent times of the high and low waters published in Wales and Bayly (1777) were transformed to local mean time by applying the equation of time obtained from an online calculator (PlanetCalc, 2022). By differencing each local mean time derived in this manner and its associated clock time, the clock error at that local mean time could be found. The local mean time of each tide gauge observation could then be calculated by applying the clock error, as well as any correction for clock drift, to the observation's clock time.
The 1773 observations could be compared to the predicted tides as the latter were also expressed in local mean time, as described in Sect. 4.2.
5.2 Sea level heights
As the historic and predicted sea level heights have no common vertical reference, it is not possible to relate the heights of the observed and predicted tides in an absolute way. Therefore, in order to investigate sea level heights, we must turn to comparing tidal ranges as calculated by differencing the heights of sequential high and low waters.
When introducing the gauges erected by Bayly and Wales (Sect. 3.1), it was noted that the zero point of their measurements was seldom near the lowest level to which the water fell.
When Bayly returned to Ship Cove in December 1773, he set up two poles that were offset vertically such that the zero of the higher pole (for measuring high water) was above the pole used for low-water observations. This offset must be added to the high-water readings to bring them into terms with the low-water measurement values.
All of Wales's measurements were made downwards; therefore, these data have been inverted and expressed relative to an arbitrary zero below low water to avoid negative values.
After the historic measurements had been converted to “upward” values, an arbitrary offset was applied to each series of observations to enable the observed and predicted datasets to be plotted together in Figs. 5, 7, 8, 11, and 12.
The following is a detailed description of each of set of observations made by Bayly and Wales as well as a comparison of their measurements to the predictions based on modern data. The first series of observations made by Bayly at Ship Cove, Queen Charlotte's Sound, and Wales at Pickersgill Harbour, Dusky Bay, spanned more than a single spring–neap cycle, whereas their second tide gauge deployments, both at Ship Cove late in 1773, were somewhat shorter in duration.
Figures 5, 7, 8, 11, and 12 present either Bayly's or Wales's observations plotted along with a predicted tidal curve. To avoid repetition in the captions of those figures, the following description applies unless stated otherwise in a caption: red crosses show all sea level observations8 made by either Bayly or Wales with recorded time and height. Wales frequently recorded a single height at low water and several times at high water without noting the time; these observations are represented by green circles in Figs. 5 and 8, plotted according to the predicted time of the relevant low or high water. The predicted tide curve, based on modern data, is shown in blue. Orange and black dots indicate the time of full and new Moon, respectively9, and green lines (Figs. 11 and 12) denote periods when the Moon was above the horizon10. The times of all lunar phenomena have been calculated using Gray (2020). Dates and times are in terms of local mean time, with each day commencing at noon of the corresponding civil day.
Tables A1–A4 in Appendix A list the times and heights (processed as described in Sect. 5.2) of the high and low waters observed by Bayly and Wales, the predicted values, and the differences between the times and the tidal ranges derived from the heights.
6.1 Dusky Bay in April 1773 – Wales
Following the Resolution's arrival in Dusky Bay on 26 March 1773, Wales set about first establishing his observatory, before turning his attention to the tides.
In his journal, Wales describes the construction of his tide gauge as well as the modifications required before measurements could commence. Wales learns a valuable lesson when he finds the gauge to be too short after incorrectly judging the rise and fall of the tide against the shoreline (Wales, 1774, p. 127):
-
3 April. Fixed up a Thermometer & Barometer, and made a machine for trying the Tydes [sic]: It consists of a long square Tube whose internal side is about 3 inches: A square float is fitted to this Tube & fixed to the end of a long slender Rod which is divided into feet and Inches from the float upwards. I propose to put down this rod into the Tube until the float just touches the water & then mark the feet & Inches on the Rod which are even with the top of the Tube: As the water is addmitted [sic] into the Tube only by a small aperture at the bottom the rise and fall of the water occassioned [sic] by the surf will be inconsiderable or at least much lessened.
-
4 April. Fixed up my Tyde-Instrument & began to observe; but to my inexpressible surprize found it too short by many feet: It was about 6 feet long & Several People, amongst whom I was one had all along concluded that the Tydes did not rise & fall more than 4 feet or four feet & an half at most; We judged by the Shore; & I mention this circumstance to shew how erroneous estimations of the rise and fall of the Tydes may sometimes be when made in this manner, as I believe they often are.
-
5 April. Set about a new Tyde-measurer, which I now made 11 feet long.
-
6 April. Finished and fixed up my Tyde Instrument. I placed the bottom of the Tube in the Hollow of a Rock a little below low-water-mark and tyed [sic] its top to a Tree which grew out of the bank & hung over the water.
Wales observed at least one tide every day for the following 3 weeks, measuring either water level height and time before, at and after high or low water, or the height alone at high or low water. In total, he recorded 27 high and 24 low waters, as shown in Fig. 5.
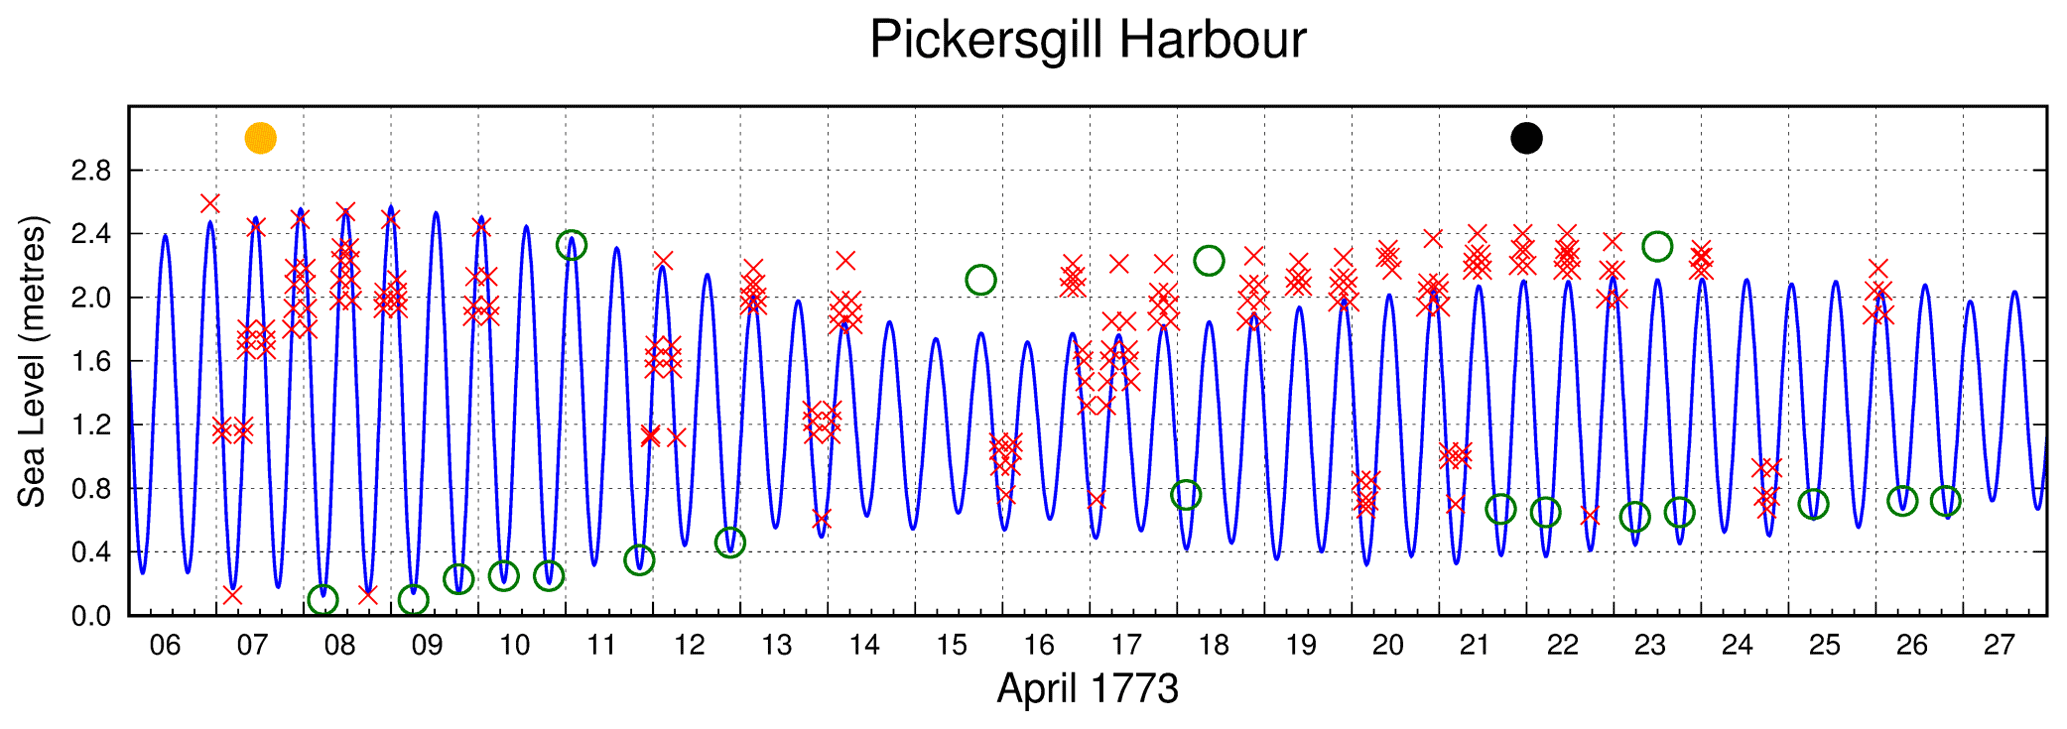
Figure 5Sea level observations made by William Wales at Pickersgill Harbour during April 1773 plotted with a predicted tidal curve based on modern data.
Table A1 lists the observed and predicted times and heights for each high and low water observed by Wales at Pickersgill Harbour as well as the calculated tidal ranges. The table also gives the differences between observed and predicted times and tidal ranges. Of the 32 time differences, only 2 exceed 30 min (both being 39 min), whilst 4 range differences are greater than 20 cm (the largest being 29 cm). These results are testament to the quality of Wales's observations.
In his Resolution log book, Wales notes that “The time of High water on the Full and Change Days was at 10H57′; and they both agreed; but the water rose 8 feet at the former, and only 5 feet 8 inches at the Latter: I cannot account for this difference; but am certain it is not owing to any error in the Observations” (Wales, 1775a, p. 38).
In his journal, Cook commented that the difference “is a little extraordinary and probably was occasioned at this time by some accidental cause such as Winds &ca” (Beaglehole, 1961, p. 138). (In the preceding quote, “&ca” denotes et cetera.)
Wales was right to trust his observations, as the difference in the ranges of successive spring tides is indeed a real feature of the tide in Dusky Sound, as illustrated in Fig. 6.
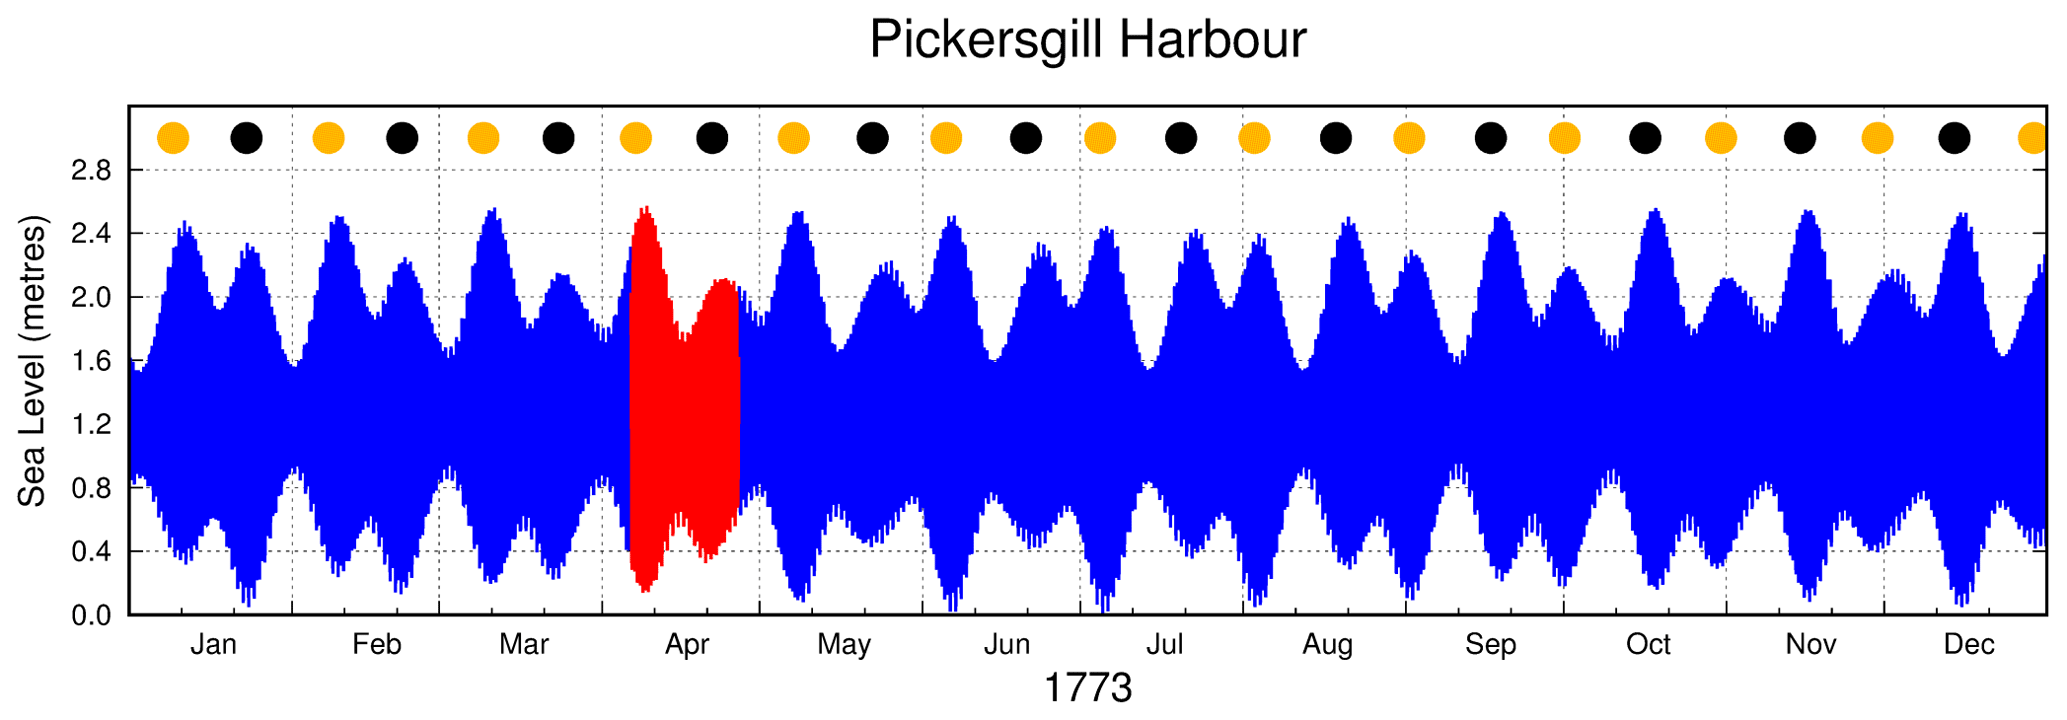
Figure 6The predicted tide curve throughout 1773 at Pickersgill Harbour; the portion in red corresponds to the period when Wales was making his observations.
Whilst the difference between periods of spring and neap tides varies for each month, it was greatest in 1773 during the period that Wales carried out his tide gauge measurements. Furthermore, whilst Wales observed the greater range at full Moon, this is not always the case as can be seen from August onwards when the larger spring tides occur close to new Moon.
Of course, it would be unreasonable to expect that Wales and Cook should have understood the tidal regime in greater detail than the spring–neap cycle. Knowledge of the tides was still evolving in the late 18th century, and the reasons for their variability were yet to be properly understood (Cartwright, 1999).
6.2 Queen Charlotte's Sound in May 1773 – Bayly
In early February 1773, the Adventure, having become separated from the Resolution in the Southern Ocean, made for Queen Charlotte's Sound in accordance with the instructions that Cook had handed to Furneaux (Beaglehole, 1961, p. 683), arriving there on 7 April for what turned out to be a stay of 2 months.
A period of 1 month later, Bayly commenced his tide measurements, observing 20 high waters and 14 low waters in Ship Cove over the following 2 weeks, as shown in Fig. 7.
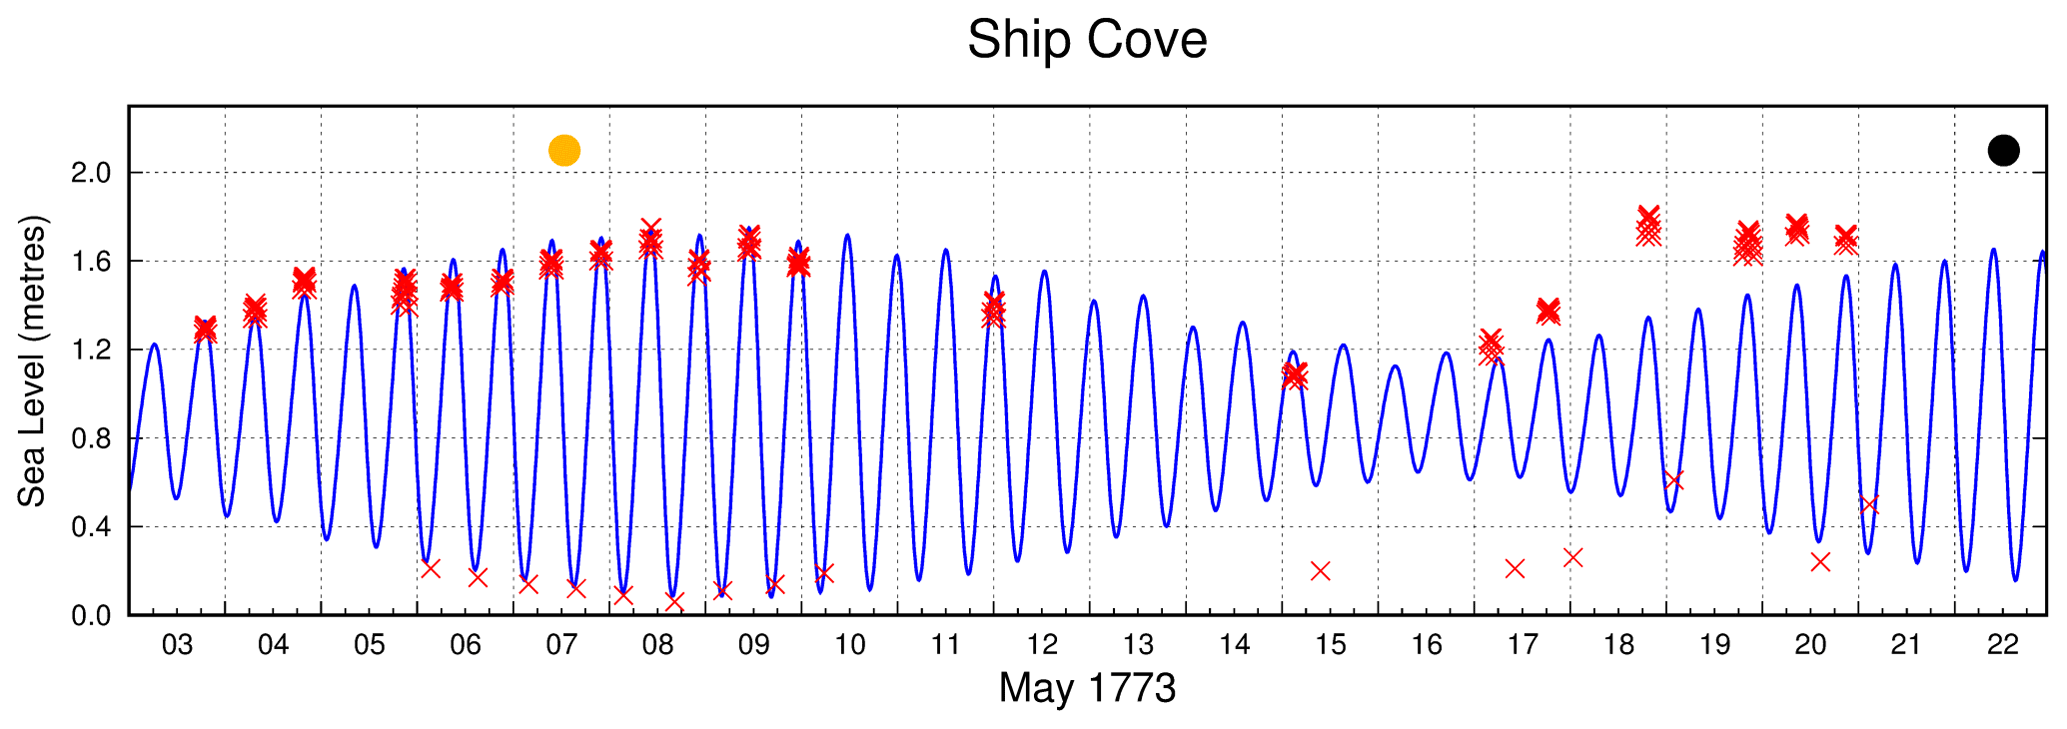
Figure 7Sea level observations made by William Bayly at Ship Cove during May 1773 plotted with a predicted tidal curve based on modern data.
In the Adventure's log book, Bayly describes his tide gauge and the precision to which he was able to measure the water level. A glass tube, 4 ft (1.22 m) long and 0.7 in. (1.8 cm) in diameter, was attached to a long wood rod which was divided into 1 ft, 1 in., and 0.25 in. intervals (30.5, 2.5 and 0.6 cm, respectively) to serve as a scale. The rod was, in turn, attached to a post set firmly in the water. A bamboo cane, with a very small hole, fitted to the tube provided a narrow aperture for admitting the water into the glass tube. The tube performed admirably as a stilling well, and Bayly found that he could read the height of the water in the tube to 0.25 in. (∼6 mm), or better, and that the water level fluctuated no more than 0.1 in. (∼2.5 mm) even as the sea rose and fell by 1 ft (∼30 cm) due to wave action (Bayly, 1774b, p. 36).
Table A2 lists the observed and predicted times and heights for each high and low water observed by Bayly at Ship Cove during May 1773 as well as the calculated tidal ranges. The table also gives the differences between the observed and predicted times and tidal ranges. Whilst a significant number (41 %) of Bayly's time differences are greater than 30 min, this is not necessarily indicative of careless work. With a relatively small tidal range at this location (spring tide: ∼1.6 m; neap tide: ∼0.5 m), the change in water level within 30 min of high or low water at spring and neap astronomical tides is less than 30 and 10 mm, respectively. Estimating the true time of high or low tide under such circumstances would not be easy. Although most (18) of Bayly's tidal range differences are less than 15 cm, differences of 30–60 cm between 17 and 20 May are clearly evident in Fig. 7. These results can not be explained, as Bayly noted that the weather during this period was either “quiet and serene”, “calm and serene”, “good”, “calm”, or “fine”, with sea conditions described as being “still”, “undisturbed”, or “smooth”.
Having meanwhile sailed from Dusky Bay, the Resolution regained the company of the Adventure at Ship Cove in Queen Charlotte's Sound. Prior to both vessels departing for the South Pacific on 7 June, Cook wrote at length in his journal regarding this stopover at Ship Cove, including the following:
Mr Bayley commun[i]cated to me … High-Water at the full and change of the Moon at 9 o'Clock & the greatest rise perpendicular; … Tides are confirmable enough to the like observations I made when I was here in Janry 1770, … (Beaglehole, 1961, p. 173).
This claim that the greatest tidal range is 6 ft 6 in. (1.98 m), referred to as “” in the quoted material above, is curious. According to Bayly's observations log, the greatest range, on 8 May 1773, was 5 ft 6.6 in. (1.69 m) (Bayly, 1774b, p. 36). The predicted tide range on this date is 5 ft 4 in. (1.63 m), which is in close agreement with his measurements that day. It would seem that Cook did not misquote Bayly, as Bayly wrote “6Ft..5In perpendicular” in his Adventure log book (Bayly, 1774a, p. 63). Modern sea level data show the largest astronomical range at Motuara Island to be 5 ft 9 in. (1.76 m); Bayly's observations fall within this range, although not the conclusion in his log.
Cook had spent 3 weeks at Ship Cove during his first voyage to the Pacific on the Endeavour and found that the tides “flow 9 or 10 oClock at the full and change of the Moon and rises and falls upon a perpendicular 7 or 8 feet”. (Beaglehole, 1955, pp. 246–247). As noted in Woodworth and Rowe (2018), there is no information on how Cook made his tidal observations on the Endeavour voyage but, by whatever method he employed, Cook's range is clearly overstated. Nevertheless, he welcomed Bayly's (overstated) result as bestowing some degree of confirmation of his own.
6.3 Queen Charlotte's Sound in November 1773 – Wales
After voyaging in the South Pacific and spending time in Tahiti, the Resolution returned to Queen Charlotte's Sound on 3 November 1773 and stayed at Ship Cove for 3 weeks. Wales commenced water level measurements on 13 November and, over the next 8 d, made detailed observations of 10 high waters and untimed water level readings of one high and 11 low waters, as shown in Fig. 8.
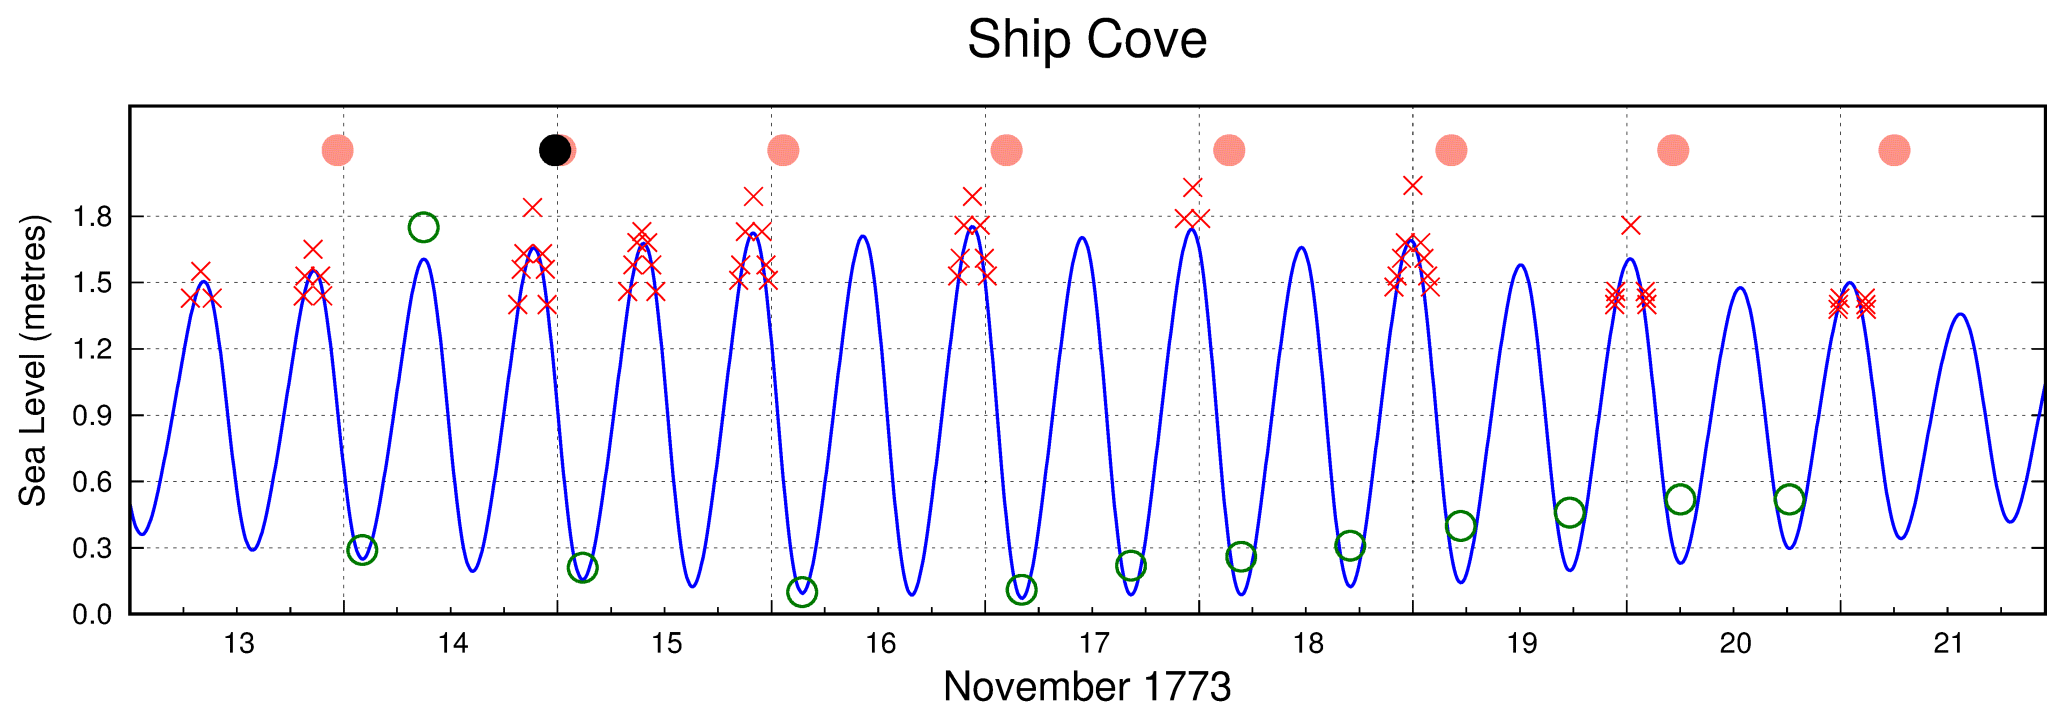
Figure 8Sea level observations made by William Wales at Ship Cove during November 1773 plotted with a predicted tidal curve based on modern data. Salmon-coloured dots indicate the time of lunar transit; dates and times of lunar transit, as calculated using Gray (2020), are given in Table C3 in Appendix C; and the black dot is new Moon.
Table A3 lists the observed and predicted times and heights for each high and low water observed by Wales at Ship Cove during November 1773 as well as the calculated tidal ranges. The table also gives the differences between the observed and predicted times and tidal ranges. The greatest time difference is 19 min and the largest range difference is 17 cm – these results are commendable.
As mentioned earlier (Sect. 3.1), Wales's rectangular wooden tube was stolen from him in Tahiti; therefore, his “observations were made by means of two posts, divided into feet and inches, from their tops downwards” at Ship Cove (Wales and Bayly, 1777, p. 64). Wales does not explain the need for two posts and, as their tops were set level, the second one would seem to be quite unnecessary.
Wales (1775a, p. 69) states the following:
I further found that the time of High-water preceeded [sic] the moon's transit over the meridian by 3 Hours, and the greatest rise of the Water whilest I was here was 5 feet & 10 Inches; but there were evident tokens on the Beach of the Water's having risen full 2 feet more than that, since we were here before.
Wales's determination of the rise agrees with Bayly's assessment 6 months earlier and the predictions, as discussed in the previous section. However, the higher line of tokens (possibly referring to driftwood) on the beach would most likely have been driven there by wave action, not the astronomical tide. Perhaps it was evidence similar to this (i.e. driftwood) that led Cook, in 1770, to believe the rise was 7 or 8 ft. (2.13 or 2.44 m, respectively). The line of driftwood is still used today as an indicator of tidal inundation, although with due caution as the line is almost always landward of the actual high-water line.
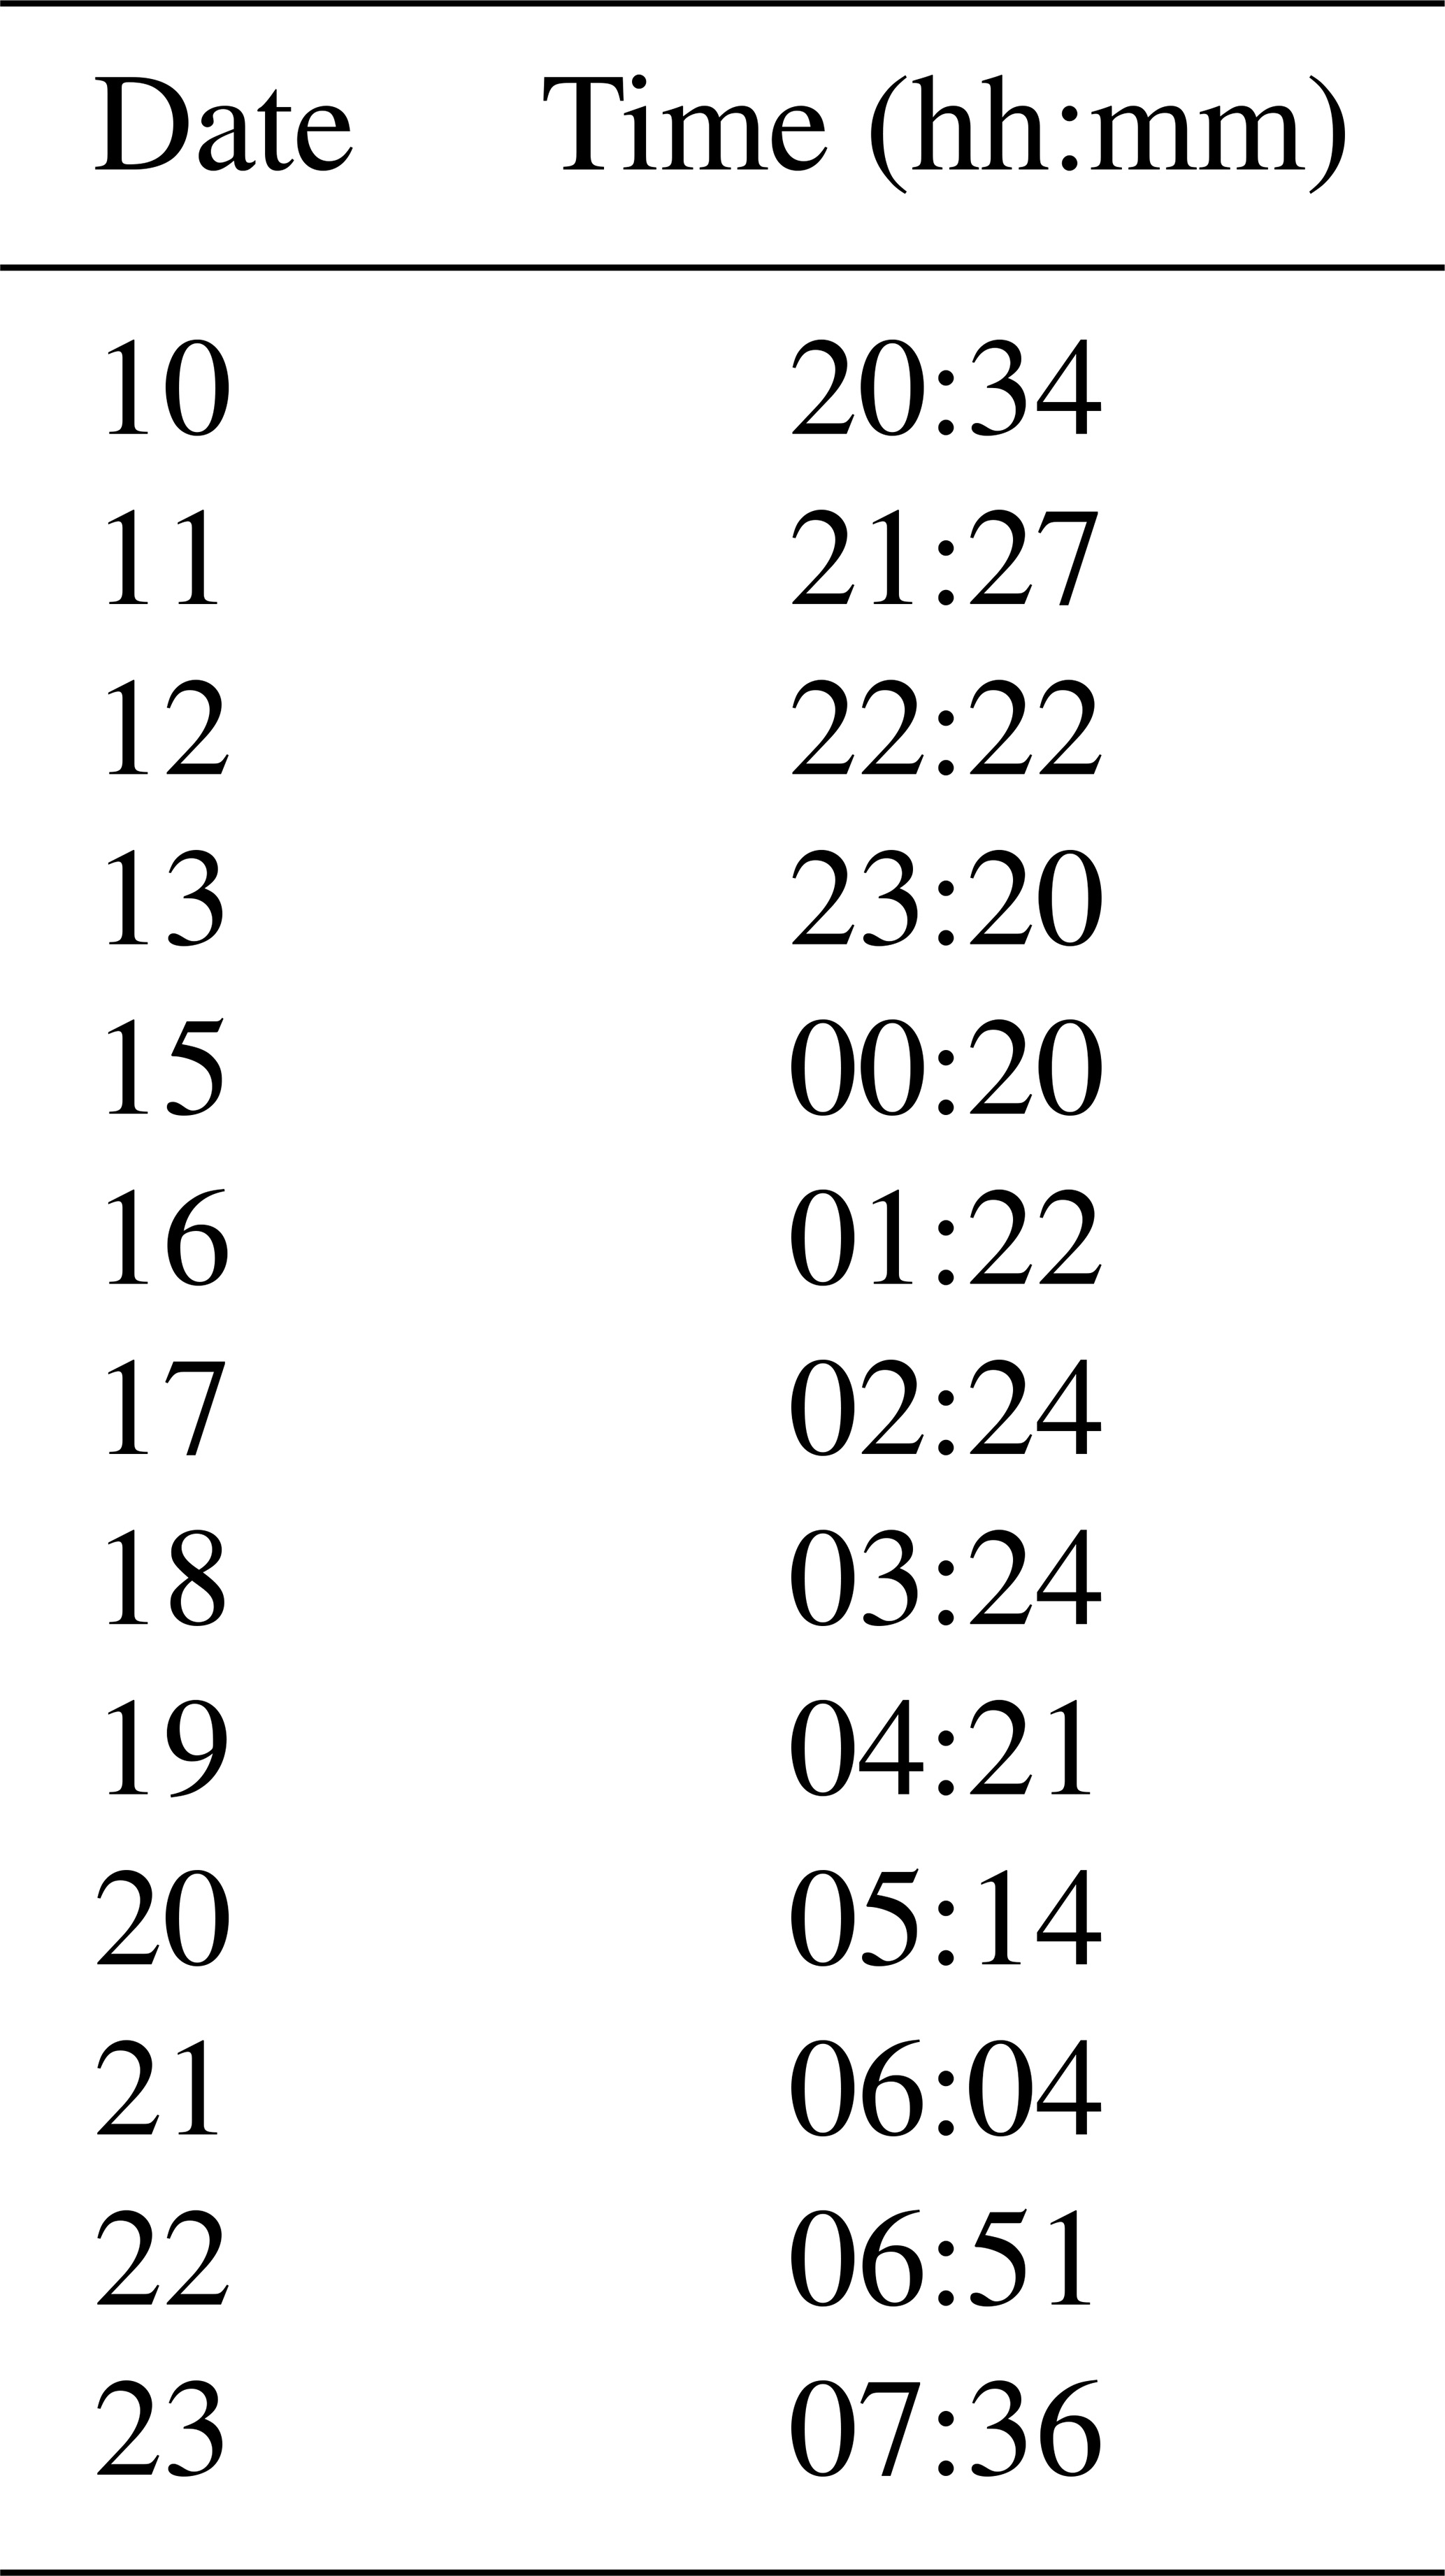
To explore Wales's statement about the interval that high water preceded lunar transit, Table 2 lists his times of high waters prior to lunar transit, lunar transit time, and the time difference between these two events. Lunar transit times have been calculated using Gray (2020); see Table C3 in Appendix C. The average difference of 3 h 53 min is 1 h longer than Bayly found it to be.
Table 2Local mean times of high water and lunar transit as well as the interval between tide and transit.
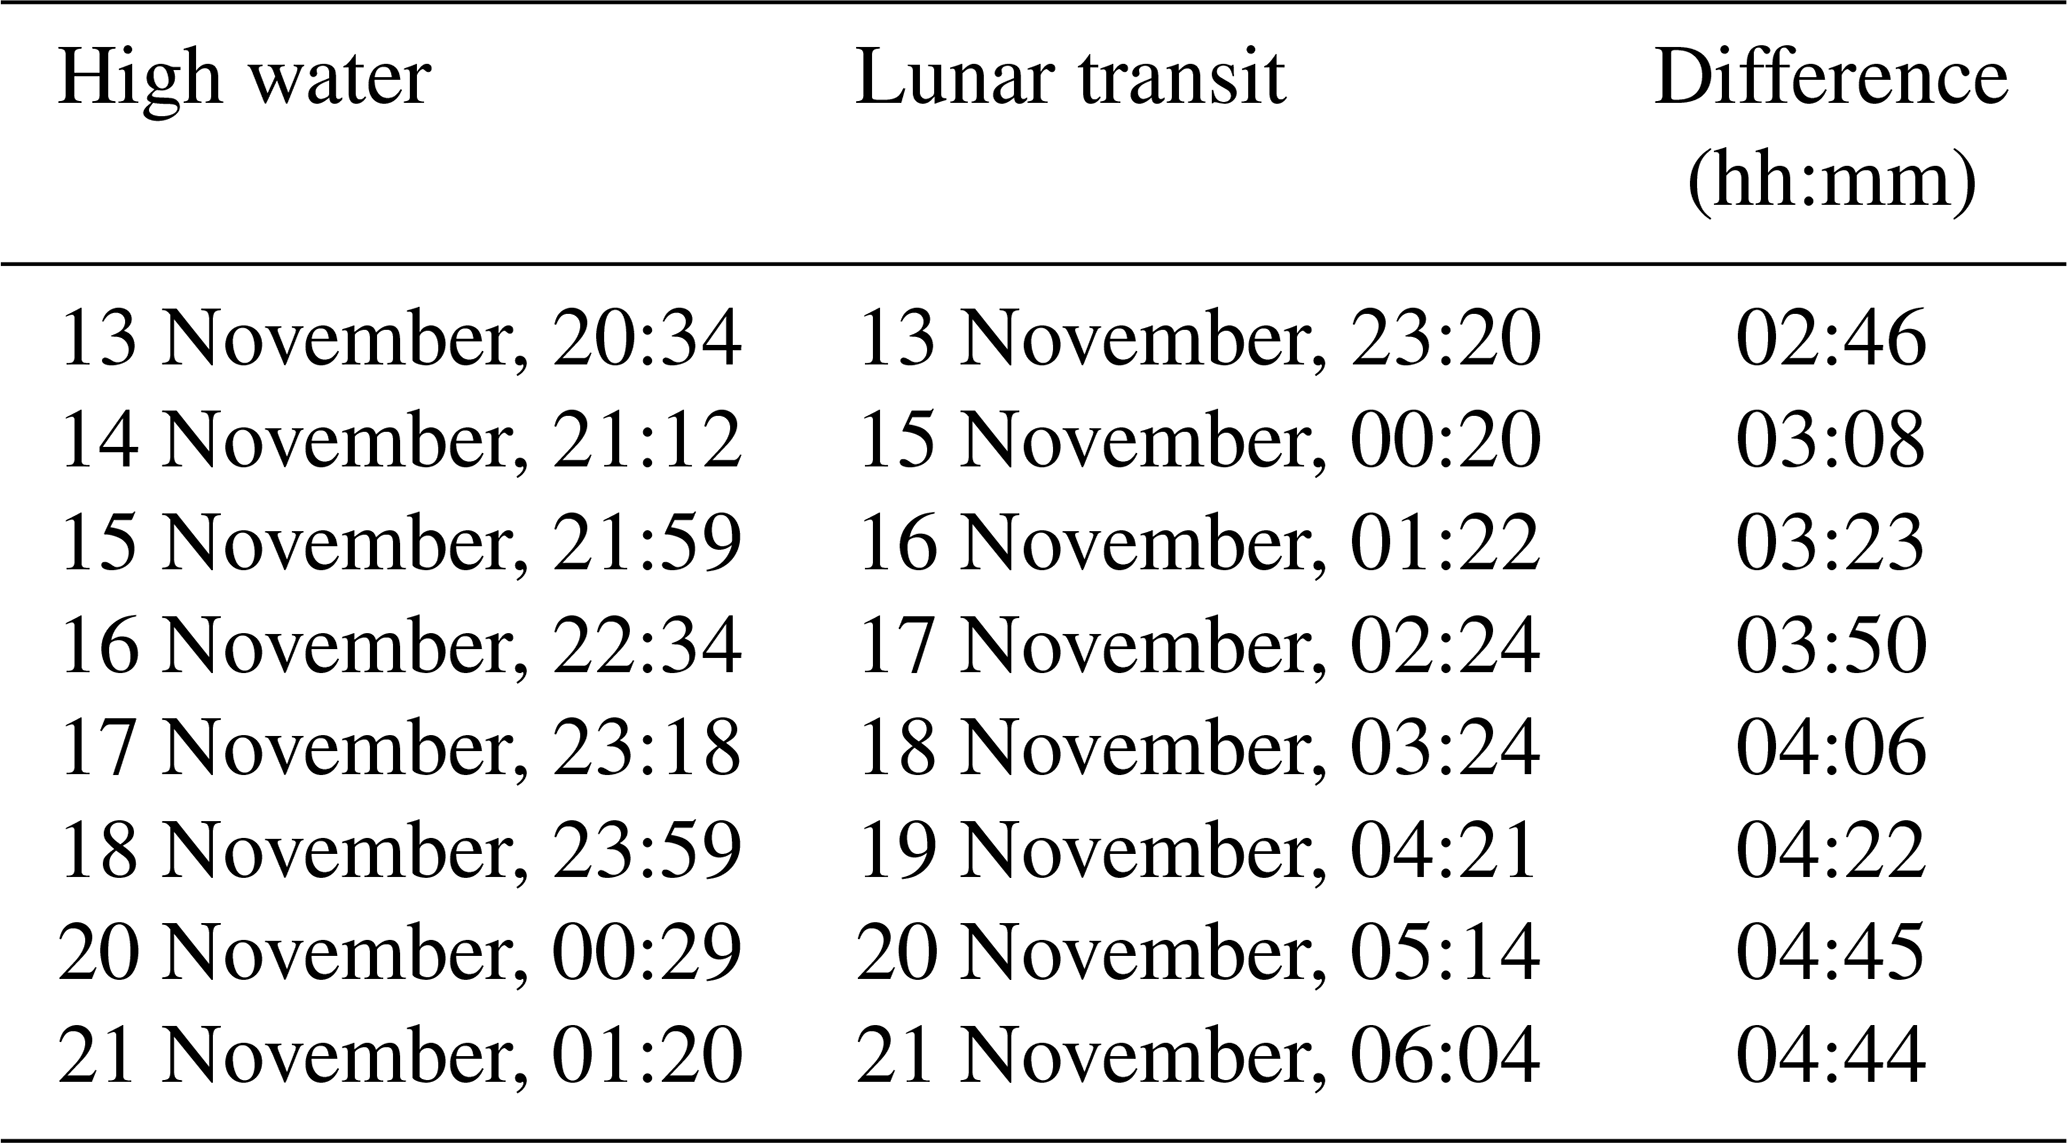
Wales also made the following remark:
In these 8 Days the time of High-water has advanced only 4H,,44′: it ought, I conceive, to have advanced 6H,,40′: whatever may have been the Cause of this, I am certain it arises not from an error in the Observations, although circumstances did not admit of my making them with so much Accuracy as might be wished. (Wales, 1775b, p. 305).
Figure 9 shows Meretoto/Ship Cove (red dot) situated near the northern entrance to Queen Charlotte Sound/Tōtaranui, beyond which lies Cook Strait which separates New Zealand's North Island from the South Island. The sound is a drowned river valley that extends more than 30 km south-westward and connects to Tory Channel/Kura Te Au, another drowned valley, which heads eastwards and also connects to Cook Strait.
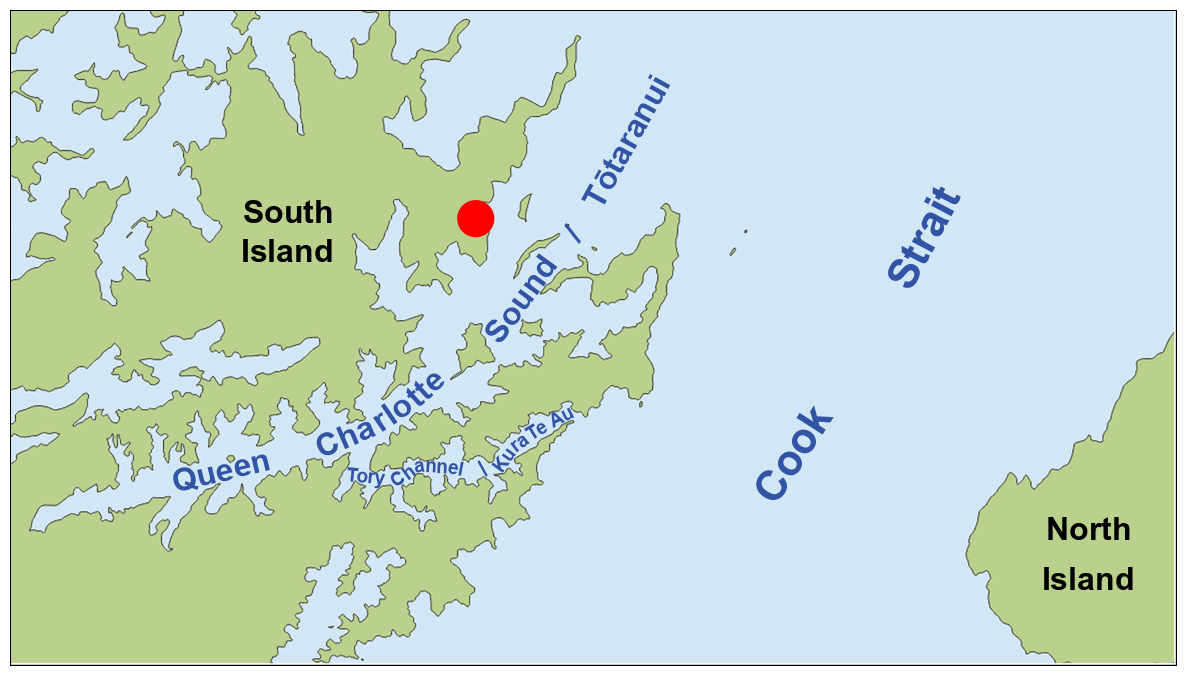
Figure 9Map showing the location of Meretoto/Ship Cove (red dot), the connected waterways Queen Charlotte Sound/Tōtaranui and Tory Channel/Kura Te Au, and Cook Strait separating New Zealand's North and South Islands. (The map is based on coastline polygon from LINZ Data Service at https://data.linz.govt.nz, last access: 30 August 2022).
The flood and ebb of the tide through this region are affected by the complex nature of these waterways (Heath, 1977). One of the consequences of this regime is the variability in the interval between tides. Wales's expectation that the advance of high water over 8 d should have amounted to 6 h 40 min was based on the length of a lunar day being 50 min longer than a solar day.
Figure 10 shows that the daily progression of high waters throughout 1773 oscillated from 29 to 119 min because of the role of tidal constituents other than the predominant lunar semi-diurnal tide (M2); thus, the interval can be as short as 24 h 29 min or as long as 25 h 59 min. The mean and median daily advance times are 51 and 40 min, respectively. Wales's 8 d of measurements fell within a period when the daily progression was near the low end of its range (as indicated by the part of the curve coloured red) with the average over those days being less than that expected, hence his concern about the accuracy of his observations. We, however, know that the effect is real and that it was the quality of his work that detected the phenomenon which led Wales to question his abilities. Had Wales commenced observations a few days earlier, he would surely have been surprised that the daily advance was twice that expected.
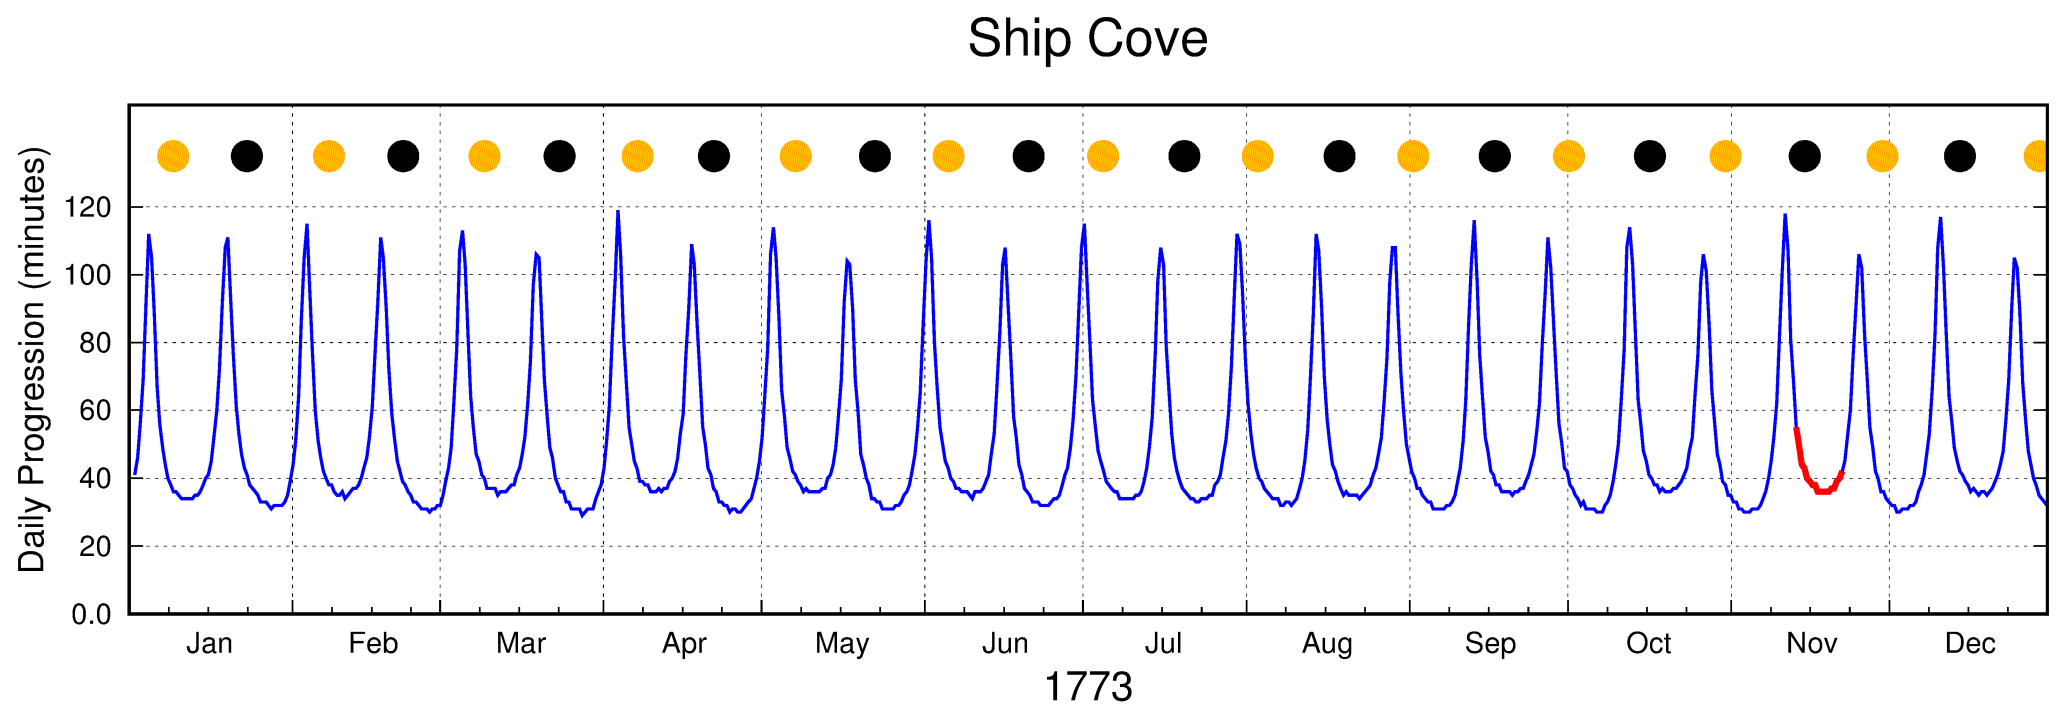
Figure 10The predicted daily progression of high waters throughout 1773 at Ship Cove; the portion in red corresponds to the period that Wales was making his observations.
On 25 November, the Resolution set off to explore higher latitudes during the summer before retreating to the tropics for much of 1774. After calling at the Marquesas Islands, Tahiti, New Hebrides, and New Caledonia, Cook brought the Resolution back to Ship Cove in October 1774 for a 3-week stopover before departing for England via Cape Horn. Although Wales carried out a considerable number of astronomical observations during this sojourn, no further tide measurements were made.
6.4 Queen Charlotte's Sound in December 1773 – Bayly
Towards the end of October 1773, the Resolution and Adventure became separated off the east coast of the North Island of New Zealand. Furneaux had great difficulty in getting to Ship Cove, the agreed rendezvous location should the ships part company (Beaglehole, 1961, p. 689), eventually arriving several days after Cook had departed. The ship's company set about refitting the Adventure, restocking water and wood, and preparing to depart for England on 23 December.
Bayly's tide observations during this stay, carried out over a period of just a few days, comprised only three high waters and their following low waters, as shown in Fig. 11. Bayly set up two posts at different heights and measured the vertical offset of their zero marks to be 4 ft 0.75 in. (1.24 m). The posts were, in effect, one gauge in two parts: one for high water, the other low water. The offset distance had to be added to the high-water readings to obtain values consistent with the low-water observations.
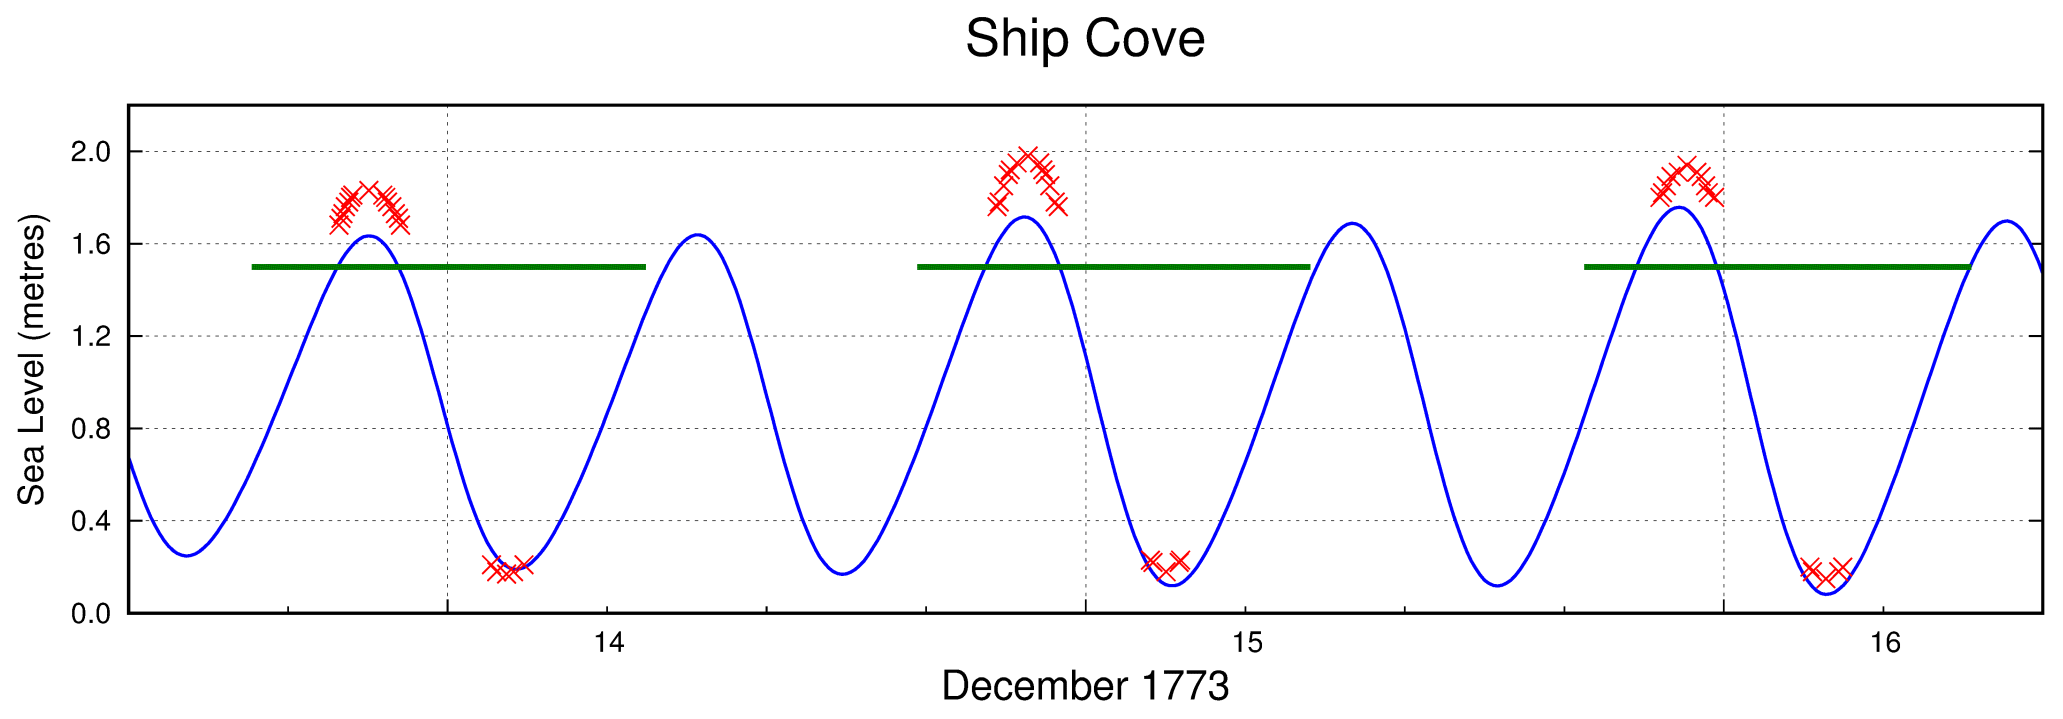
Figure 11Sea level observations made by William Bayly at Ship Cove during December 1773 plotted with a predicted tidal curve based on modern data and with lines indicating when the Moon was above the horizon.
Bayly noted the following:
Here follow a few observations on the Tides at the bottom of Ship Cove where I was obliged to set up two posts one for to observe high water at, & the other to observe low water at, where nothing (on the Scale of my Tide Instrument) was always fixed to a notch or stroke across each post, this notch on the post at high water was just 4:0 above the level of the notch on the post at Low water; therefore nothing on the Scale at high water was so much above nothing on the Scale at Low water (Bayly, 1774b, p. 58).
(In the preceding quote, “4:0” denotes 4 ft 0.75 in.)
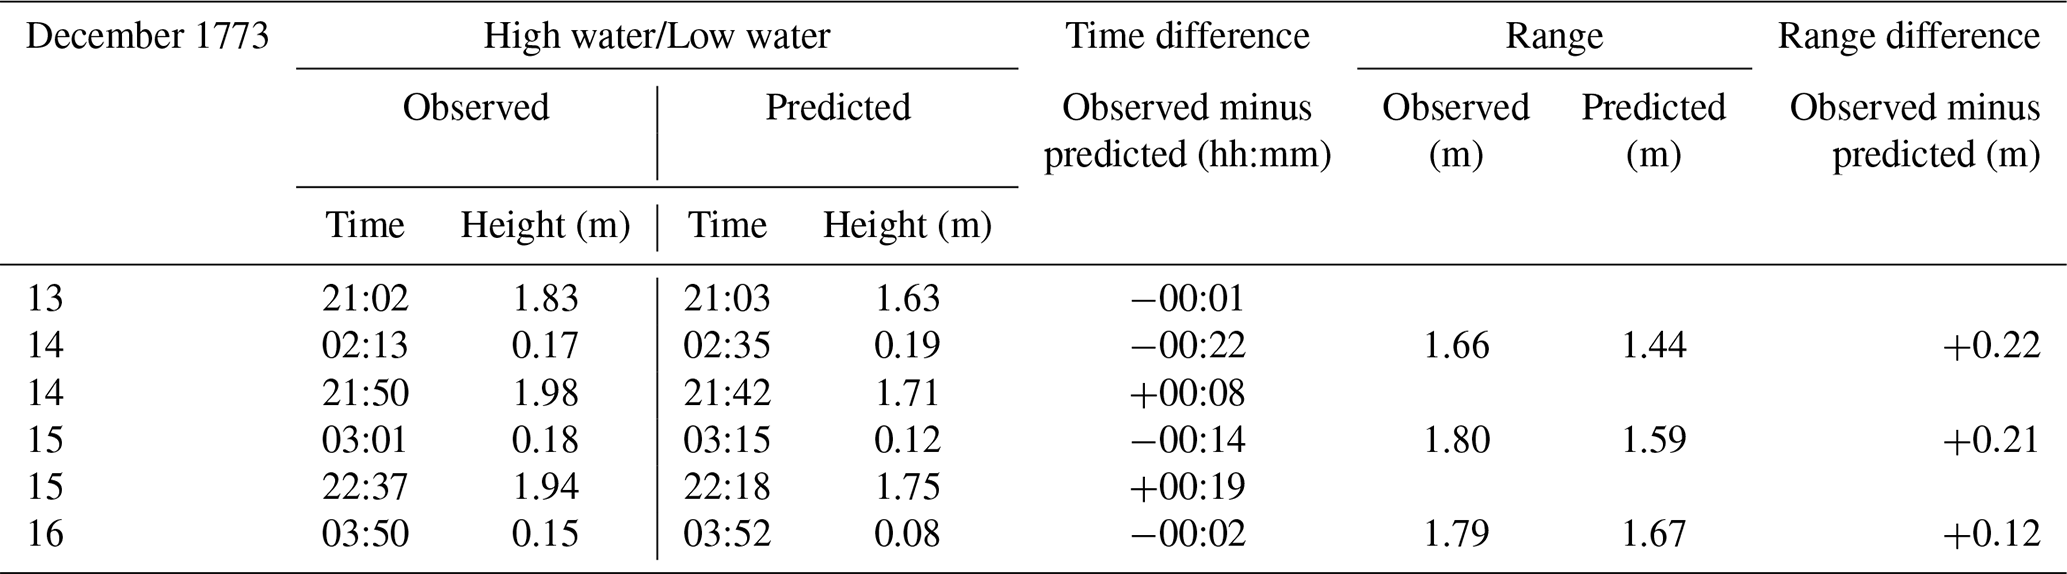
Table A4 lists the observed and predicted times and heights for each high and low water observed by Bayly at Ship Cove during December 1773 as well as the calculated tidal ranges. The table also gives the differences between the observed and predicted times and tidal ranges. The greatest of the six time differences is 22 min, and the three range differences are 22, 21, and 12 cm. It would not be appropriate to draw any conclusions from this small sample.
Bayly also noted the following:
The water seemed to rise about 6 Inches higher when the Moon was above the horizon than when she was below it. Being obliged to fix my posts at some distance from the Tents, rendered it unsafe to observe the night Tides (ibid.).
When he had visited Ship Cove earlier in the year, Bayly noted, alongside his water level measurements, when the Moon was above the horizon, but he did not repeat this practice with his second set of observations. Bayly's proposition that higher tides are somehow correlated with the presence of the Moon in the sky could not have arisen from this visit, as the Moon was above the horizon for all high waters that he observed, as shown in Fig. 11. Was this idea based on the observations Bayly made during his earlier time at Ship Cove? Figure 12 shows periods when he observed consecutive high waters during that visit.
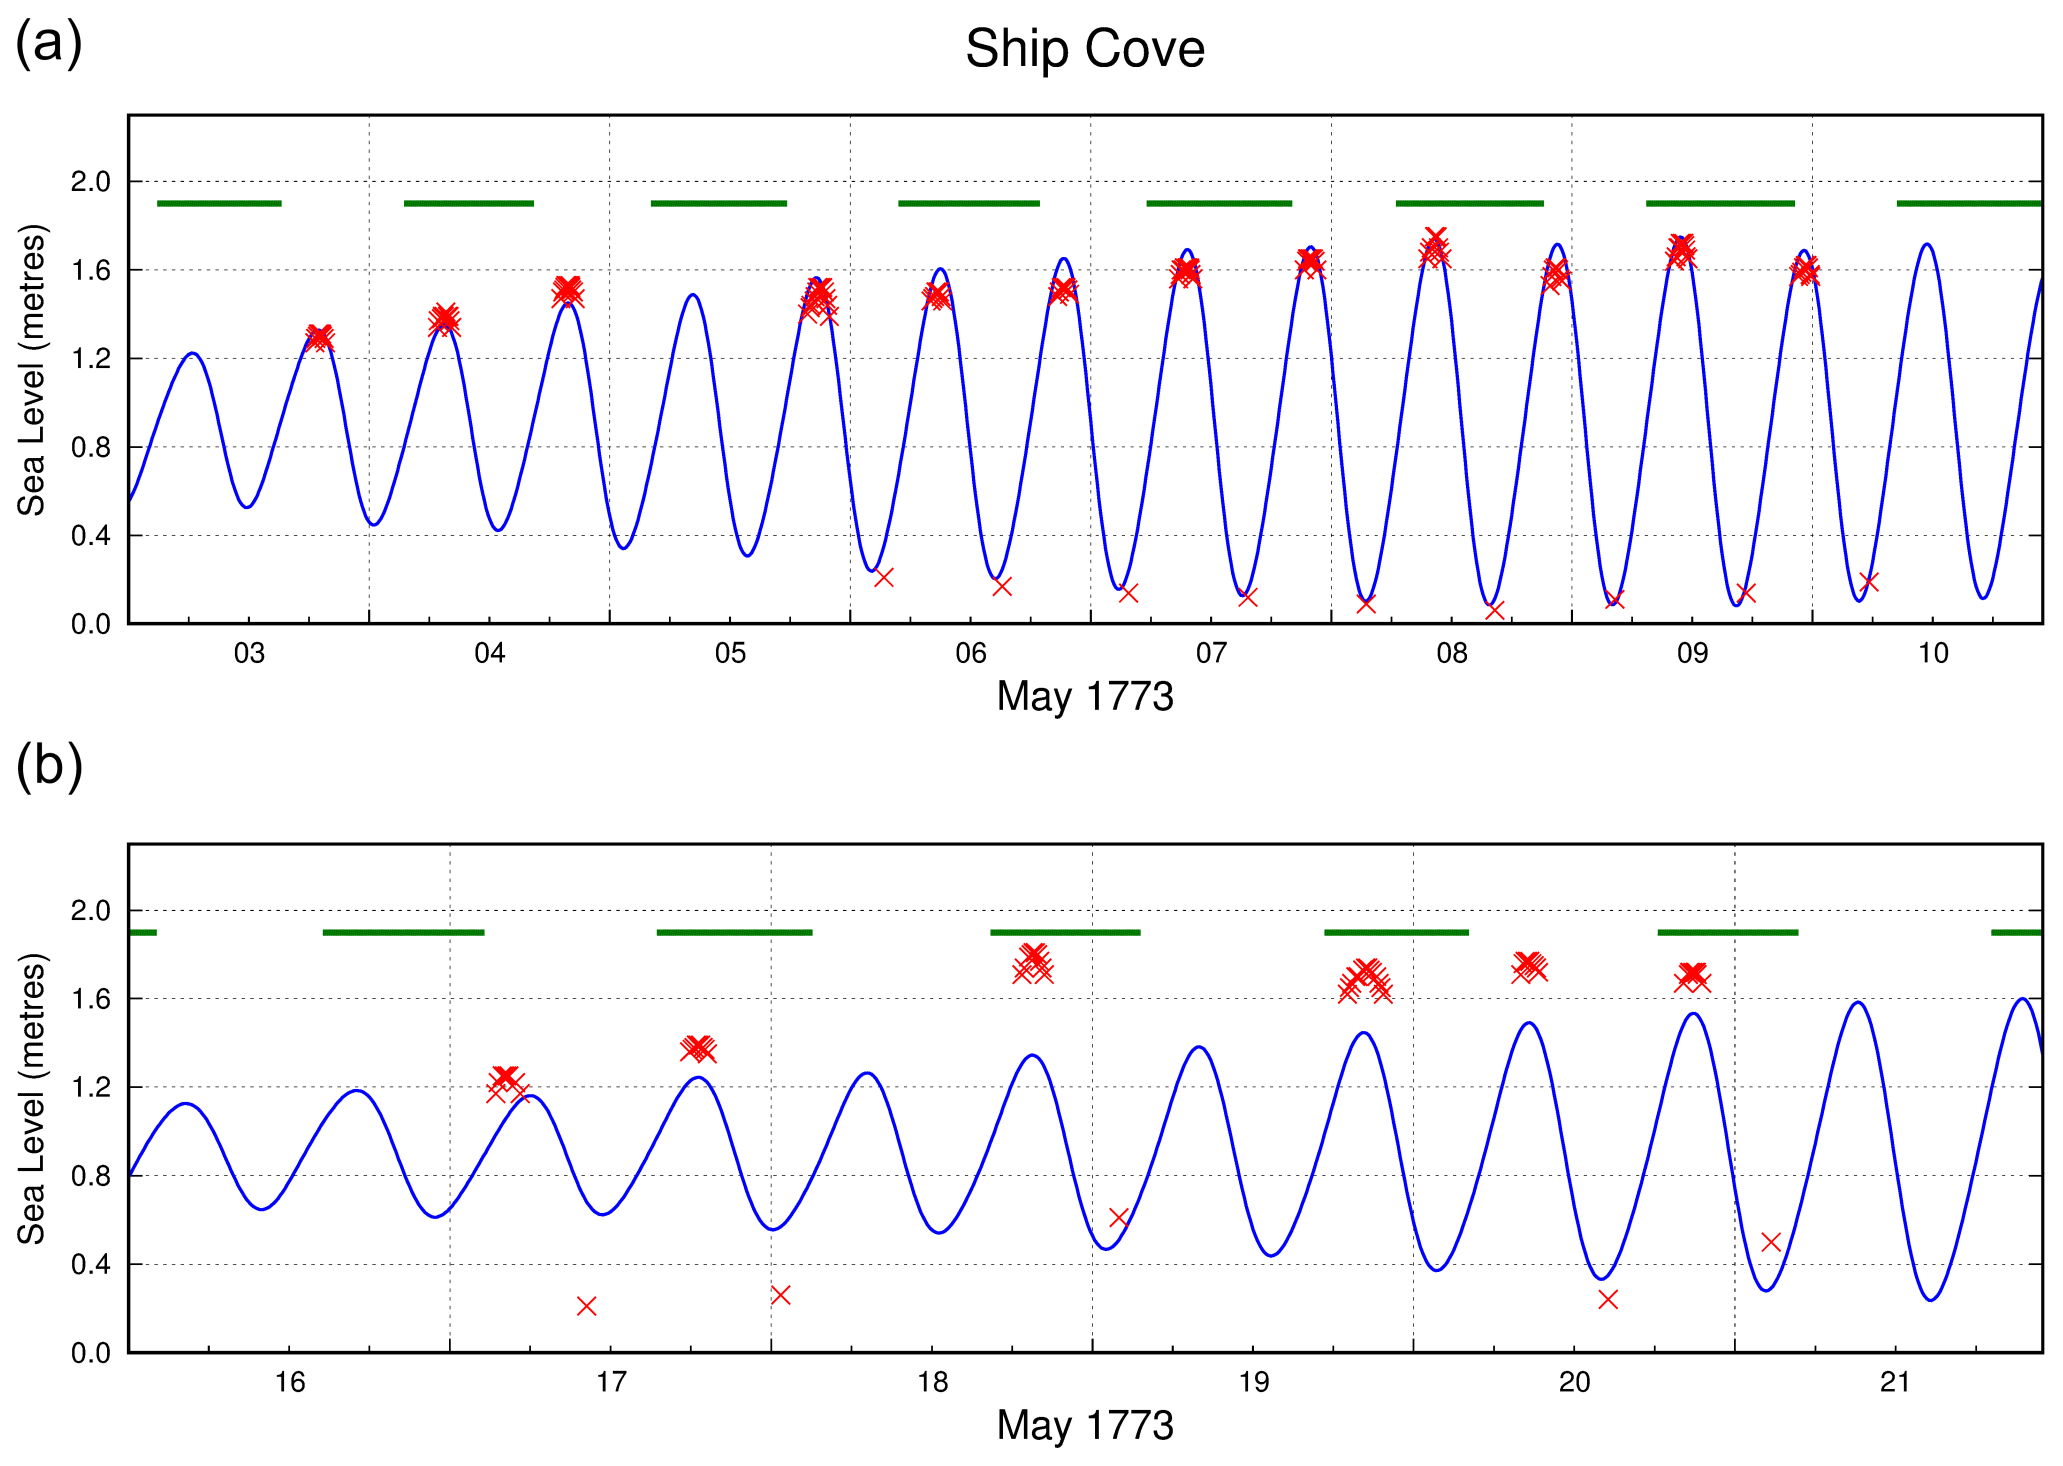
Figure 12Sea level observations made by William Bayly at Ship Cove during May 1773 plotted with a predicted tidal curve based on modern data and with lines indicating when the Moon was above the horizon.
Between 3 and 7 May, the tidal range was increasing from neap towards spring; hence, it follows that each high water would be higher than the preceding one, so Bayly's hypothesis could not have been based on those observations. Spring tides occurred on 8 and 9 May and, indeed, the diurnal inequality has the higher tide both days when the Moon is visible. The height differences, by Bayly's measurements, were 5.6 and 4.5 in. (14.2 and 11.4 cm, respectively).
During the latter part of his time series, Bayly's observations not only became sparser, as shown in Fig. 12b, but once again they occurred as the tide was progressing from neap towards spring. Although it appears that his premise holds true on 17 and 20 May, this is more likely due to the neap-to-spring transition than the presence of the Moon in the sky.
This paper has investigated the quality of the sea level measurements made by astronomers William Bayly and William Wales in New Zealand during Cook's second voyage to the Pacific by comparing those observations with hindcast predictions based on modern data. These comparisons assume, firstly, that the tides have not changed materially during the intervening period and, secondly, that the observed tides were not affected by any meteorological conditions prevailing at the time. Whilst the former assumption is considered reasonable, Cook's bathymetric data are either too sparse (only 12 soundings in Dusky Bay), or non-existent (in Queen Charlotte's Sound), to test this hypothesis.
Comparisons of individual high and low waters have been made possible because Bayly and Wales employed tide gauges for their sea level measurements, which was the first time this type of instrument had been deployed in New Zealand. This is in contrast to the lack of information about how Cook made his tidal observations to estimate spring range and high water full and change during his first voyage to this part of the world (Woodworth and Rowe, 2018).
Of the 83 observed tides, the difference between observed and predicted tide times exceeded 30 min on 16 occasions, 6 of which were equal to or greater than 1 h with a maximum of 1 h 51 min. Whilst Table A2 shows that almost all (14) of the time differences greater than 30 min were found in Bayly's observations at Ship Cove during May 1773, this does not necessarily suggest that his work was in any way inferior. With a relatively small tidal range at this location (spring tide: ∼1.6 m; neap tide: ∼0.5 m), the change in water level within 30 min of high or low water at spring and neap astronomical tides is less than 30 and 10 mm, respectively, making it a challenge to ascertain the true time of high or low tide.
The comparisons show that the majority (82 %) of the differences between the observed and predicted ranges of consecutive tides were less than 20 cm. The largest of the differences (30–60 cm), clearly evident in Fig. 7, can not be explained, as Bayly's notes show that good weather and sea conditions prevailed during this period of greater differences (17–20 May).
There is a growing awareness that tide observations accumulated over many decades, or shorter periods a similar period apart, provide an opportunity to investigate possible long-term tidal changes (e.g. Haigh et al., 2019). With almost 250 years separating Bayly's and Wales's measurements and our modern sea level datasets, the possibility that insights into any tidal changes might be gained from analysing these data has some appeal. However, on close inspection, it is evident that the historical data are unable to be applied to such a study. This is not a criticism of the astronomers' work; their focus was to gather information for navigation, primarily to determine when high water could be expected and the range of the tide. They had no need to relate their sea level heights to a fixed terrestrial mark that future measurements might also reference (should the mark survive in the meantime). Furthermore, to go beyond the simple comparative analysis of tide ranges presented in this paper would require many months of data from 1773, ideally at regular intervals (e.g. hourly) which, given the nature of Cook's voyage, was never a possibility.
Whilst the sea level observations made by Bayly and Wales are of little scientific value today (but would have provided valuable information for mariners, in the absence of further observations meanwhile, until the mid-20th century), their historical significance as the first tide gauge measurements in New Zealand is undisputable. This study has shown that the quality of their work was of at least a high standard. This is perhaps not surprising because, although it is not known how much training and experience they had in making sea level measurements prior to the voyage, as astronomers they would most certainly have been skilled in the art of observing and the use of instruments to make measurements.
To celebrate the 250th anniversary of the earliest tide gauge measurements of sea level made in New Zealand, this paper has, for the first time, cast a light on this aspect of the non-astronomical work undertaken by Bayly and Wales during Cook's second voyage.
The tables in Appendix A list the times and heights of the high and low waters observed by Bayly and Wales in New Zealand during 1773. The times of the observations are given in terms of local mean time, as derived according to the method described in Sect 5.1. The observed heights have been processed as described in Sect. 5.2 and converted to metres. The predicted times are also in terms of local mean time (see Sect. 4.2), whilst chart datum (lowest astronomical tide) is the reference for the predicted heights. Tidal ranges have been calculated where a high and its immediately following low water, or a low water and its following high water, were observed.
Table A1High and low waters observed by Wales at Pickersgill Harbour during April 1773, corresponding predicted values, and differences between the times and tidal ranges derived from the heights. The reader is also referred to Fig. 5 for more information.
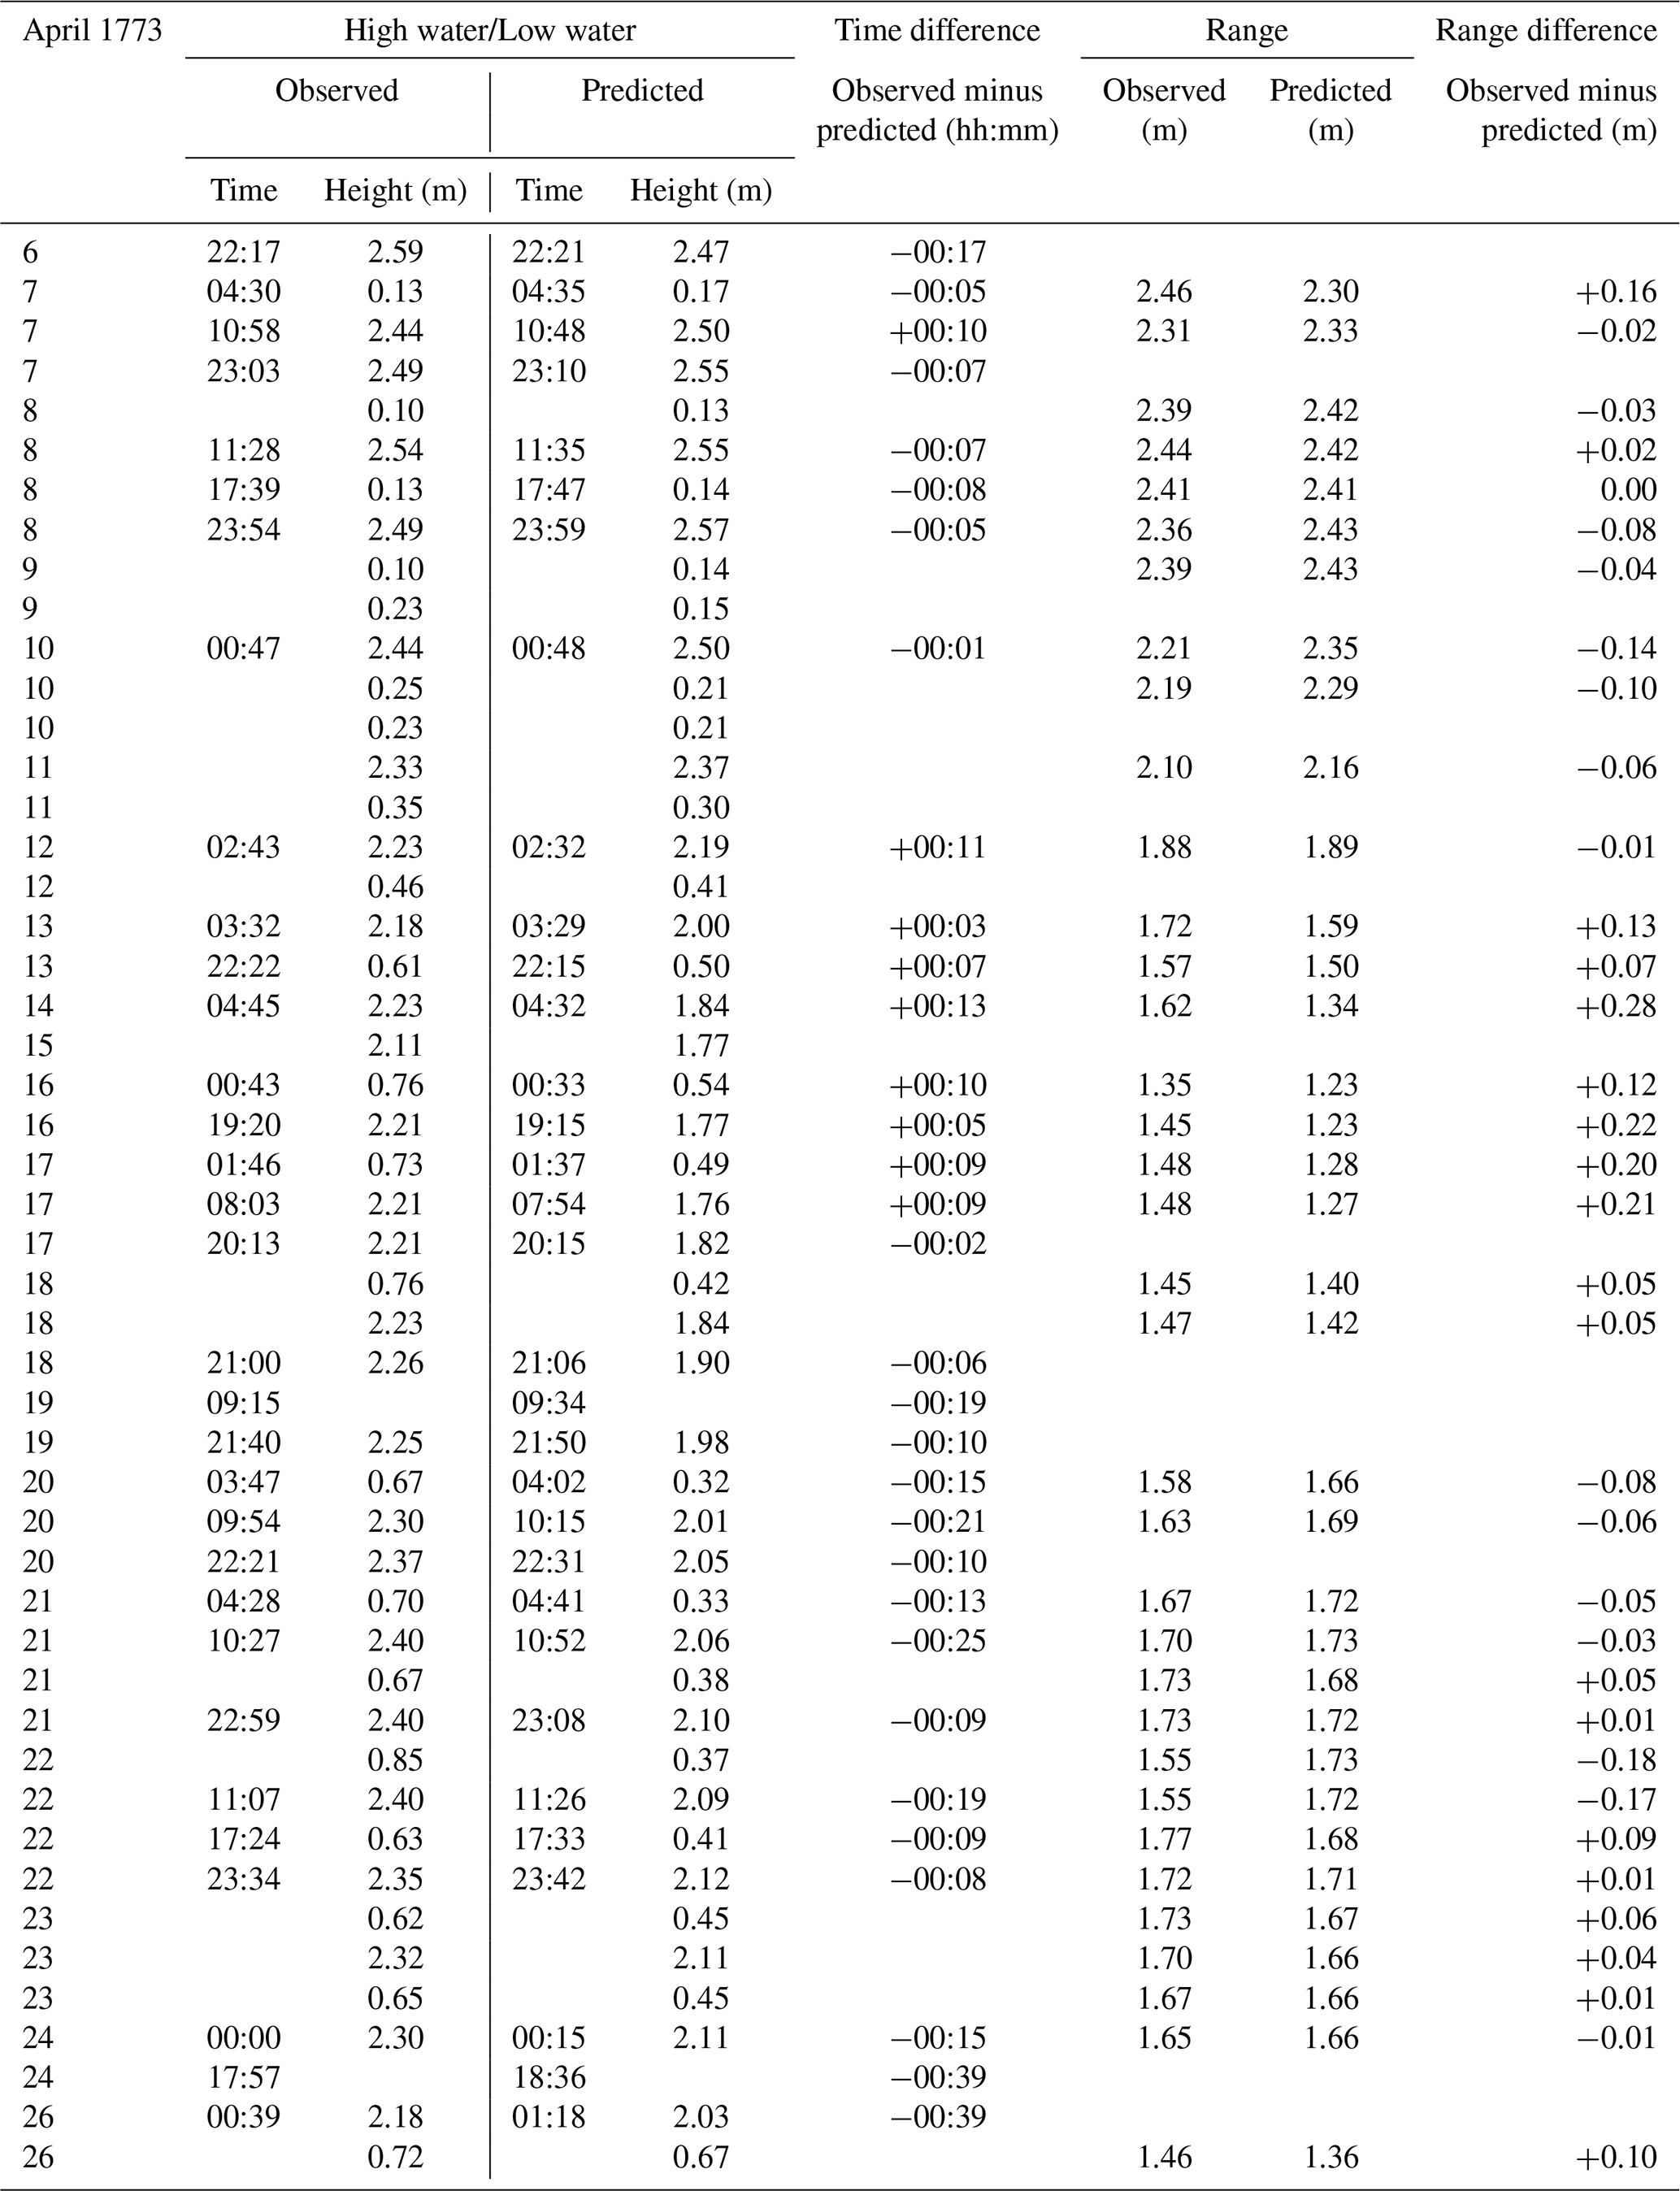
Table A2Details of high and low waters observed by Bayly at Ship Cove during May 1773, corresponding predicted values, and differences between the times and tidal ranges derived from the heights. The reader is also referred to Fig. 7 for more information.
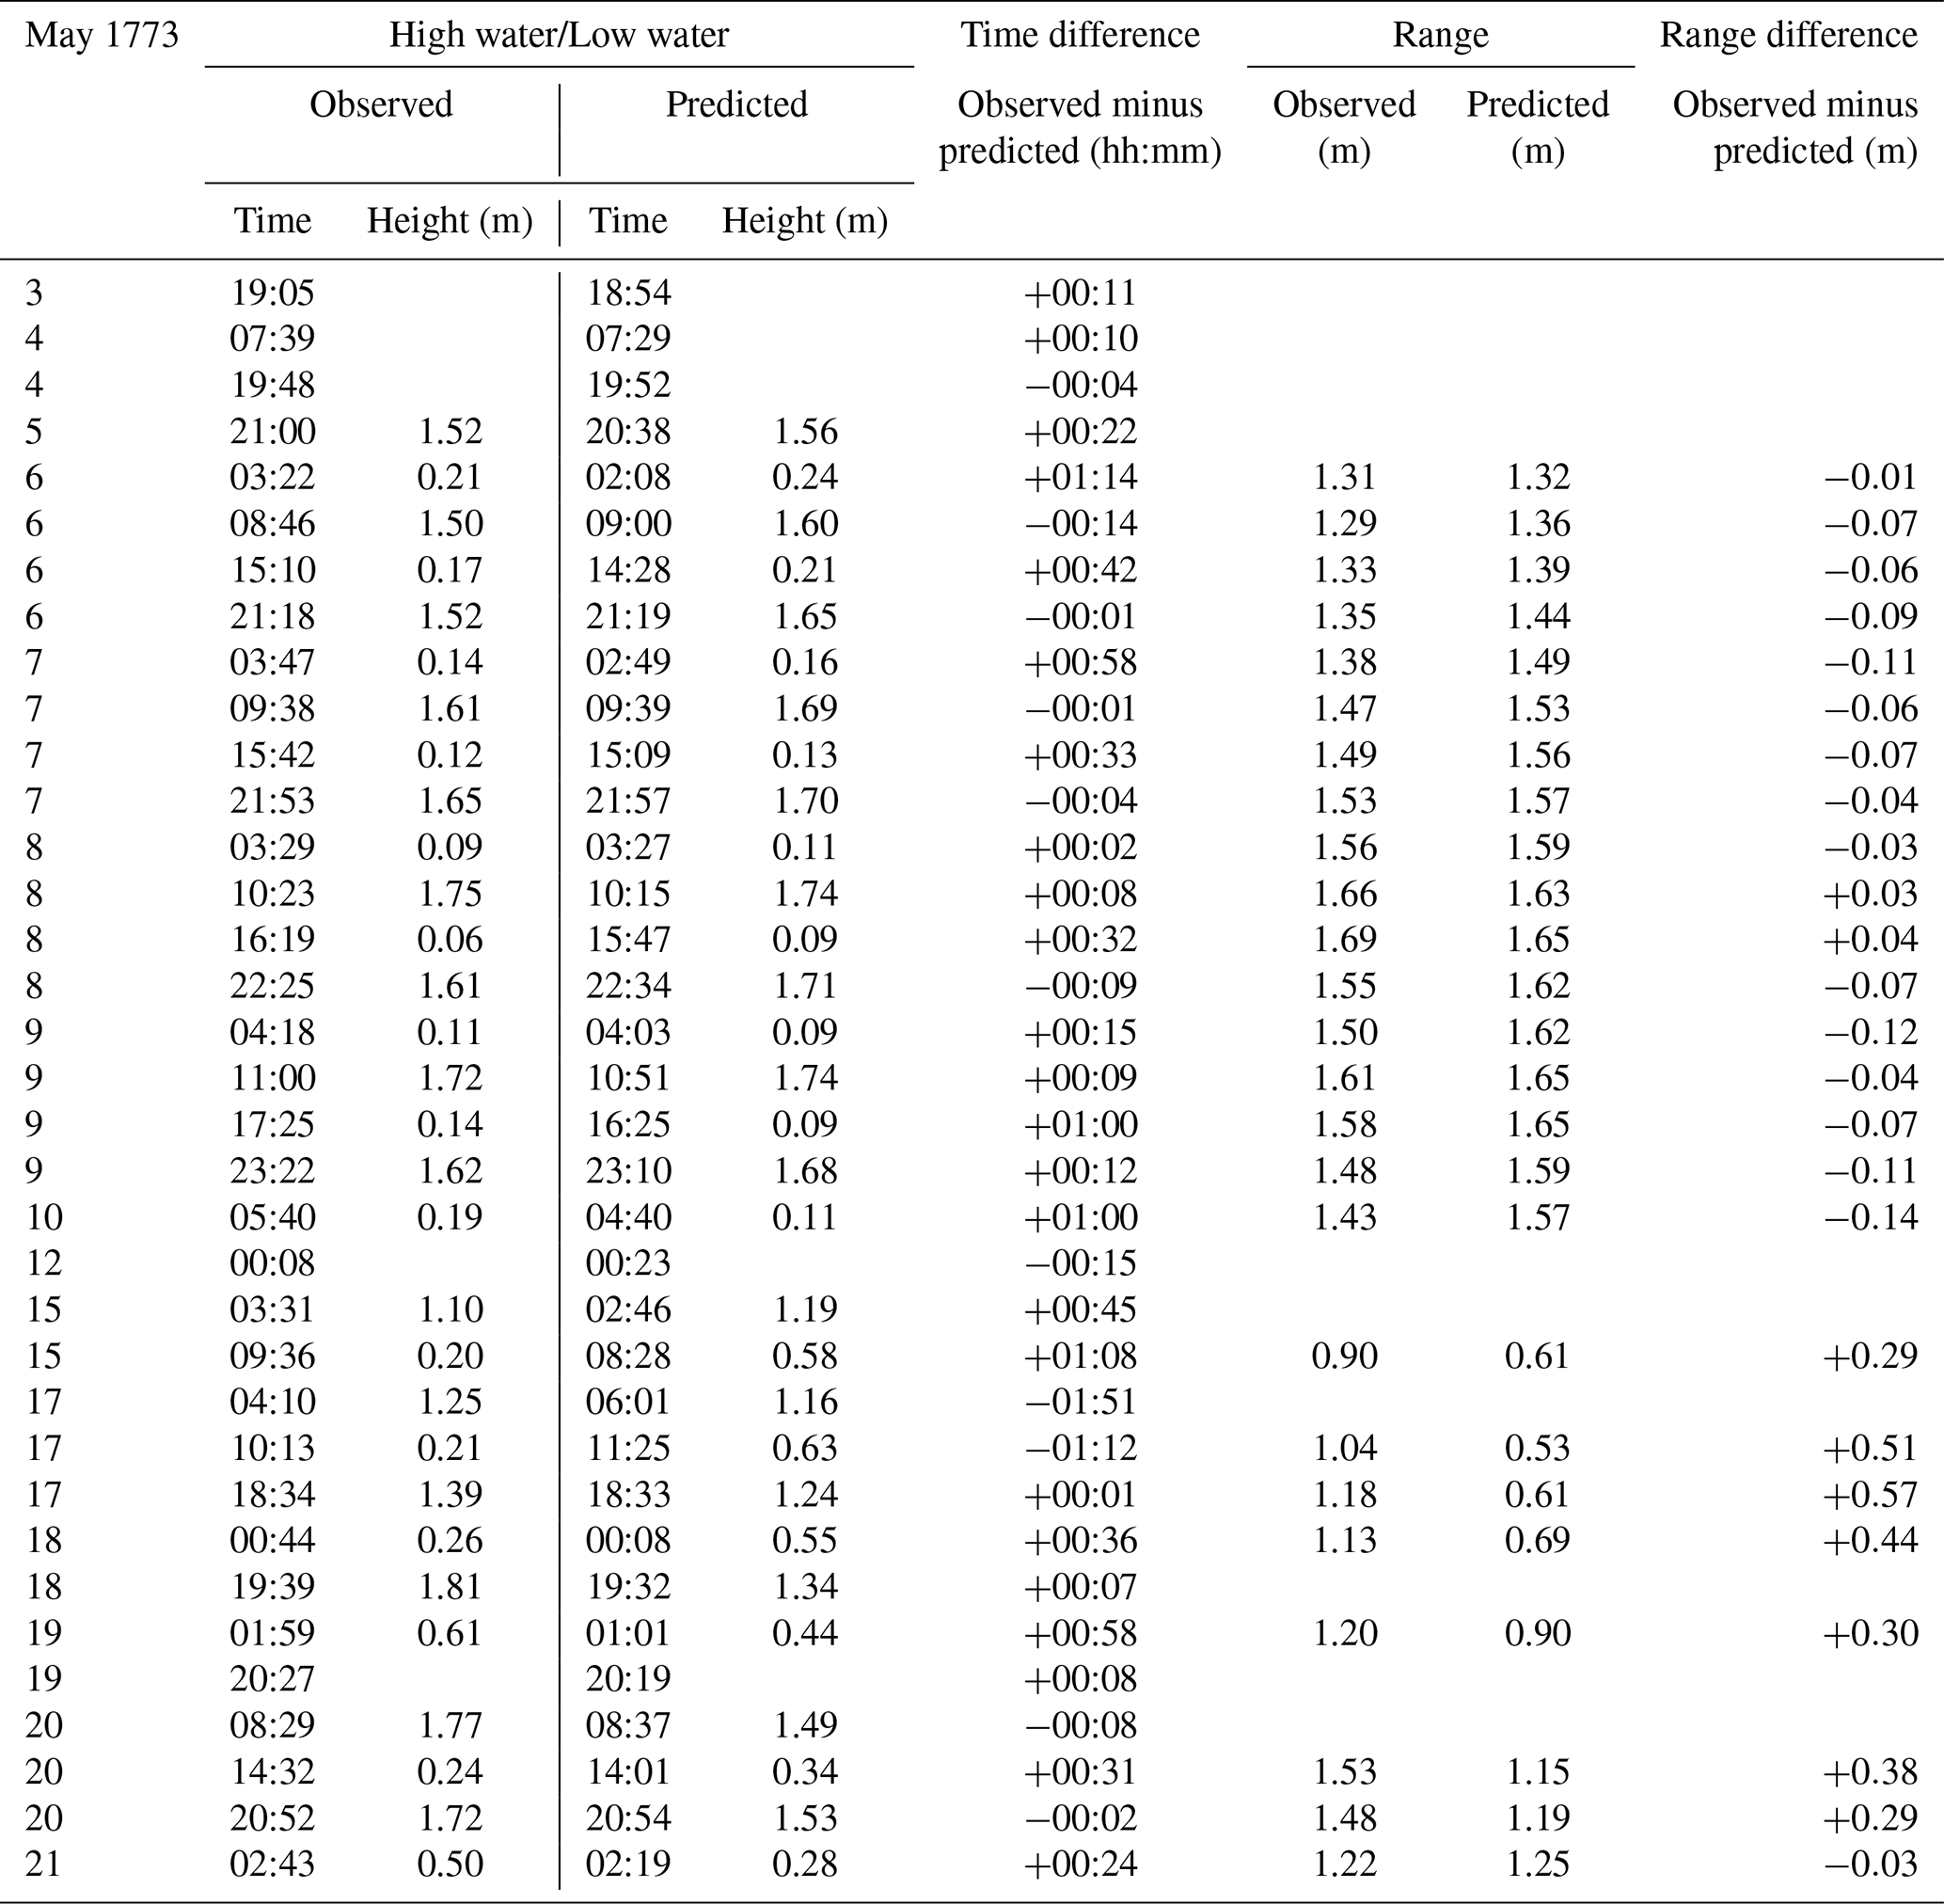
Table A3Details of high and low waters observed by Wales at Ship Cove during November 1773, corresponding predicted values, and differences between the times and tidal ranges derived from the heights. The reader is also referred to Fig. 8 for more information.
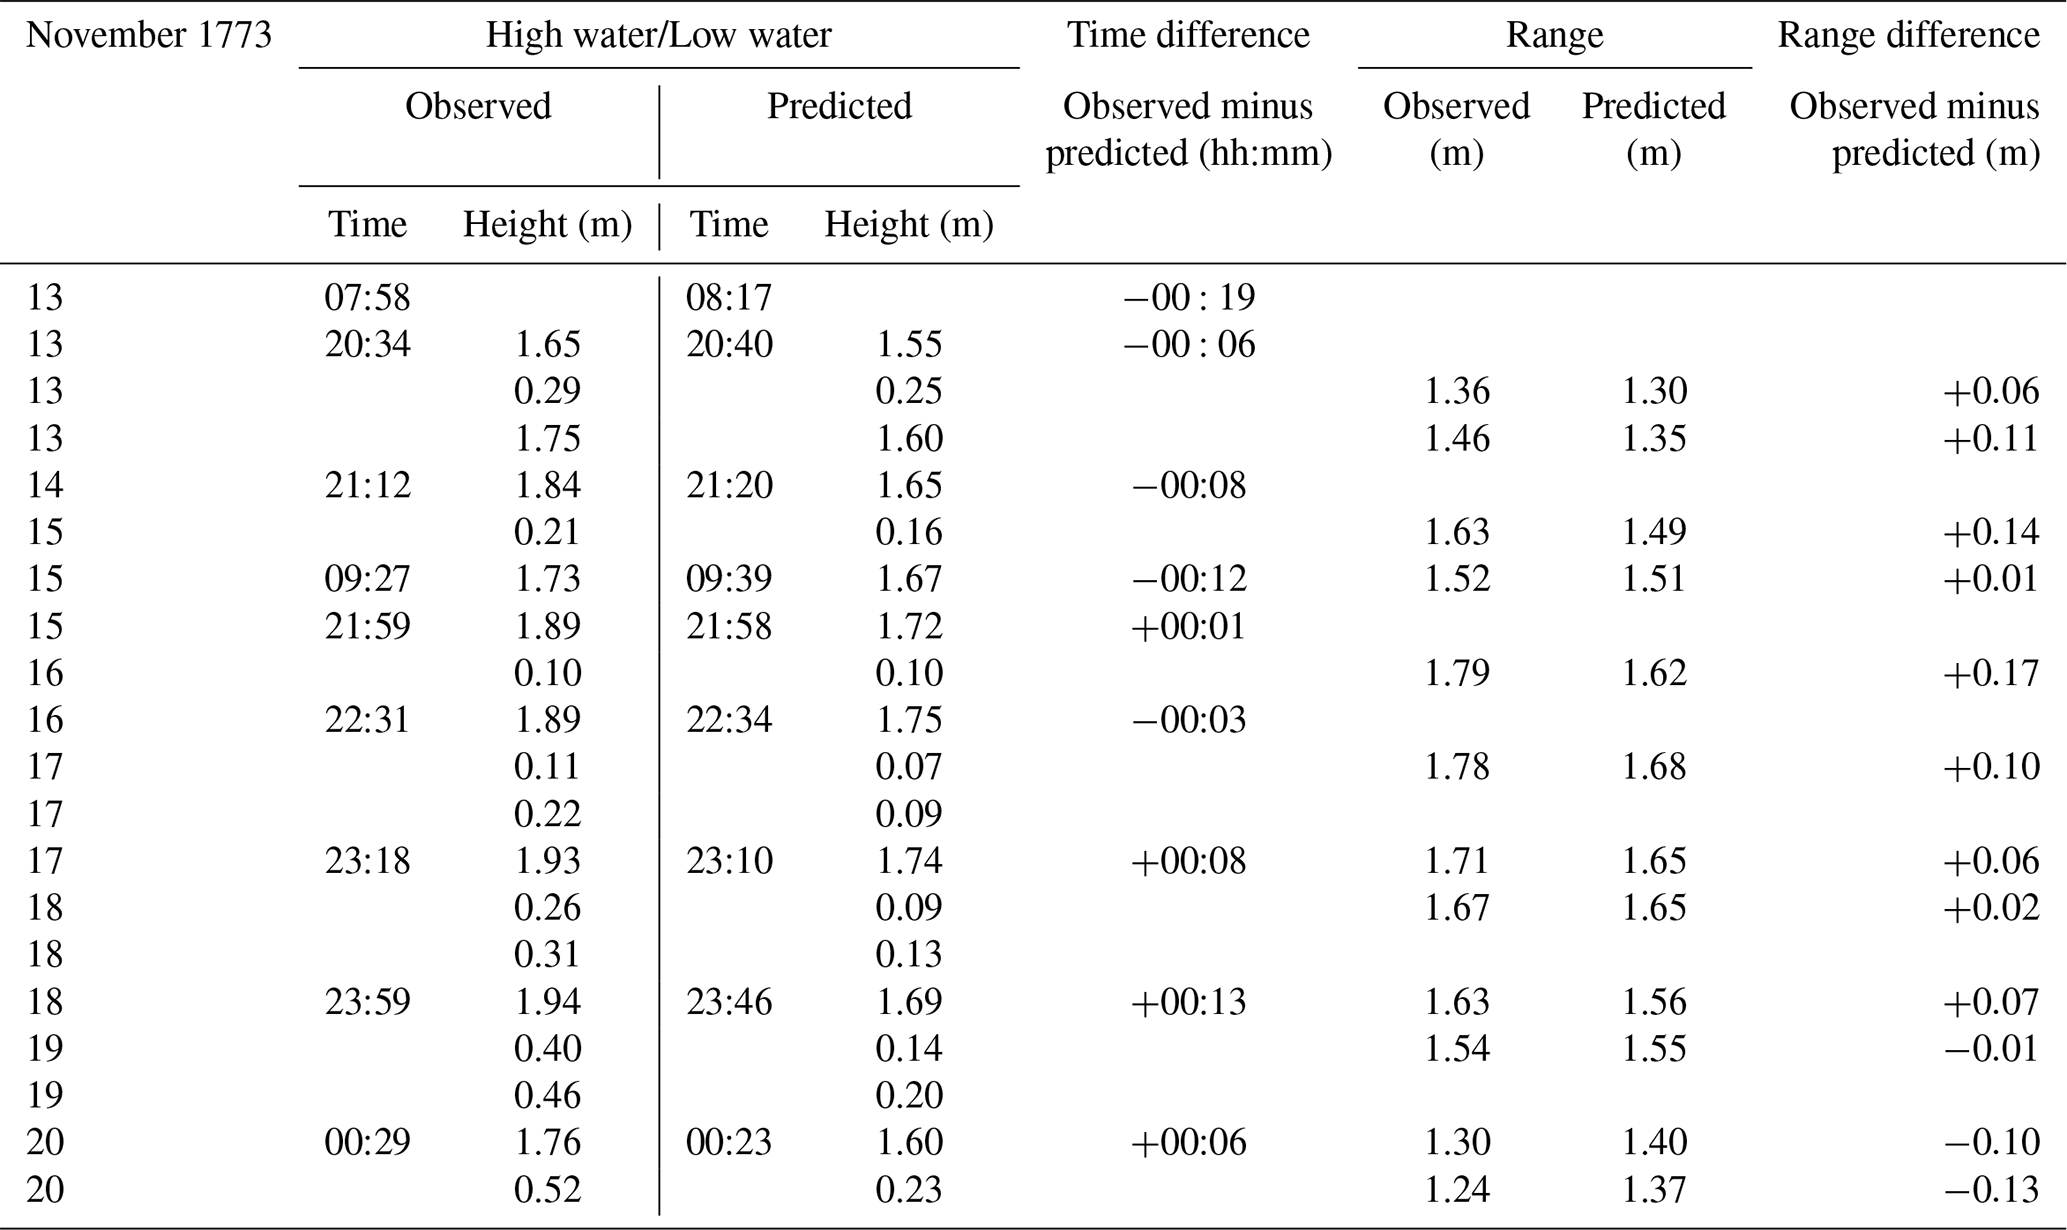
Table A4Details of high and low waters observed by Bayly at Ship Cove during December 1773, corresponding predicted values, and differences between the times and tidal ranges derived from the heights.The reader is also referred to Fig. 11 for more information.
As described in Sect. 4.2, the original phase lags for the modern locations have been adjusted to the longitude of the historic tide gauge sites to enable valid time comparisons.
Table B1Harmonic constituents used to generate tide predictions for comparison with Wales's observations at Pickersgill Harbour.
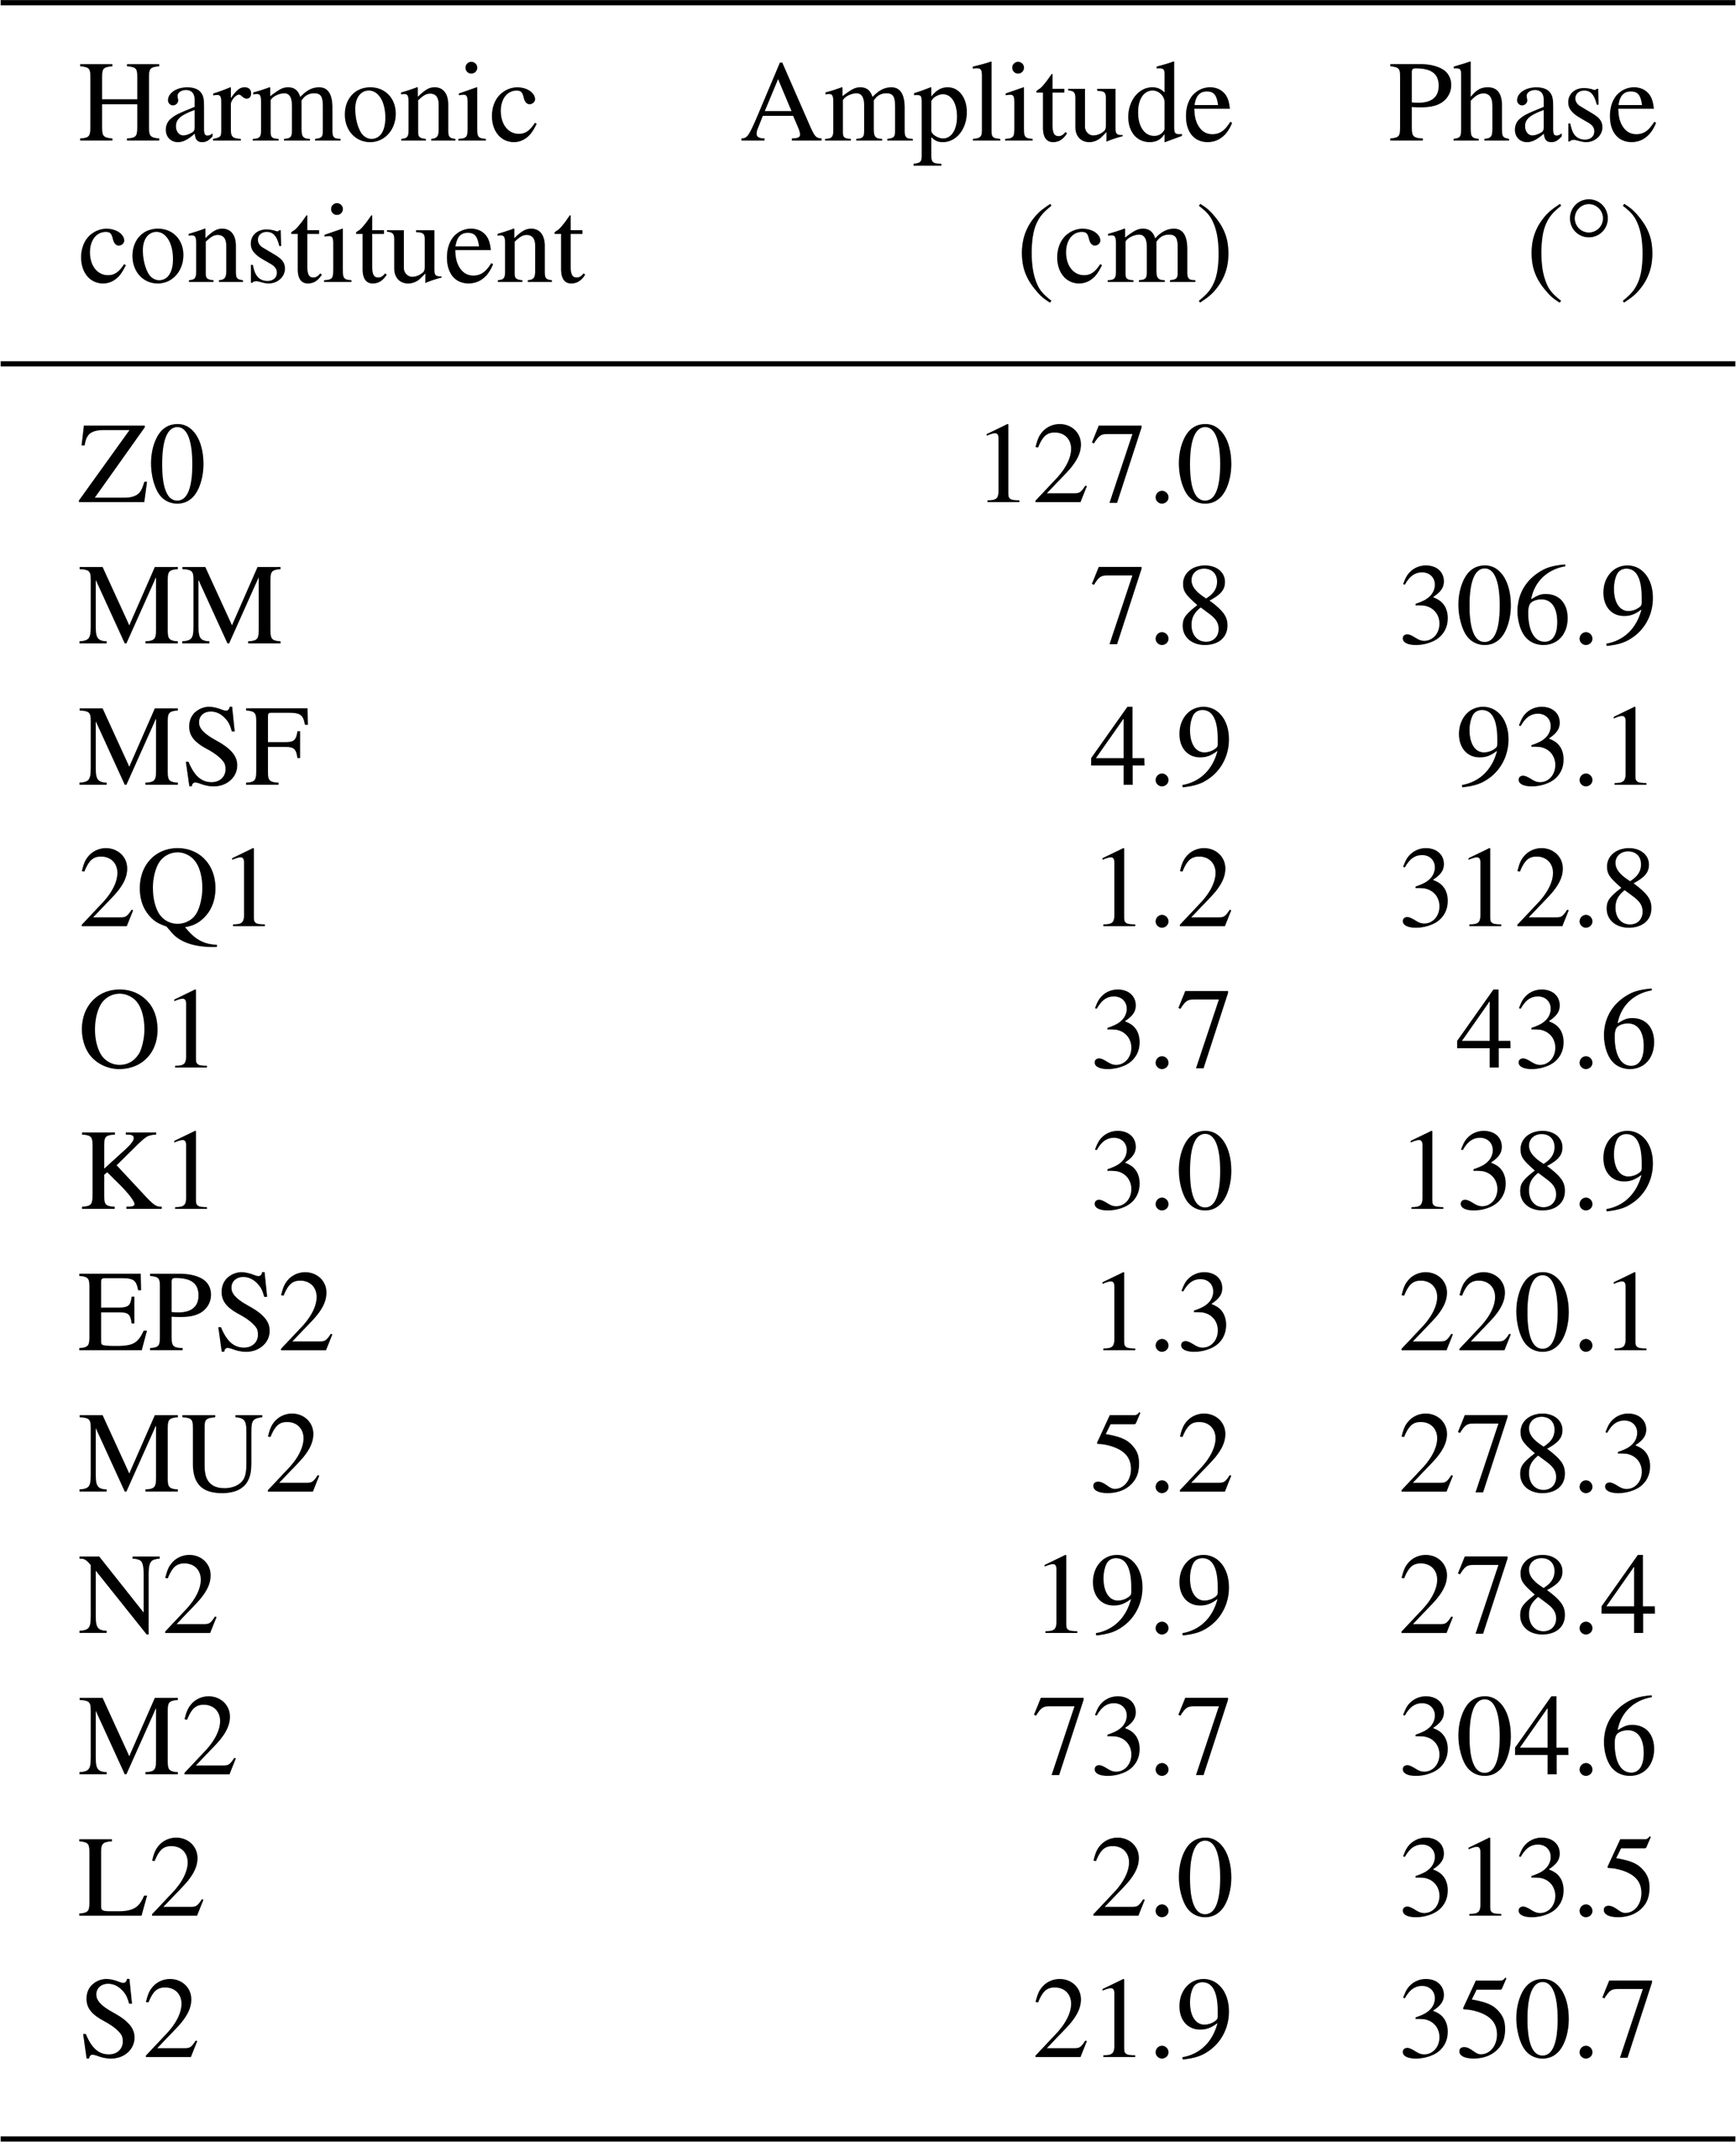
Table B2Harmonic constituents used to generate tide predictions for comparison with Bayly's and Wales's observations at Ship Cove.
The tables in Appendix C list the lunar phenomena used in this paper; the phenomena are calculated in terms of local mean time by Gray (2020) and then converted to align to the astronomical day which begins at noon on the corresponding civil day.
Table C1Local mean times and dates of new Moon and full Moon throughout 1773.
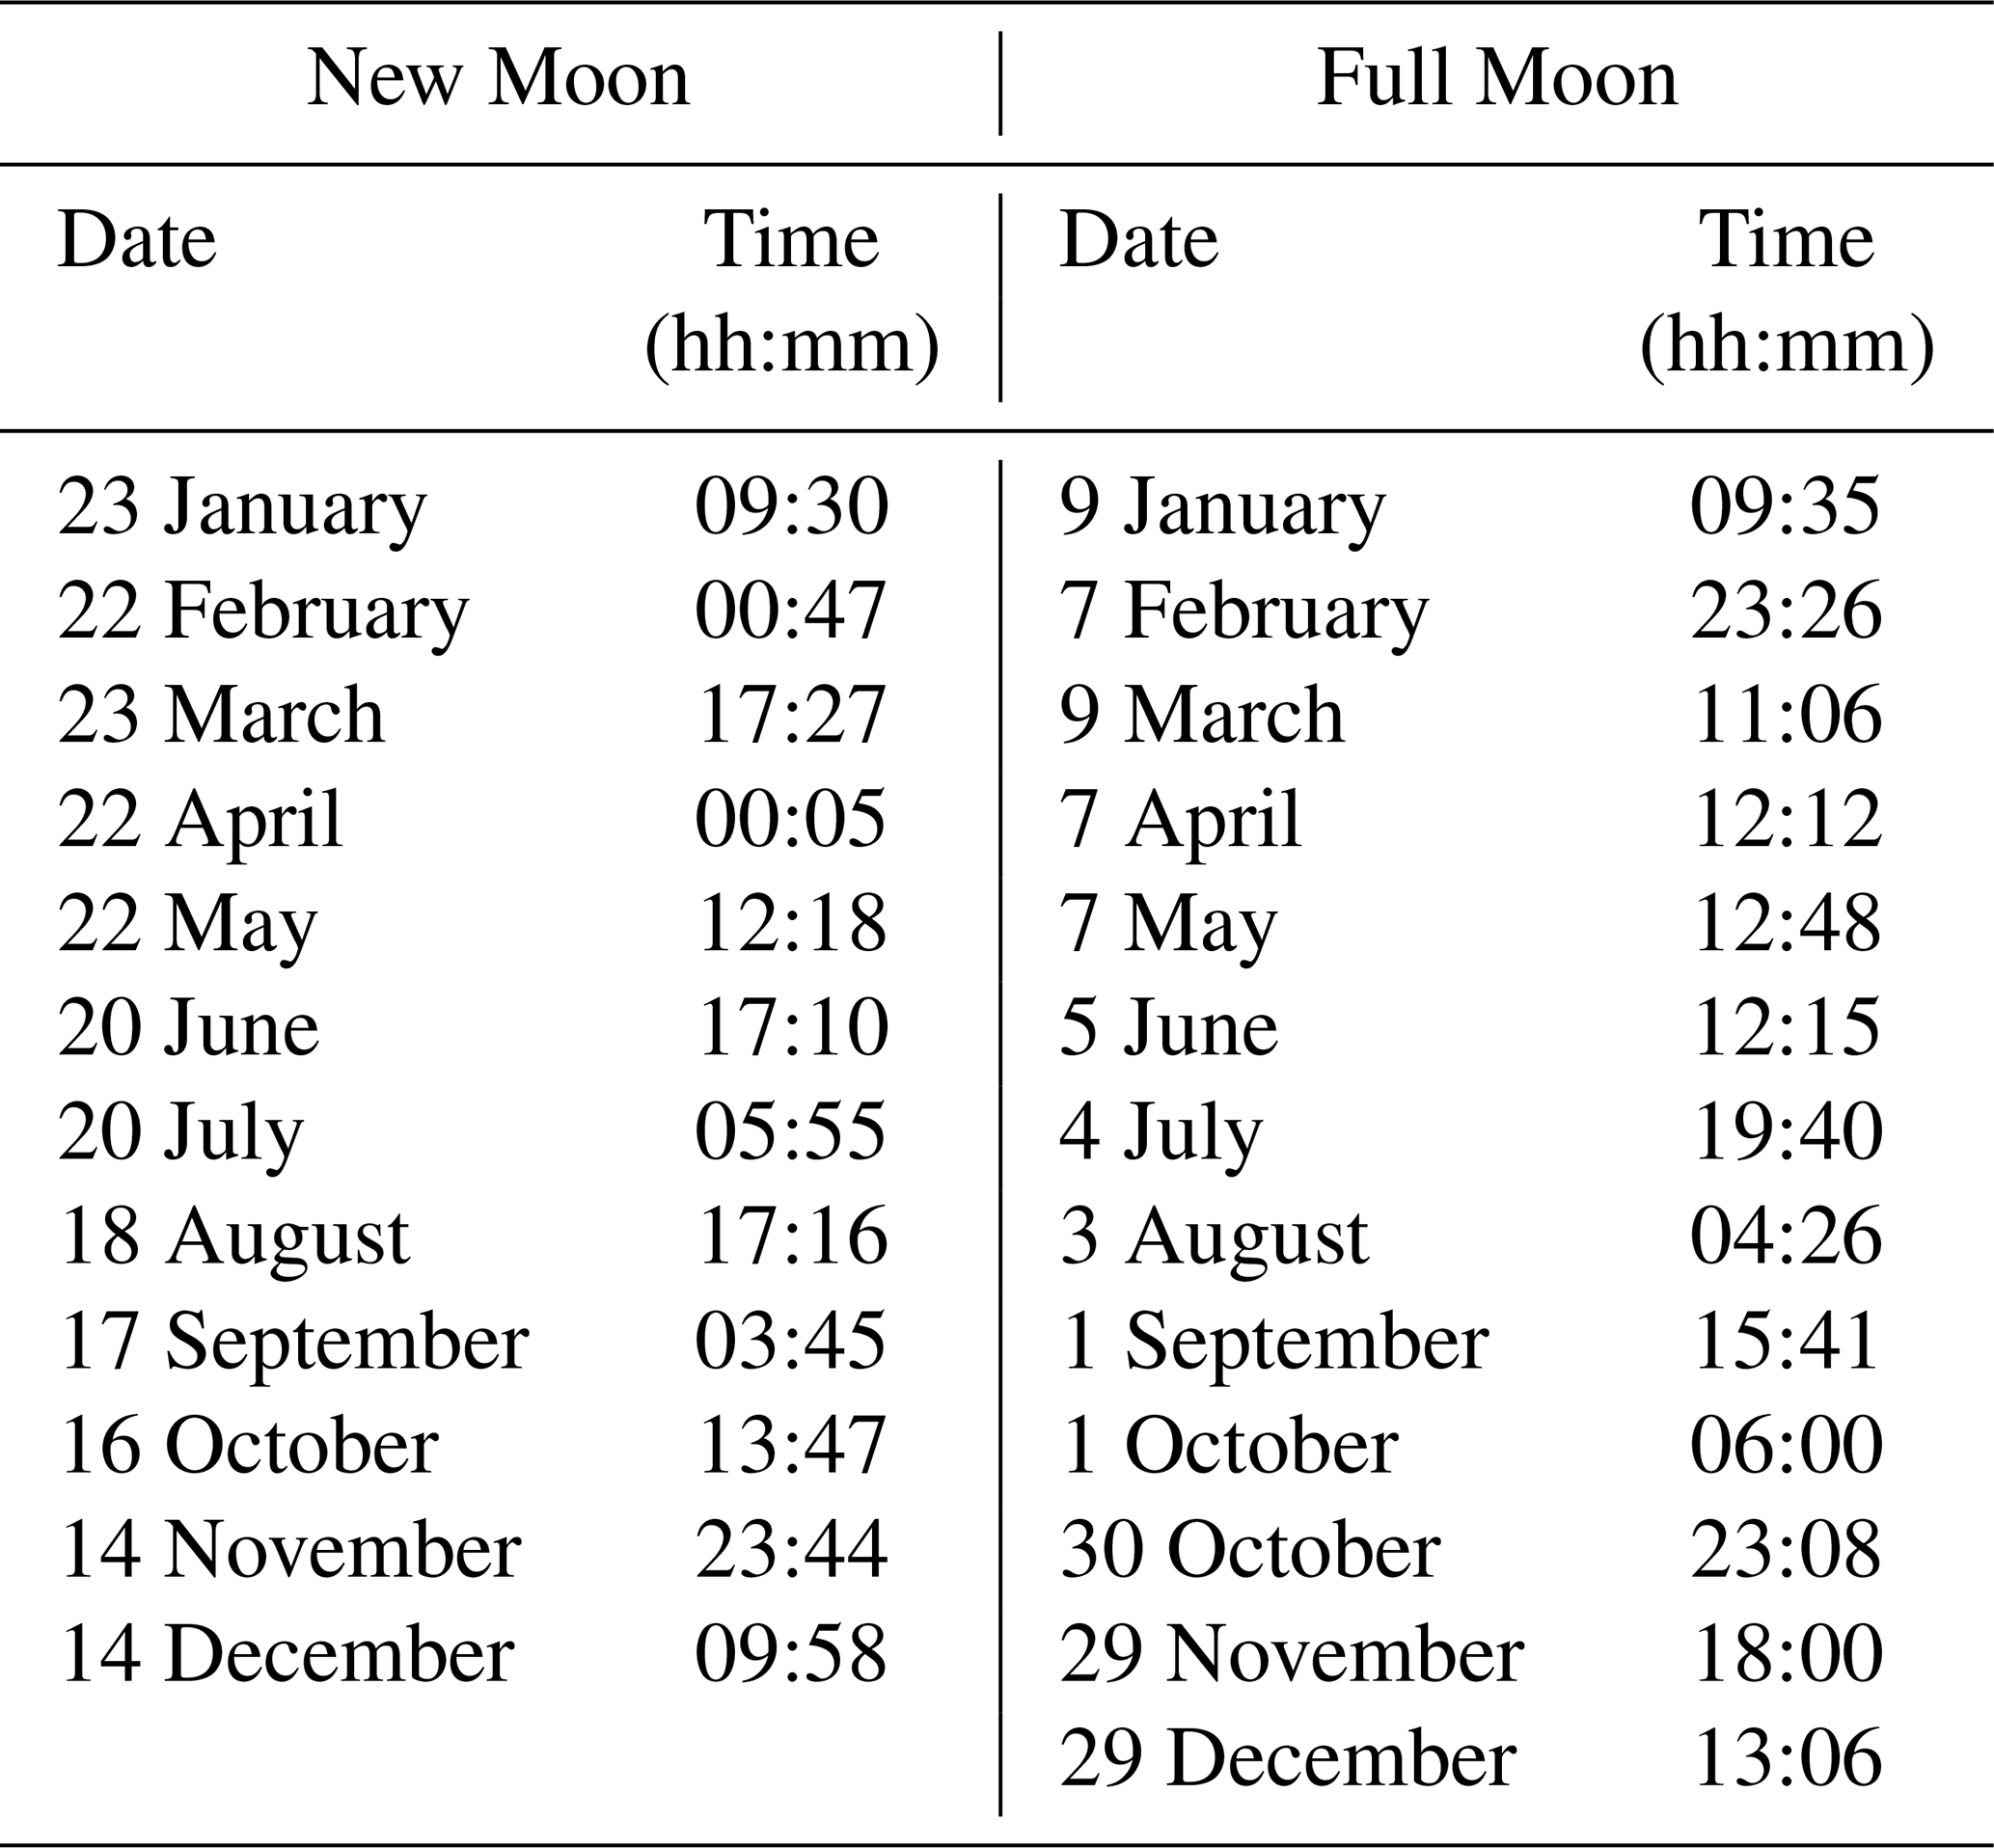
Table C2Local mean times and dates of lunar rise and set at Ship Cove, 1773.
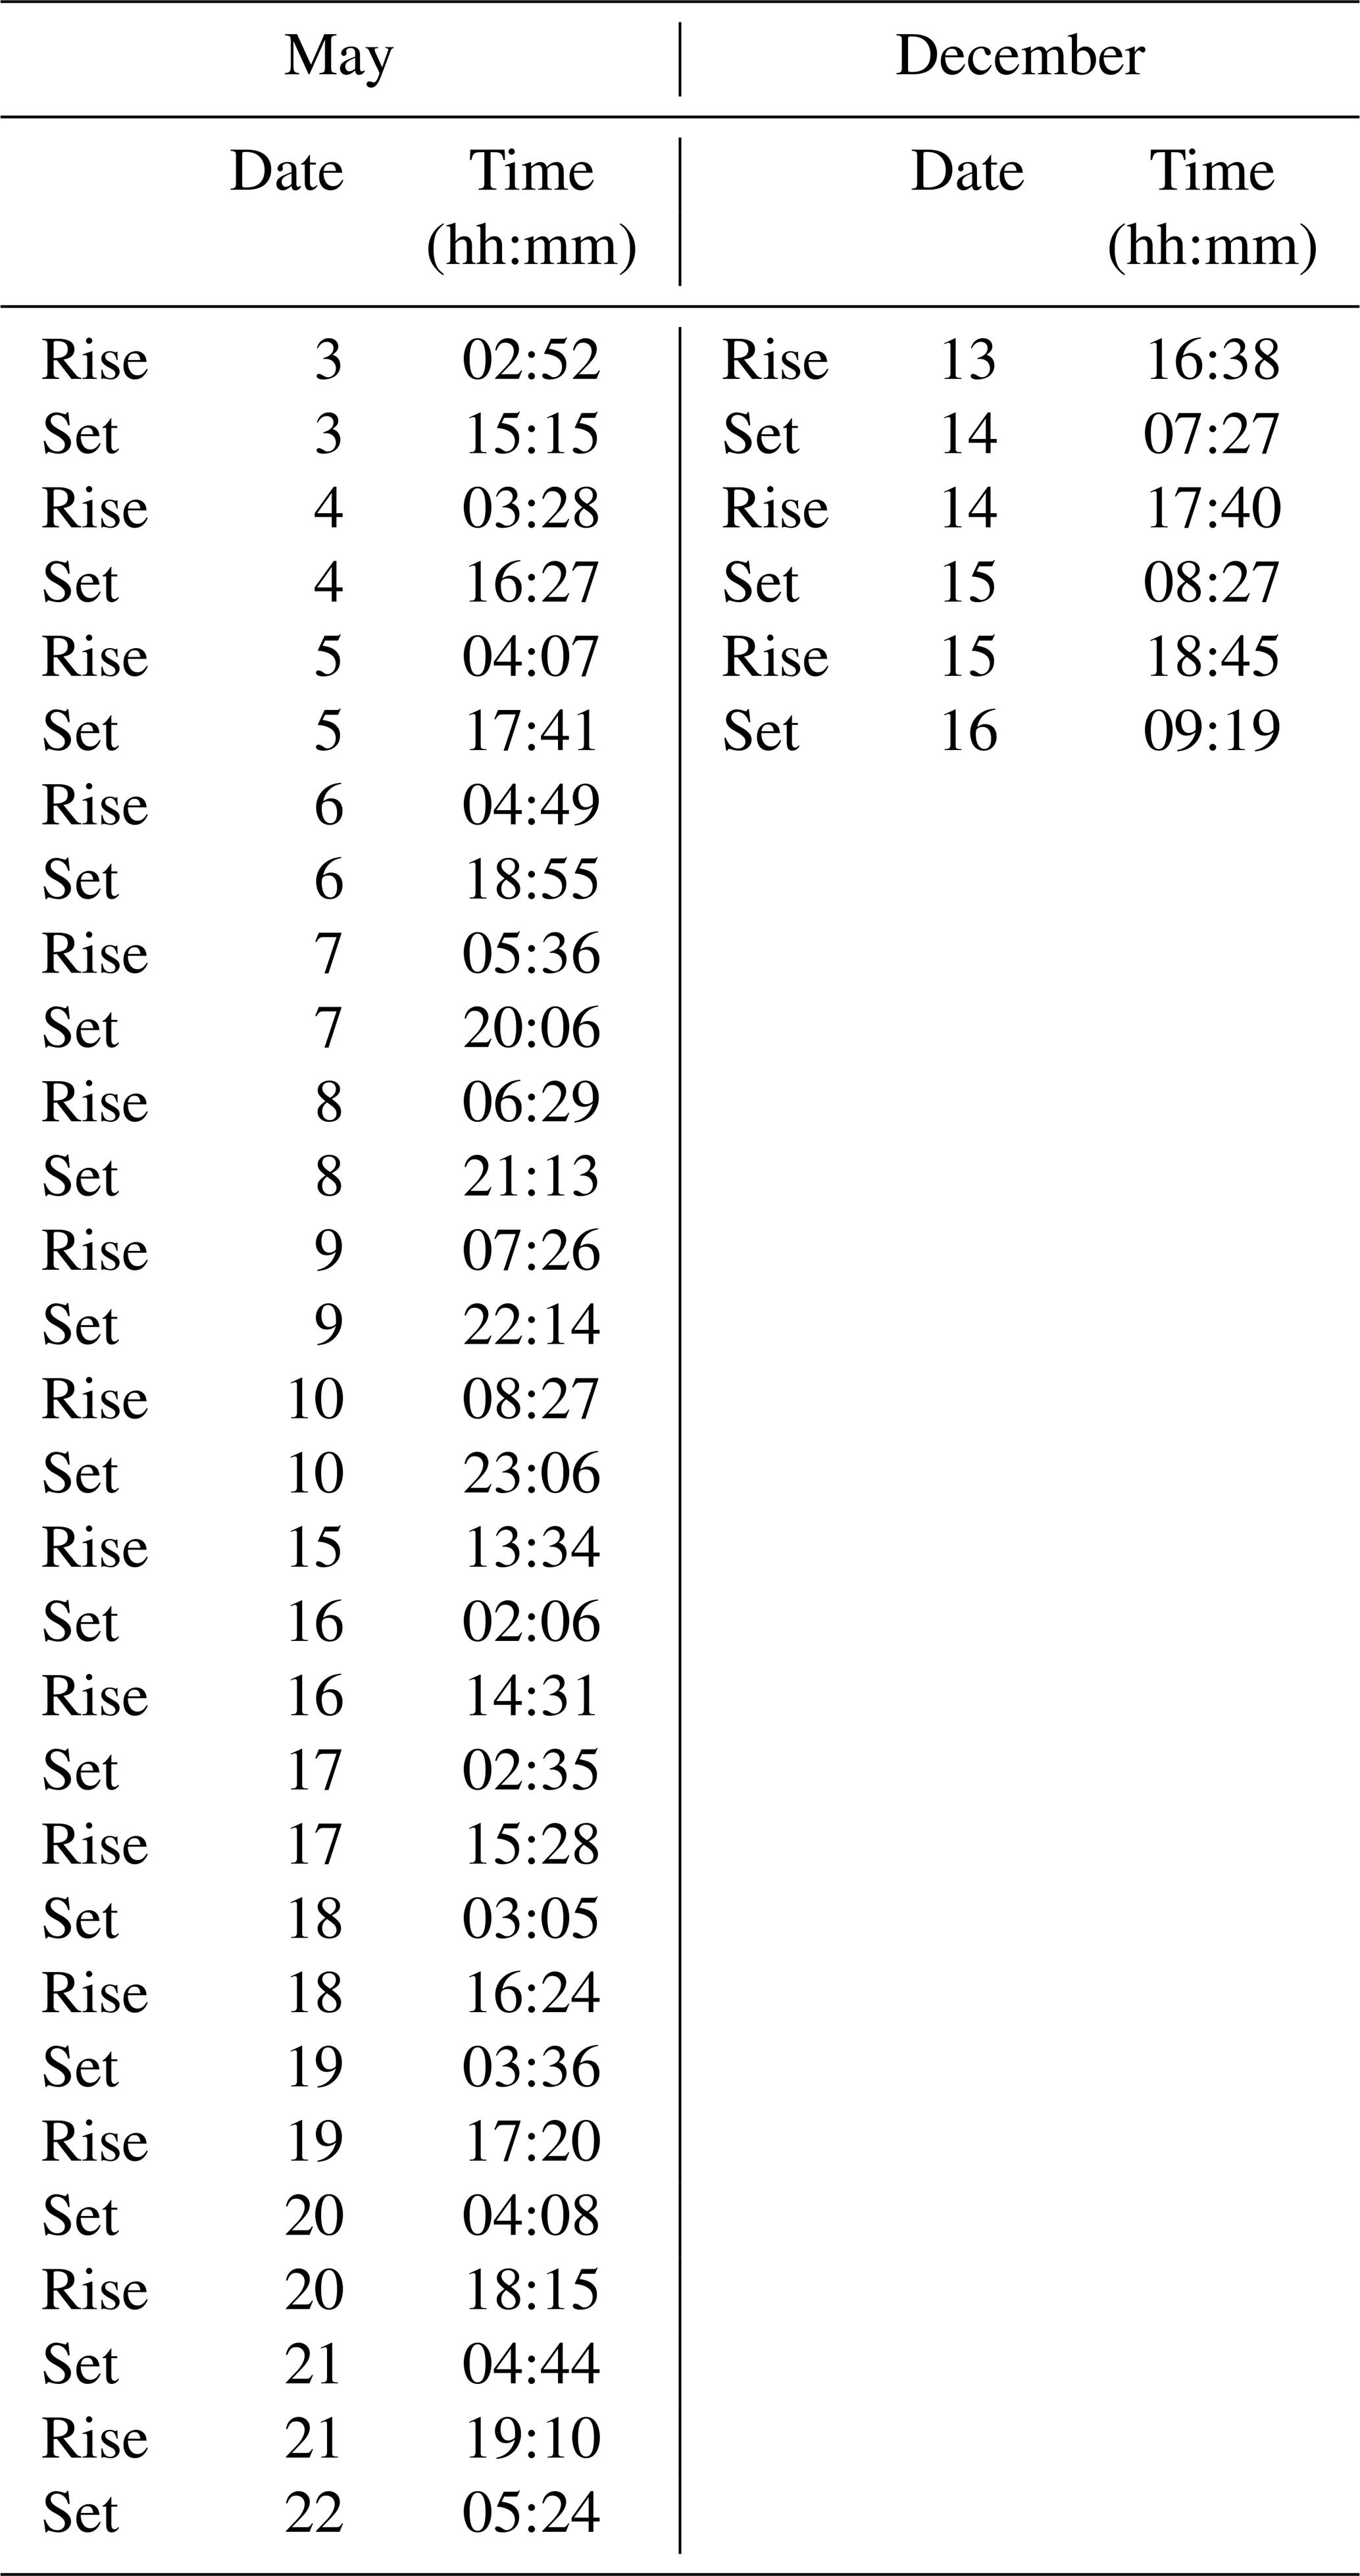
Table C3Local mean times and dates of lunar transit at Ship Cove, November 1773.
All data discussed in this paper and the harmonic constituents used to generate tide predictions are included in Appendix A–C. The hourly sea level data referred to in Sect. 4.2 are available upon request from Toitū Te Whenua (customersupport@linz.govt.nz).
The author has declared that there are no competing interests.
Publisher’s note: Copernicus Publications remains neutral with regard to jurisdictional claims in published maps and institutional affiliations.
I am indebted to Phil Woodworth for reading an early draft and the preprint version of this paper, which benefitted greatly from his constructive comments, corrections, and sage advice. I also wish to acknowledge Maurits Ertsen and Wilco Graf von Hardenberg for their challenging and astute comments; this account has surely been enhanced as a result. My sincere thanks go to Christopher Jones for his valuable suggestions which have also contributed to a much improved paper. Finally, I wish to thank Wayne Orchiston for providing his photograph for Fig. 1.
This paper was edited by Maurits Ertsen and reviewed by Christopher Jones, Wilko Graf von Hardenberg, and Philip Woodworth.
Bayly, W.: Log book of HMS Adventure, Board of Longitude, Vol. XLIV, Royal Greenwich Observatory 14/56, https://cudl.lib.cam.ac.uk/view/MS-RGO-00014-00056/1 (last access: 29 August 2022), 1774a.
Bayly, W.: Observations on HMS Adventure, Board of Longitude, Vol. XLV, Royal Greenwich Observatory 14/57, https://cudl.lib.cam.ac.uk/view/MS-RGO-00014-00057/1 (last access: 29 August 2022), 1774b.
Beaglehole, J. C.: The Journals of Captain James Cook on his Voyages of Discovery: I. The Voyage of the Endeavour 1768-71, The Hakluyt Society, 684 pp., ISBN 1-472-45323-9, 1955.
Beaglehole, J. C.: The Journals of Captain James Cook on his Voyages of Discovery: II. The Voyage of the Resolution and Adventure 1772-1775, The Hakluyt Society, 965 pp., ISBN 1-472-45324-7, 1961.
Cartwright, D. E.: Tides: A Scientific History, Cambridge University Press, Cambridge, 292 pp., ISBN 0-521-62145-3, 1999.
Foreman, M. G. G.: Manual for tidal heights analysis and prediction, Pacific Marine Science Report 77-10, Institute of Ocean Sciences, Patricia Bay, Sidney, B.C., 58 pp., https://www.dfo-mpo.gc.ca/science/data-donnees/tidal-marees/index-eng.html (last access: 15 June 2016), 1977 (updated 2004).
Gray, B.: Guide v. 9.1, Project Pluto, https://www.projectpluto.com/ (last access: 10 August 2022), 2020.
Haigh, I. D., Pickering, M. D., Green, J. A. M., Arbic, B. K., Arns, A., Dangendorf, S., Hill, D. F., Horsburgh, K., Howard, T., Idier, D., Jay, D. A., Jänicke, L., Lee, S. B., Müller, M., Schindelegger, M., Talke, S. A., Wilmes, S., and Woodworth, P. L.: The tides they are a-changin': A comprehensive review of past and future nonastronomical changes in tides, their driving mechanisms and future implications, Rev. Geophys., 57, e2018RG000636, https://doi.org/10.1029/2018RG000636, 2019.
Heath, R. A.: Phase distribution of tidal constituents around New Zealand, New Zeal. J. Mar. Fresh., 11, 383–392, https://doi.org/10.1080/00288330.1977.9515684, 1977.
Hughes, D. W., Yallop, B. D., and Hohenkerk, C. Y.: The equation of time, Mon. Not. R. Astron. Soc., 238, 1529–1535, https://doi.org/10.1093/mnras/238.4.1529, 1989.
Orchiston, W.: Exploring the History of New Zealand Astronomy: Trials, Tribulations, Telescopes and Transits, Springer, Cham, Switzerland, 688 pp., https://doi.org/10.1007/978-3-319-22566-1, 2016.
PlanetCalc: Equation of time, Version 3.0.4165.0, https://planetcalc.com/9198/, last access: 10 August 2022.
Wales, W.: Journal on the Resolution 21 June 1772-17 Oct. 1774, https://archival.sl.nsw.gov.au/Details/archive/110328362 (last access: 11 September 2022), 1774.
Wales, W.: Log book of HMS Resolution, Board of Longitude, Vol. XLVI, Royal Greenwich Observatory 14/58, https://cudl.lib.cam.ac.uk/view/MS-RGO-00014-00058/1 (last access: 11 September 2022), 1775a.
Wales, W.: Observations on HMS Resolution, Board of Longitude, Vol. XLVII, Royal Greenwich Observatory 14/59, https://cudl.lib.cam.ac.uk/view/MS-RGO-00014-00059/1 (last access: 11 September 2022), 1775b.
Wales, W. and Bayly, W.: The original astronomical observations made in the course of a voyage towards the south pole and around the world in his Majesty's..., Board of Longitude, London, https://cudl.lib.cam.ac.uk/view/PR-PBC-04091/1 (last access: 7 August 2022), 1777.
Woodworth, P. L. and Rowe, G. H.: The tidal measurements of James Cook during the voyage of the Endeavour, Hist. Geo Space. Sci., 9, 85–103, https://doi.org/10.5194/hgss-9-85-2018, 2018.
Officially known as the Commissioners for the Discovery of Longitude at Sea, the Board of Longitude was a body formed in 1714 to encourage work to help solve the navigation problem of determining longitude at sea. Over time, the board also supported a much wider range of projects relating to the improvement of navigation.
An archaic phrase referring to the full and new phases of the Moon.
When Cook sighted this inlet during his first voyage of discovery, he named it Duskey Bay; however, “Dusky” became the usual spelling during the second voyage stopover. Today it is known as Tamatea/Dusky Sound. The second voyage nomenclature is used when referring to the work carried out by Bayly and Wales, and the current name is utilised when using modern sources.
Cook visited this sound during his first voyage and named it after the wife of King George III; it is now known as Queen Charlotte Sound/Tōtaranui. Cook's nomenclature is used when referring to the work carried out by Bayly and Wales, and the current name when using modern sources.
Apparent or “sun-dial” time differs from local mean time by up to approximately a quarter of an hour due to the “equation of time” (Hughes et al., 1989).
The location within Queen Charlotte's Sound where Bayly and Wales established their tide gauges; known to them as Ship Cove but now called Meretoto/Ship Cove.
The location within Dusky Bay where Wales set up his tide gauge.
More correctly, only those published in Wales and Bayly (1777); the reader is referred to the comments in Sect. 3.4.
Dates and times of these lunar phases are given in Table C1 in Appendix C.
Moonrise and set times are given in Table C2 in Appendix C.
- Abstract
- Introduction
- The astronomer tide observers
- Tide observations during 1773 – an overview
- Tide predictions from modern sea level data
- Comparing observations to predicted data
- Tide observations during 1773 – details and discussion
- Conclusions
- Appendix A:
- Appendix B:
- Appendix C:
- Data availability
- Competing interests
- Disclaimer
- Acknowledgements
- Review statement
- References