the Creative Commons Attribution 4.0 License.
the Creative Commons Attribution 4.0 License.
 | 04 Apr 2023
Historical geomagnetic observations from Prague observatory (since 1839) and their contribution to geomagnetic research
Pavel Hejda
Miloš Revallo
Shortly after the introduction of the physical unit for the magnetic field in 1832 and the invention of the bifilar apparatus in 1837, both being extraordinary scientific achievements that took place in Göttingen, the Clementinum observatory in Prague became one of the first places where systematic observations of the horizontal intensity of the geomagnetic field began. Karl Kreil was decisively responsible for this. In this paper, we focus on the very beginnings of geomagnetic observations in Prague, dating from the middle of 1839. We describe the archival materials with data that exist from that time, how the main instrument for observing magnetic storms – the bifilar magnetometer – worked and how it was calibrated, and the first magnetic survey in Bohemia. This study indicates the importance of historical geomagnetic observation materials to modern science, such as space weather research.
- Article
(2597 KB) - Full-text XML
- BibTeX
- EndNote


Prague astronomical observatory was established at the Jesuit Clementinum college (close to Charles Bridge in Prague) in 1751. After the dissolution of the Jesuit order, the college and the observatory went into the state administration of Austria. Thus, the observatory director was appointed by the Emperor's office. Despite the official name of the observatory, astronomy was not the only subject of its activities and, in most cases, was not even the main subject of observers' interest. Meteorological observations at Clementinum started in 1752. The uninterrupted series of meteorological observations dates back to 1775 and belongs to the longest climatological time series worldwide. In the 1780s and 1790s the observatory participated in the “Societas Meteorologica Palatina” (the Mannheim Meteorological Society) that coordinated, conducted and published weather observations of 39 predominantly European observatories. At that time, the Clementinum observatory did not publish its own yearbooks. The results of the meteorological observations were presented in various periodicals of scientific societies. Magnetic or aurora observations were included sporadically.
Regular magnetic observations were initiated by Karl Kreil in 1839. Kreil came to the Prague observatory from Milan in 1838. During his stay in Milan, he was visited by Carl Friedrich Gauss's assistants and got excited by the quickly developing geomagnetism research. He introduced magnetic observations in Milan at the Brera astronomical observatory and became a member of the Göttingen Magnetic Union – the network of magnetic stations around the globe established by Gauss and Wilhelm Eduard Weber, having been slightly influenced by Alexander von Humboldt (Glassmeier, 2007; Wittmann, 2020). The preserved correspondence between Kreil and Gauss contains 31 letters, not counting those which contain only tables of results without significant accompanying text (Reich and Roussanova, 2018).
After Kreil was informed about his transfer to Prague, he took care of the acquisition of magnetic instruments for his new place of work. His goal was to make magnetic and weather observations as often as possible. As the budget of the observatory was quite limited, he tried to recruit volunteers. Kreil wrote the following:
As soon as I learned about my move to Prague, I tried to obtain instruments similar to those I used in Milan. Given the lively interest for science which was in Prague, I was hopeful of finding ready co-workers, because only using joint forces one can unearth secrets which are so tenaciously hidden by nature. And my hopes were answered. While instruments were unpacked, several young volunteers applied and offered assistance, so I was able to start regular observations shortly after my arrival. More observers applied during the first month of operation, and thanks to their eagerness and diligence in acquiring new skills I could extend the set of hourly magnetic and meteorological observations to period from 5 a.m. to 11 p.m., observation period which was before only wishful thinking (Kreil, 1840).
In a short time, Kreil managed to put together a group of six co-workers. The most important of them was Karl Fritsch, who, although a meteorologist by profession, also took part in magnetic observations. In spite of six volunteers, it became soon clear that the initially launched 19 observations a day were not sustainable in the long run, and the number of observations was stabilised at 10 per day. In addition to the regular observations, there were also two specific categories of measurements carried out in the first decade: (1) observations of magnetic storms initiated when the observer noticed rapid changes in declination or horizontal intensity and (2) term-day observations organised in the framework of the Göttingen Magnetic Union that continued even after the union formally ceased its activities. The observations took place 1 day a month and were carried out with a frequency of 5 min.
Simultaneously with the beginning of the observations in July 1839, Kreil started publishing yearbooks entitled Magnetische und meteorologische Beobachtungen zu Prag (hereafter referred to as Beobachtungen) thanks to which all magnetic and meteorological data were preserved. The title was changed to Magnetische und meteorologische Beobachtungen auf der k. k. Sternwarte zu Prag in 1868. The scans of all 78 volumes of the Beobachtungen are accessible at https://www.ig.cas.cz/en/prague-observatory-yearbooks/ (last access: 29 March 2023). Between 1842 and 1845, Kreil also compiled four volumes of the yearbook Astronomisch-meteorologisches Jahrbuch für Prag.
Kreil joined the Prague observatory as an assistant and later, in 1845, was appointed director of the observatory. He soon became a respected scientific personality in Prague. In 1841, he became a member of the Royal Bohemian Society of Sciences, and he later (in 1848) became its director. At the same time, he was asked by the Imperial Academy of Sciences in Vienna to draw up a proposal for a meteorological observation system for Austria. Subsequently, in 1850, he was called up to Vienna to establish the Central Institute for Meteorology and Earth Magnetism and became its first director. Along with him, Karl Fritsch also went to Vienna. He later became the vice director of the Central Institute for Meteorology and Earth Magnetism and was also a co-founder of the Austrian Meteorological Society.
Despite the departure of two leading personalities, neither the activities of the observatory nor the publication of Beobachtungen were disrupted. Tables of daily observations were published in instrumental units until 1871 and in physical units from 1872 onwards. Due to increasing urban noise, the magnetic observations were reduced to declination in 1905. The last volume of the Beobachtungen series, the 78th in a row, contains the data of 1917. Volumes 79 to 81, covering the years 1918 to 1920, were published as bilingual Czech–French texts. The observations continued smoothly, and the data set is complete even during the turbulent period of the end of the First World War and the establishment of Czechoslovakia. These last three volumes were published by the State Meteorological Institute, established in 1919 (SMI, 1923). Since 1921, this institute has included the publication of Clementinum meteorological data in its yearbooks. In 1920, the State Institute of Geophysics (SIG) was established under the auspices of the Faculty of Science of the Charles University. The observations of declination continued at Clementinum until 1926. Thus, Clementinum belongs to the few observatories that span the period from the 1840s to the beginning of the 20th century. The monthly and yearly means of declination were published in the SIG yearbook (SIG, 1927).
This paper is focused on documenting the beginnings of geomagnetic observations at Clementinum, which are associated with the merits of Karl Kreil. In particular, we deal with the methodology, the observed data structure and the form of their presentation in the early yearbooks of the Beobachtungen (Kreil, 1841, 1842). Furthermore, we also analyse some aspects of the so-called bifilar magnetometer, which was a common variation observational device at the time, and describe a procedure of its calibration. We mention the first strong magnetic storm observed at Clementinum in 1839. We also report on the beginnings of the magnetic survey in Bohemia. More detailed information concerning the whole time span of geomagnetic observations at Clementinum can be found in Hejda et al. (2021a). The historical records of strong magnetic disturbances and term-day observations at Clementinum are discussed in Hejda et al. (2022), and comprehensive online databases are provided by Hejda et al. (2021b) at https://doi.org/10.1594/PANGAEA.936921.
Based on the collection of printed yearbooks, Beobachtungen, whose first volumes were compiled by Karl Kreil, we focus on tracing the early years of geomagnetic observations in Prague. The observation of geomagnetic elements at Clementinum built on Kreil's experience acquired during his previous tenure at the observatory in Milan. In Prague, however, Kreil and his co-workers were successful in obtaining longer time series without interruption, mainly for variations in inclination (Kreil, 1841, p. 1). Furthermore, the observations of individual geomagnetic elements were made here with more frequent daily repetitions of measurements. Along with collecting the geomagnetic data, regular meteorological observations were also performed. Kreil was aware of the complexity of the issue and hypothesised about the possible interconnection of geomagnetic and meteorological phenomena. Related to this idea was the sophistication of methodology used and the consistency with respect to performing and recording various types of observations.
For the current analysis of historical geomagnetic records it is important that, along with the observational results in Beobachtungen, there are detailed comments on measurement procedures and description of measuring instruments. In the individual volumes of Beobachtungen, it is possible to follow how the observation technique gradually developed and improved over the years.
As in modern observatory practice, the early observations consisted of the absolute measurements and the recordings of geomagnetic field variations. As mentioned above, in addition to the regular observations carried out several times each day, there were also observations of disturbances (in the case of unusually rapid changes in the magnetic field) as well as the term-day observations. The main sections of Beobachtungen are in accordance with such a structure of observed data.
The absolute observations were performed in the open space of the Imperial Garden within the Castle District (also known as Hradschin or Hradčany), where it was possible to avoid disturbing influences. The first Beobachtungen records of absolute observations of magnetic elements date to the end of August and the beginning of September 1840. The magnetic rods used were of the same shape and size as those at the Göttingen observatory. When measuring the inclination, several needles with the same weight and dimensions but differing with respect to magnetisation were used. Kreil commented on various kinds of disturbing influences (temperature changes, humidity, airflow) as sources of random errors that can be eliminated by performing a sufficiently large number of measurements. There is a detailed description of the construction, geometry and settings of mechanical measuring instruments. The procedure for carrying out absolute measurements follows that used at the Milan observatory.
Variation magnetic measurements were performed at the college building of Clementinum. When establishing the observatory, there was an effort to eliminate disturbing influences as much as possible, and the installation location and the relative position of the devices also relied on this. The devices were arranged so that one observer could perform measurements of all magnetic elements at an interval of about 2 min. During the first few years, the observers were probably aware of the existence of the effect of temperature changes on the magnetisation of the rods (magnetic needles), although the very first yearbooks did not report the temperature correction. This issue concerns the measurements of the variations in the horizontal intensity with a bifilar instrument (see the next section for some details on this device). The temperature correction coefficients for the first bifilar instrument in Prague, which was in operation until 1845, were only calculated retrospectively. A brief description of the instruments, an overview of the measurement procedure and a discussion of the temperature corrections for the bifilar device are given in the paper by Hejda et al. (2021a).
Kreil points out the importance of performing variation measurements for magnetic and meteorological phenomena, to the extent possible, with a time step of 1 h. Declination, horizontal intensity, inclination and the period of oscillation of the inclination needle were recorded in variational magnetic observations and presented in Beobachtungen in tabular form. As pointed out, the variability in individual magnetic elements over time is different. This was taken into account in the observation time schedule. The first two elements, i.e. declination and horizontal intensity, often change quite significantly from minute to minute; therefore, their observations were always made in the same second. In the case of inclination, the changes are less pronounced; therefore, it was enough to make the observation in the same minute. The variability in the inclination needle oscillation period over time, from which it was possible to infer changes in the total field, was considered even smaller and, therefore, required less precise observation times.
Detailed records of the variational magnetic observations are provided in the yearbooks under the heading “Register der Variations Beobachtungen”. The hourly values of magnetic elements in their original scale units are given here in tabular form for each day.
Furthermore, an overview of the processed and modified data is provided along with their recalculation from scaled units to degrees under the heading “Resultate der Variations Beobachtungen”. The tables show the monthly averages of the hourly values of measured data. Kreil tried to investigate how the declination changes during the year depended on particular seasons and also admitted the possibility of a Moon phase influence.
The remaining important parts of the yearbooks were organised as follows: information on absolute measurements used to be placed in the introductory pages of individual volumes; magnetic storms were either recorded within sections on regular observations or separate sections were devoted to them; and the term-day observations were typically reported in the section entitled “Magnetische Termins-Beobachtungen”.
In 1832, Gauss developed the first method for measuring the horizontal intensity of the geomagnetic field (Gauss, 1832), which is nowadays known as Gauss's absolute method (e.g. Van Baak, 2003). Contemporary physicists are still familiar with this method because, concurrently to its introduction, Gauss also established his physical unit to express the intensity of the magnetic field by means of a system of three basic units: millimetre, milligram and second (Garland, 1979).
Subsequently, in 1837, Gauss presented another method that he developed for monitoring changes in the horizontal intensity of the geomagnetic field (Gauss, 1838; Garland, 1979). The new method was important for the study of geomagnetic activity, as the horizontal intensity has proved to be the key quantity for observing magnetic storms. For instance, the modern, widely used disturbance storm time (Dst) index is determined from observations of the horizontal intensity (e.g. Mayaud, 1980). The instrument used in this new method was called a bifilar magnetometer, or simply a bifilar. Unlike Gauss's absolute method, the bifilar is a little-known device today. Therefore, we shortly introduce the principle of operation of this device here.
The basic part of the bifilar is a magnetised rod (or “needle”) hanging on a pair of long fibres which run close together and keep the needle in a horizontal plane (Fig. 1). By rotating the swivel mount from which the fibres hang, it is possible to achieve a state in which the torsion of the pair of fibres brings the needle into a position perpendicular to the magnetic meridian. Let us imagine that the initial position of the needle and fibres was such that the needle pointed with its northern end to the magnetic south (i.e. towards the magnetic pole in the Northern Hemisphere) and its southern end to the magnetic north (i.e. towards the magnetic pole in the Southern Hemisphere). Let us also assume that the fibres were in such a position that their torque acting on the needle was zero. It would then be necessary to turn the swivel mount more than a right angle to bring the needle into a perpendicular direction; it would be necessary to turn the console by an angle of 90∘ + Θ (Fig. 2). In this position, the mount would be locked and the instrument would, thus, be prepared to observe relative changes in the horizontal intensity of the geomagnetic field (the ratio).
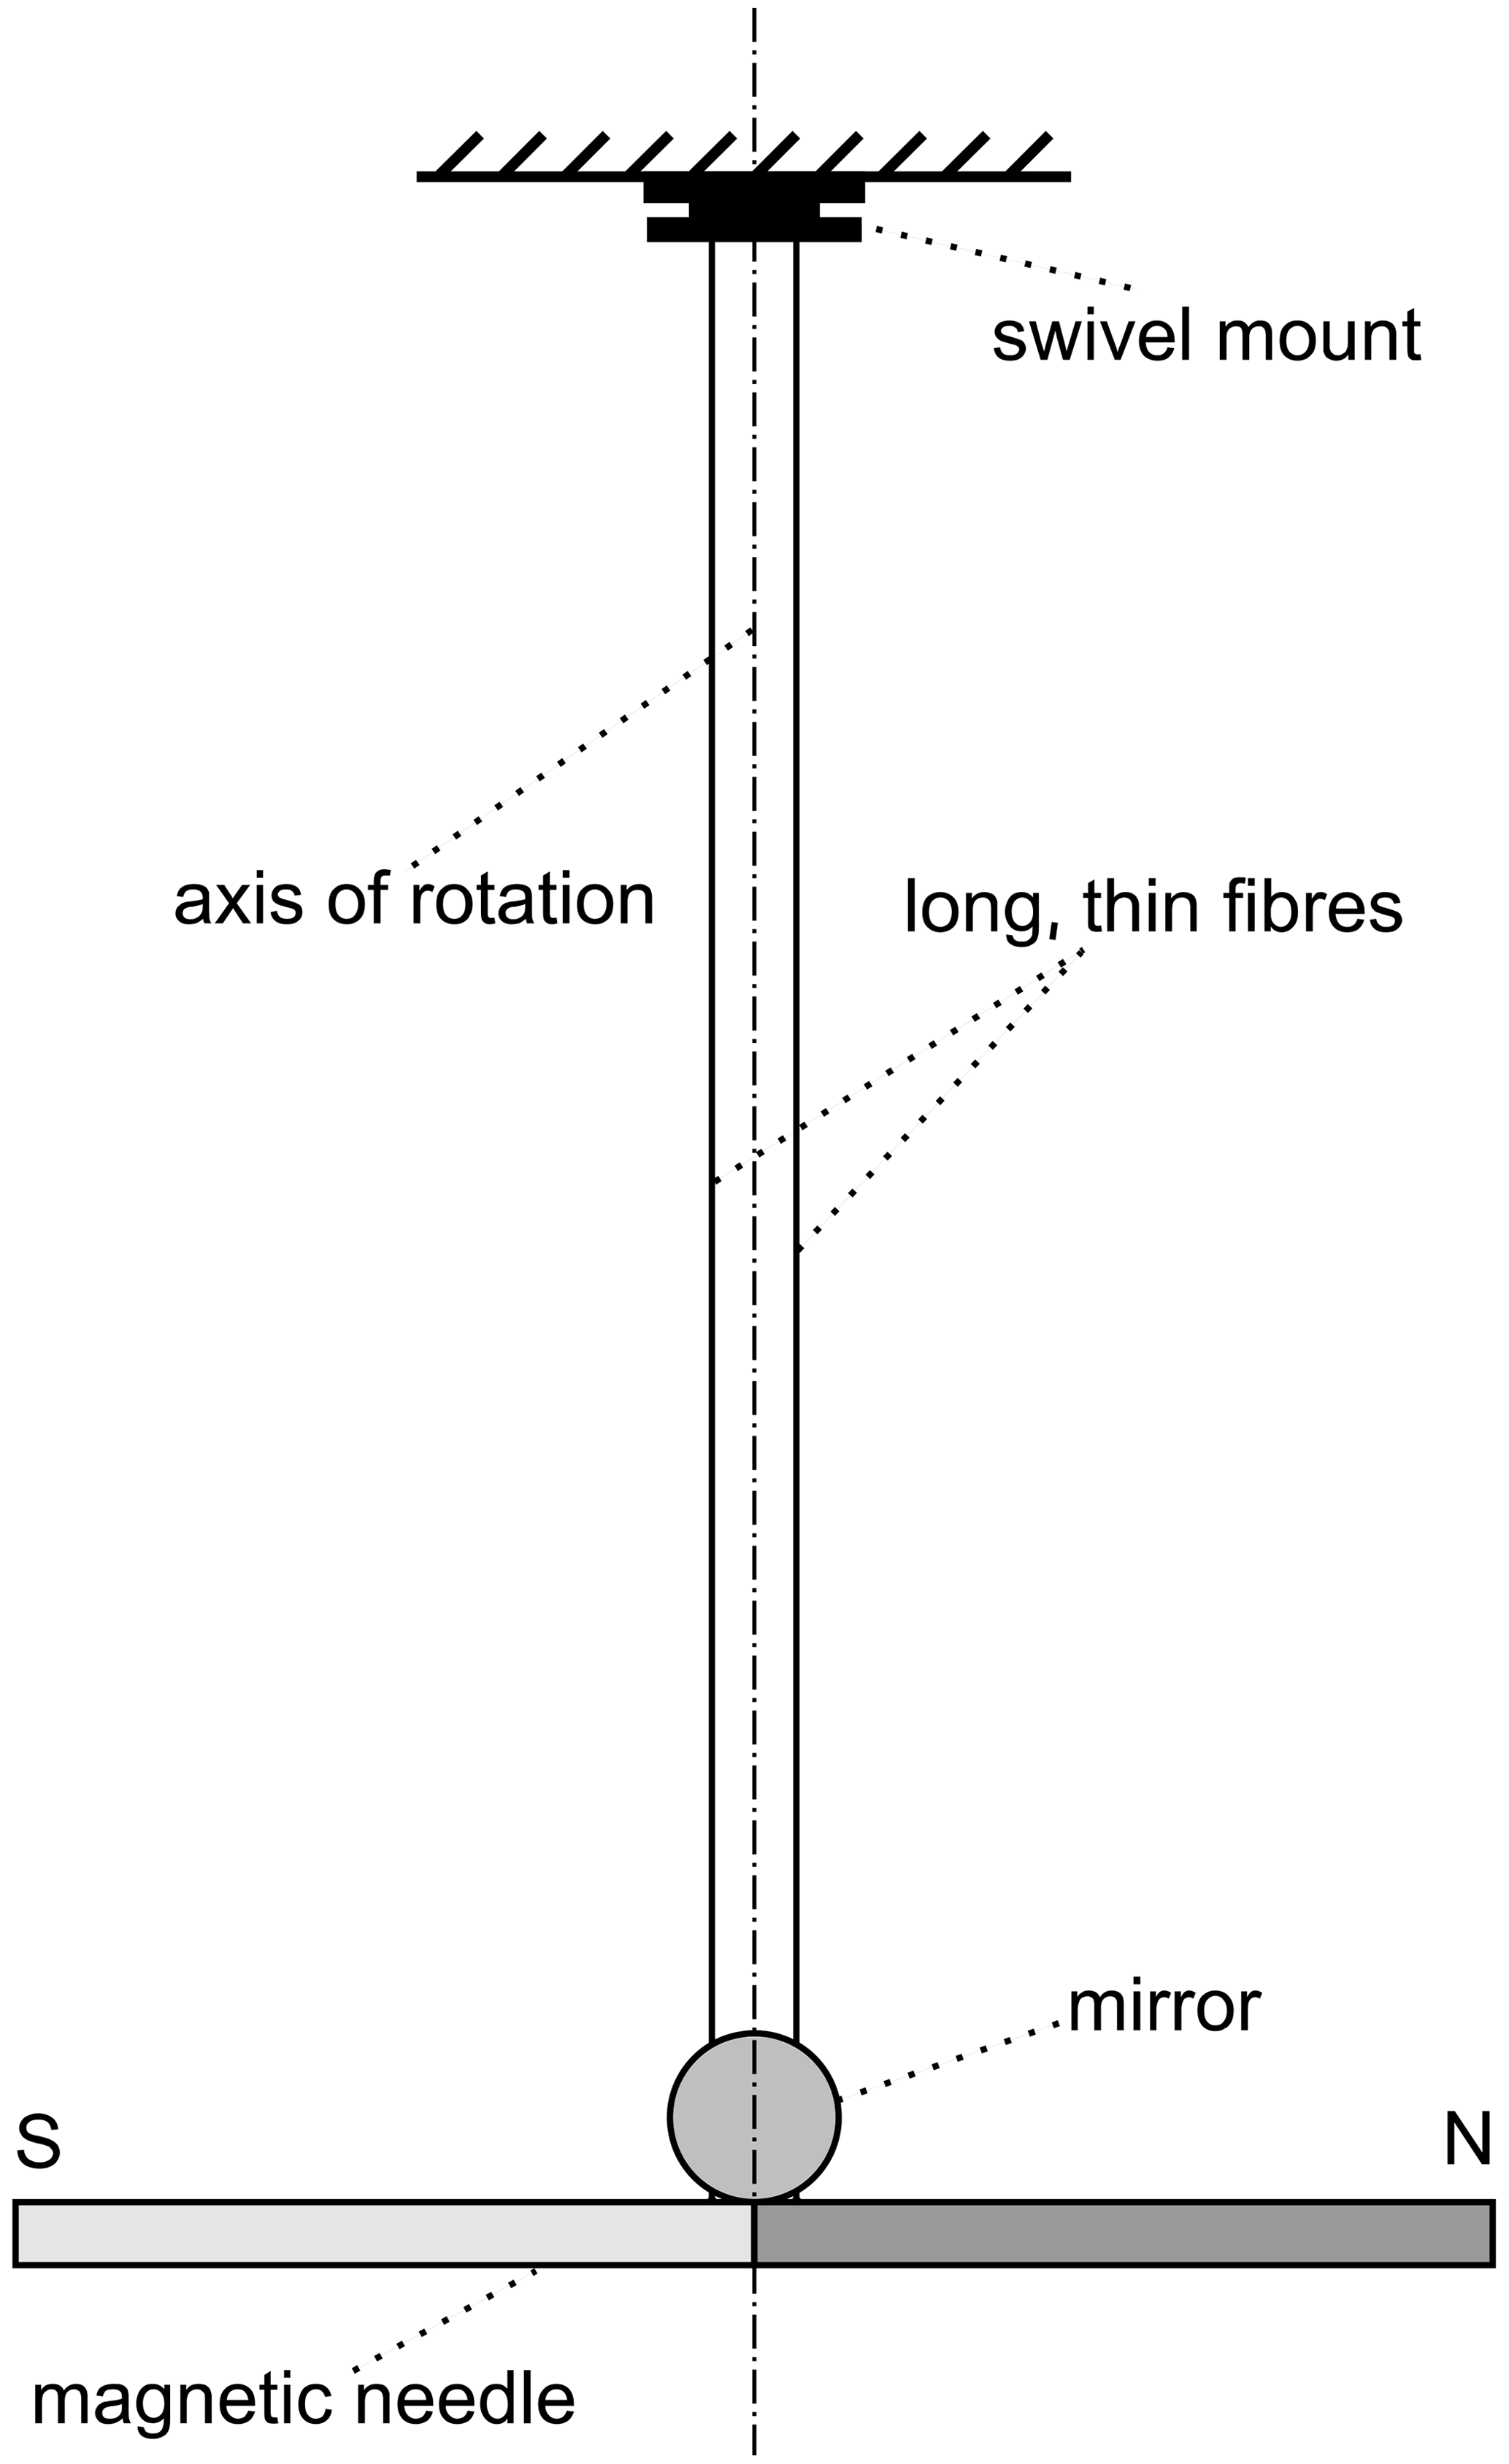

Figure 2Setting the bifilar device to the working position (top view). First, the northern end of the magnetic needle points to magnetic north. The fibres on which the needle hangs do not exert any torque on the needle. (If the distance between the fibres is the same throughout the height of the device, the fibres are exactly vertical.) The swivel mount is then rotated until the magnetic needle reaches the perpendicular direction. In this position, the swivel mount is fixed and the instrument is ready to observe changes in the magnetic field.
When there was a change in horizontal intensity, the needle changed its direction slightly; in the horizontal plane, deviation by a small angle dφ could be observed (Fig. 3). There is a direct relationship between the relative change in horizontal intensity and the angle dφ (Garland, 1979):
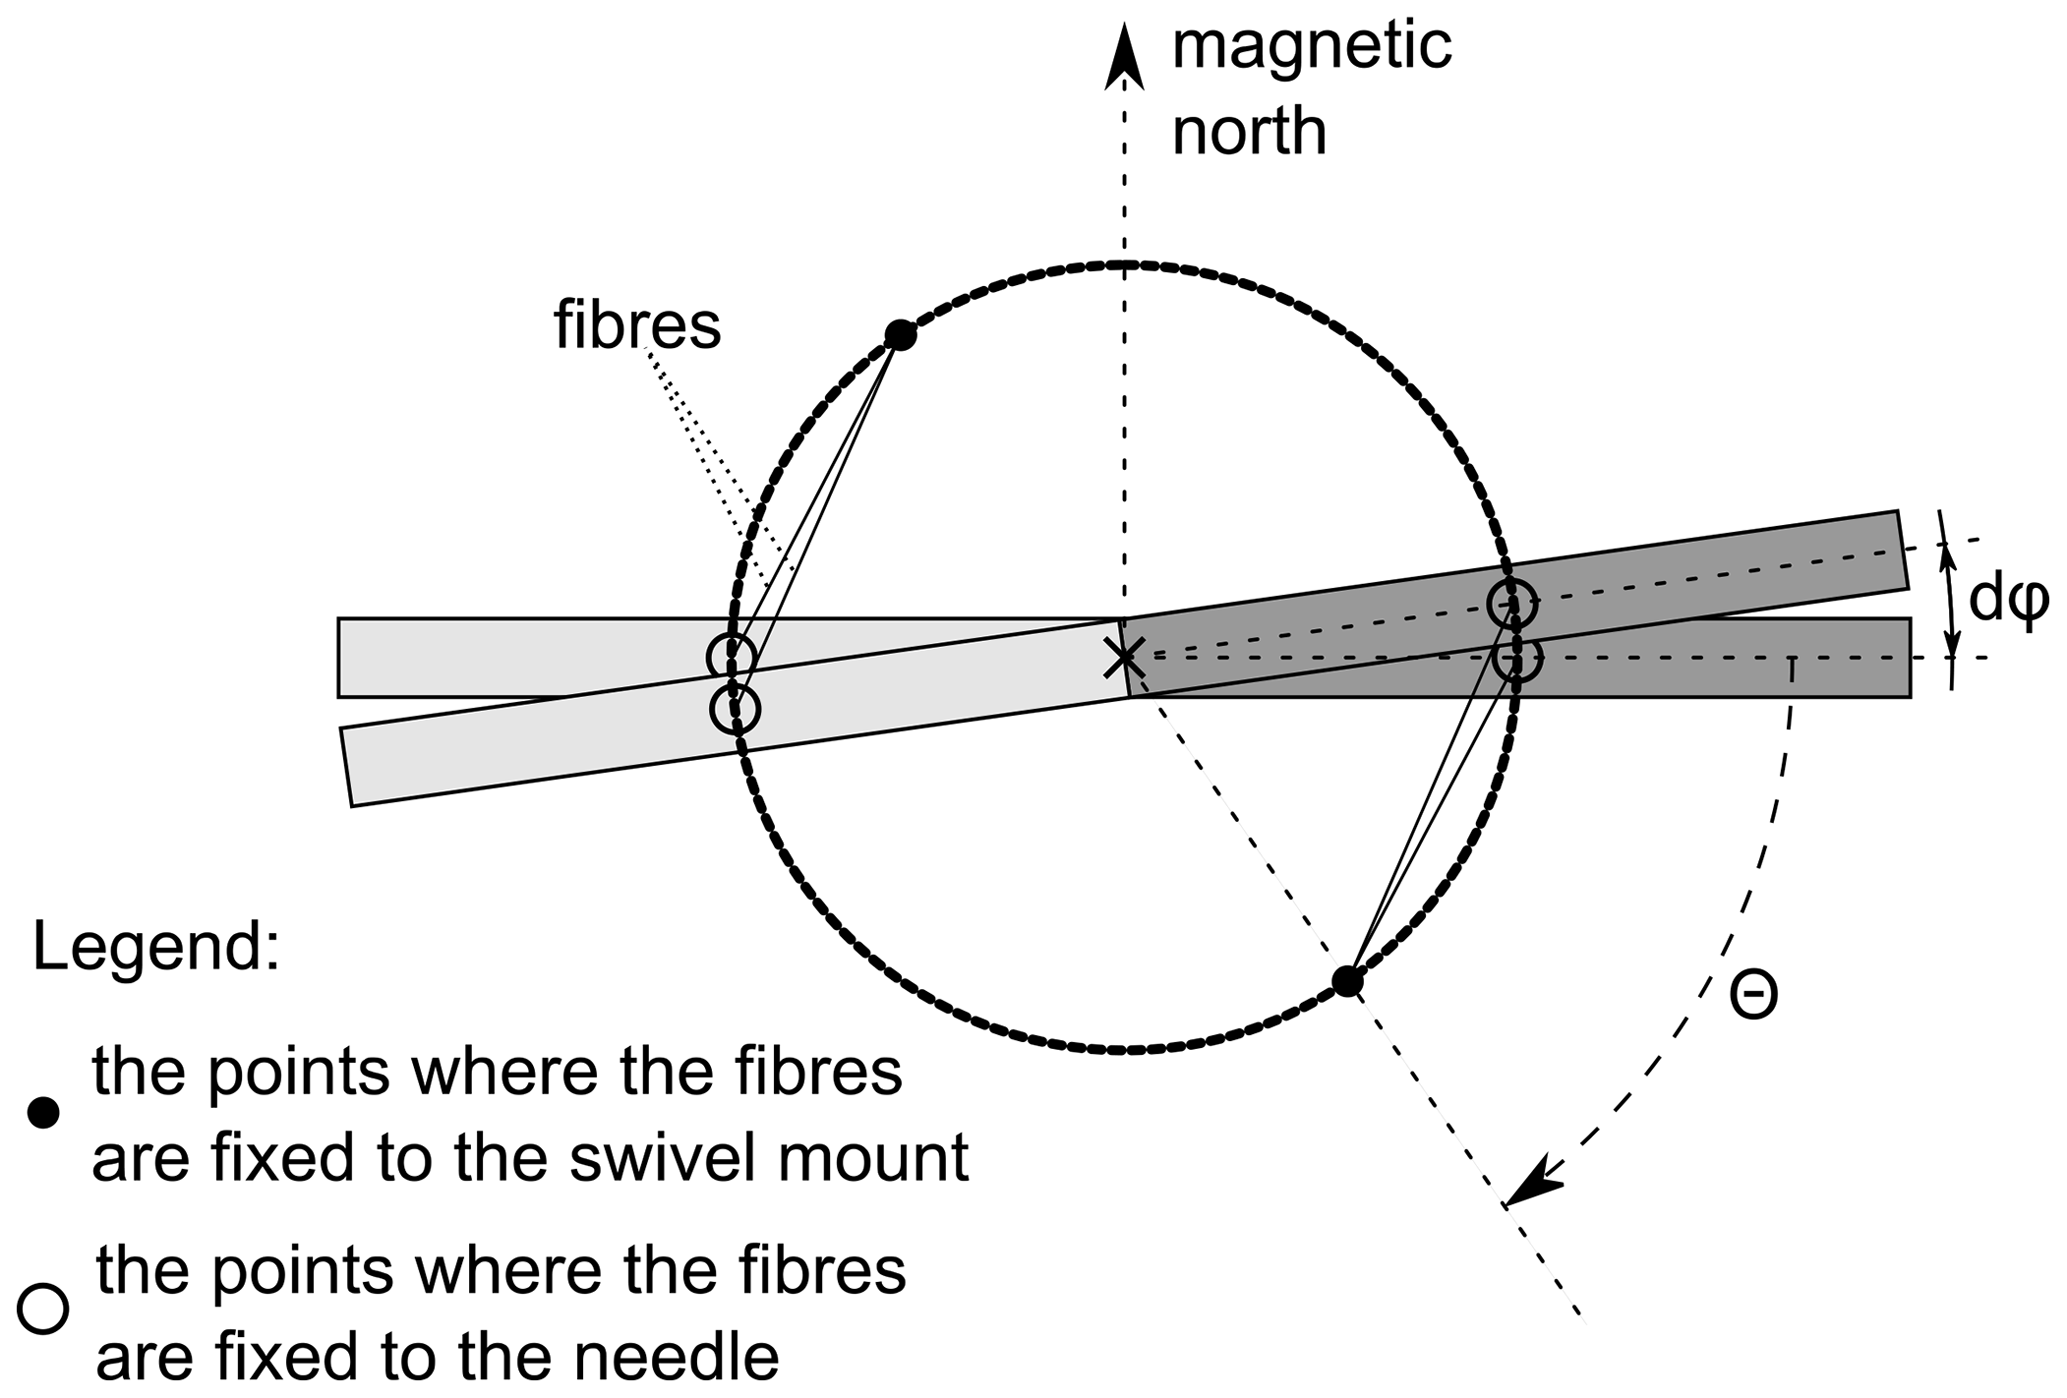
Figure 3Changing the position of the needle by a small angle dφ when the geomagnetic field increases (view from above). If the magnetic field weakens, the deflection dφ is in the opposite direction.
The direct proportionality described above is actually the main idea on which the bifilar device operates. To observe these small angular changes, a scale was placed at a certain distance from the instrument (typically several metres), which the observer observed in a reticle telescope in a mirror mounted on a needle. Equation (1) can, thus, be rewritten in the following form:
where k is a constant and dn is the number of divisions of the scale. The proportionality constant cot (Θ), and from it also the constant k, can be determined by the procedure which we describe later.
In 1839, just 2 years after Gauss's invention of the bifilar magnetometer, Karl Kreil also installed such a device at the Clementinum observatory in Prague. In the first volume of Beobachtungen (Kreil, 1841), which reported on geomagnetic observations, some interesting data about this apparatus can be found. The magnetised rod – a huge magnetic needle – weighed m=2780 g. The fibres on which it hung were so long that, to install the device, the ceiling of the room had to be cut through, and the device was hung from the roof beams; the suspending line had a length of h=4.8 m.
The adjustment was used to determine the change in the horizontal intensity that corresponded to a change of one division on the scale. The procedure used by the observers is remarkable in that no further (or so-called absolute) measurements were necessary to determine the scale value. Because we have not come across a description of this procedure anywhere in modern literature, we devote a few paragraphs to it.
We reconstructed the procedure for obtaining the scale value (Kreil, 1841, p. 23) as outlined in the following. In the first step, the mount on which the magnetised rod was hanging was rotated so that the northern magnetic end of the needle pointed to the magnetic south (i.e. towards the magnetic pole in the Northern Hemisphere), with the longitudinal axis of the needle still lying in the horizontal plane. In this position, the torque of the pair of fibres was zero. The needle was then slightly deviated from this balanced direction by the observer and released (with the longitudinal axis remaining in the horizontal plane). Following this, the released needle returned to its original position with the sum of two torques: from the pair of fibres and from the horizontal intensity. The result was an oscillating movement, the period of which was
where we used the equation for the balance of the torques that would apply in the position of the needle perpendicular to the magnetic meridian:
The new quantities in Eqs. (3) and (4) are as follows: J is the moment of inertia of the needle with respect to the axis of rotation, M is the magnetic moment of the needle and γ represents the torque coefficient for the pair of fibres. According to Garland (1979), γ can be expressed as follows:
where a and b denote the distance of the fibres from each other at the top and bottom of the hanging mount, respectively, and g is the gravity of the Earth (a net acceleration from the gravitation and centrifugal forces). Kreil measured the period as T1=24.03 s.
In the second step, the observers repeated the measurement in the inverted position; both the hanging mount and the needle were rotated 180∘. In such a position, the torsion of the fibres is zero; however, with a small deviation from this position, the torque from the pair of fibres is greater than the torque from the horizontal intensity. Therefore, even in this case, there is oscillating movement of the needle. However, in Eq. (3), the sum of γ+MBH must be replaced by the difference γ−MBH. Thus, we get the period of the oscillations in the inverted position:
Kreil measured the period as T2=88.15 s.
If we exclude the ratio from Eqs. (3) and (6), we get the following useful relation:
by means of which we can express the coefficient of proportionality in Eq. (1). Thus, we obtain the following relation:
From simple geometric considerations and from the known distance between the mirror and the scale, Kreil determined the constant k in Eq. (1); he found that one scale interval corresponded to an angular deviation of 18.5757′′. This corresponds to a relative change in horizontal intensity of .
From the above-mentioned value of 18.5757′′ and the distance between the mirror and the scale (5.552 m), we can easily find out a detail about the device, namely that the distances between the marks on the scale were 0.5 mm.
However, there was also one minor problem that slightly complicated the operation of this undeniably elegant and straightforwardly simple apparatus. It proved necessary to consider the fact that the magnetisation of the needle was not constant. This problem is also known with much more modern magnetometers that use a magnetised needle, such as the quartz horizontal magnetometer (QHM; Wienert, 1970), which was a common device until the 1990s. The magnetisation of a permanent magnet can change (decrease or grow) with a change in temperature or it can lessen when the magnet is hit during an inattentive manipulation or accident, when the ferromagnetic material in some magnetic domains changes from an ordered to a random orientation.
Karl Kreil was aware of the problem of declining needle magnetic strength. On 1 August 1840, i.e. more than a year after the first set-up of the bifilar at Clementinum, the fibre tore during handling of the device. This happened in the middle of the calibration measurements, by which Kreil wanted to determine the current value of the scale value and compare it with the value found in May 1839.
Using incomplete data from the interrupted measurements, Kreil managed to estimate that the scale value was at the time before fibre rupture. In our opinion, we must admit a certain inaccuracy in this provisional value, as (in addition to the incomplete data on which Kreil relied) two other factors may have contributed to the inaccuracy: (1) the difference in room temperatures when performing calibration measurements in 1839 and 1840 and (2) the change in the magnetisation of the needle due to impact (when the needle fell during the accident).
Let us take a closer look at the temperature in the room during the measurements. For 1 August 1840, the source (Kreil, 1842, p. XI) gives four room temperature values: 17.3, 17.3, 17.0 and 17.2 ∘R (i.e. 21.6, 21.6, 21.2 and 21.5 ∘C – with the average of these values being 21.5 ∘C). However, to our knowledge, the room temperature for 31 May 1839 was not recorded anywhere. Therefore, we must estimate the temperature conditions in the measuring room based on the outdoor temperatures, which are available. The assumption that the room was located in the building of the Clementinum astronomical observatory with relatively massive walls must also be taken into account.
In the spring and early summer, the inner walls of the unheated room were still warming up. On the contrary, the walls were already warmed up before the beginning of August. We can get some idea of the indoor temperatures based on data on outdoor temperatures recorded by the Clementinum observatory. Such data are available in the database that is accessible on the Czech Hydrometeorological Institute website (https://www.chmi.cz/historicka-data/pocasi/praha-klementinum#, last access: 29 March 2023).
Checking the above-mentioned database, one can see that the outdoor daily mean temperature during the May calibration measurement in 1839 was 2∘ higher than during the calibration measurement in August 1840. Namely, the temperatures were 18.1 and 16.0 ∘C, respectively. However, this might be misleading information. As the measurements were probably performed during the day, and we believe that they most likely took place during the morning, the outdoor temperature on the day of the measurement itself is not very important; the current outdoor temperature did not have time to significantly influence the temperature of the inner building walls. Actually, in the days preceding the measurement days, the temperatures in 1839 were much lower than in 1840. Going back from 1 to 30 d before the days of the calibrations, the outdoor daily mean temperature averages were 1 to 5 ∘C higher for 1840 than for 1839. Therefore, it is reasonable to assume that the room air was warmer during the calibration measurements in 1840 than during the measurements in 1839. Even if the magnetisation of the needle was not weakened by the gradual decrease in the magnetic force, the magnetisation would be weaker in the measurements of 1 August 1840 due to the temperature difference alone.
Kreil (1841, p. 24) mentioned that “[when the thread tore and the needle fell] the box to which the mirror measure was screwed ruptured”. Due to such a blow, the magnetised rod could have lost some of its magnetisation. Thus, from the calibration measurements of 1 August 1840, Kreil perhaps found considerably less magnetisation compared with the measurements made with the needle before the fibre tore.
Despite these considerations about the possible inaccuracy of Kreil's determination of the decrease in magnetic force in the needle, it is nevertheless reasonable to assume that the magnetisation of the needle really weakened from May 1839 to the end of July 1840; however, it cannot be said with certainty if this occurred gradually or if some sudden changes occurred.
For a new, stronger fibre, Kreil then determined a scale value equal to of the total horizontal intensity. Rounded to two significant figures, the average between and is equal to this value for the new, stronger fibre. Thus, when Kreil was replacing the fibre, he set up the apparatus so that there was no substantial discontinuity and the observations in the scale divisions were well connected at the critical time around 1 August 1840. This implies that, in using the same scale value for the period before August 1840 as after August 1840 (i.e. the value set by Kreil for the new fibres), we commit only an acceptable inaccuracy.
The bifilar device, which Karl Kreil installed in mid-1839, operated in the Clementinum observatory until the end of 1845. From 1 January of the following year, the old device was replaced by a new one (Hejda et al., 2021a). It worked on exactly the same principle but was probably much smaller than its predecessor. We assume that this new device was in operation until 1904.
Only about a month after the beginning of systematic geomagnetic observations at Clementinum, the local observers recorded an interesting intense magnetic storm. The event began suddenly on 3 September 1839 in the evening and went on to also be very strong the next day. The recorded course of magnetic declination, horizontal intensity and inclination (Kreil, 1842, p. 55) is a valuable study material which, even in the current state of relatively advanced knowledge of the topic, can still significantly contribute to a better understanding of the mechanisms of such extreme geomagnetic disturbances. Such extreme phenomena are rare, and we have only a few comparable events available for study in the modern space era and the digital age.
Raw data from the yearbook for magnetic declination and horizontal intensity, which were provided in divisions of the scales of the instruments, were converted to angular and physical units as described in Hejda et al. (2021a, 2022). For this particular magnetic storm, the converted data are accessible in an online database at https://doi.org/10.1594/PANGAEA.936848 (see Hejda et al., 2021c, b) and are shown in Fig. 4. In addition, the course of magnetic inclination is shown here with the data obtained via the conversion of the raw inclination data using angular units (Kreil, 1842, p. 55); those observations were carried out by means of an inclinatorium with a magnetised needle as long as 81.6 cm (Kreil, 1841, p. 25). An analysis of this storm, which was published in Hejda et al. (2021a), pointed to two sharp short-term decreases in horizontal intensity on 4 September 1839 in the early morning hours. They were interpreted as possibly being caused by the substorm electrojet or some other electric currents in the auroral oval. Three arguments substantiated the claim that these sharp variations could be two consecutive magnetic substorms generated by a substorm electrojet or that they might have been caused by some other electric currents closely related to the auroral oval: (1) the profile of the course for these disorders – these were very rapid variations similar to those typical of regions with the presence of the auroral oval; (2) the time of their occurrence – they occurred at night (after conversion to the magnetic local time (MLT), they occurred at 01:39 and 04:59 MLT, respectively); and (3) the occurrence of a significant aurora at the time of the geomagnetic disorder – there is a written record of the aurora observation on 3 September 1839 at Ashurst in West Sussex, England (Snow, 1842, p. 15).

Figure 4The first magnetic storm recorded at the Clementinum observatory in Prague on 3–4 September 1839 (Hejda et al., 2021a, b). The course of magnetic declination, horizontal intensity and magnetic inclination is shown. For the records of declination and inclination, conversion from divisions of the instrument scale obtained from the yearbook (Kreil, 1842) to angular units was performed. Despite the visible gap in the inclination record, it is indicated here that a slight change in inclination during the main phase of a magnetic storm was feasible at that time.
All three of these arguments strongly suggest that the auroral oval was expanded to middle geographic and geomagnetic latitudes (and perhaps even more towards the Equator) during 3–4 September 1839, in contrast to its usual position in areas near the Arctic Circle. This is a remarkable phenomenon that contributes to the confirmation that at least some of the strongest magnetic storms, even in the middle latitudes, can be caused by the same mechanism as strong magnetic disturbances in the high latitudes (e.g. Cid et al., 2015; Valach et al., 2019; Hejda et al., 2021a). A similar conclusion was reached by Valach et al. (2019) during a study of another magnetic storm observed at Clementinum, which occurred on 17 November 1848.
The worldwide network of magnetic observatories organised by the Göttingen Magnetic Union was aimed at improving the knowledge of the configuration of the magnetic field over the Earth in general. Kreil realised that there are many questions that can only be answered using observations made within a dense network covering a small territory. These include, for example, the connection between the magnetic force and the nature of the Earth's crust, the influence that different types of mountains may exert on the magnetic force or the dependence of the strength of the magnetic force on the altitude of the observation location.
Kreil discussed the idea of organising a magnetic survey in Bohemian territory among the members of the Royal Bohemian Society of Sciences, and the society supported him not only verbally but also financially. This allowed him to improve the instrumentation, especially with respect to the purchase of the Lamont's non-magnetic theodolite, which was suitable for measurements of the magnetic parameters D, H and I at field stations. The instrumentation further included a thermometer, as the measurement of magnetic intensity was temperature dependent for the available instruments at that time; a barometer for estimating altitude; an astronomical theodolite for estimating longitude and latitude; and a chronometer. As the chronometer showed a daily deviation of more than 10 s in the observatory's quiescent environment tests, it was assumed that these deviations would be much greater under field conditions. Therefore, Kreil also used the astronomical theodolite to accurately determine the time according to the Sun and the stars.
It is worth noting that diverse physical units were used at that time. Longitudes were measured from El Hierro island (Canary Islands, Spain); however, in some tables, longitudes from Greenwich were also given, with the difference being 17∘39′37′′. Temperature was given in degrees Réaumur, barometer readings were given in Paris lines (2.255891 mm) and altitude was given in Toisen (∼ 1.95 m). The intensity of the magnetic field was measured in units based on millimetres, milligrams and seconds (equal to 10−5 T), introduced by Gauss and used in the framework of the Göttingen Magnetic Union. However, for consistency with papers and maps based on imperial units, the recalculation of these units was added to the summary table of results.
The first magnetic survey in Bohemia, the western part of the historical Czech lands, was started was started in 1843 (Kreil, 1847). The observations were scheduled for 2 years. In 1843, Kreil visited 9 sites in East and South Bohemia, and he visited 13 sites in North and West Bohemia in 1844. Although the original plan was fulfilled in the autumn of 1844, there was the need to repeat some measurements due to, for example, unfavourable weather conditions or excessive rush in the previous measurement. Therefore, in 1845, Kreil made repeated measurements at four points and added one new point. The measurements in 1845 had one more purpose. The Austrian Imperial Court approved Kreil's project for measurements throughout the Austrian monarchy and released funds to purchase new instruments. It was a good opportunity to test some of them.
The whole issue also had its human side. For each planned observation site, a contact person had to be found in advance to help with the selection of a suitable site and to allow measurements to be made there. Among them were nobles, higher school officials, clergy or senior city officials. Therefore, each observation report in Kreil (1847) begins with a thank-you to these individuals and with a detailed description of the location where the observation took place; this is followed by a complete report on magnetic and geodetic measurements and closed by local geology.
The reports on observations at individual sites are followed by the summary of data analysis and processing. The data were reduced to the epoch 1845.0 by means of variation observations at Clementinum observatory. Results were presented in the form of tables and maps of contour lines of individual components. Figure 5 shows contour maps for magnetic declination, inclination and horizontal intensity. The contours for both the figures were computed from the original data using MATLAB software. Kreil's geomagnetic survey revealed the most important features of the geomagnetic field distribution in Bohemia, which, from the viewpoint of our modern knowledge, reflect the existence of the main magnetic field, generated in Earth's liquid core by magnetohydrodynamic processes, as well as the local geomagnetic anomalies, which originate in the crustal magnetic rocks. The main features on the maps are consistent with the latest geomagnetic surveys (Hejda et al., 2012).
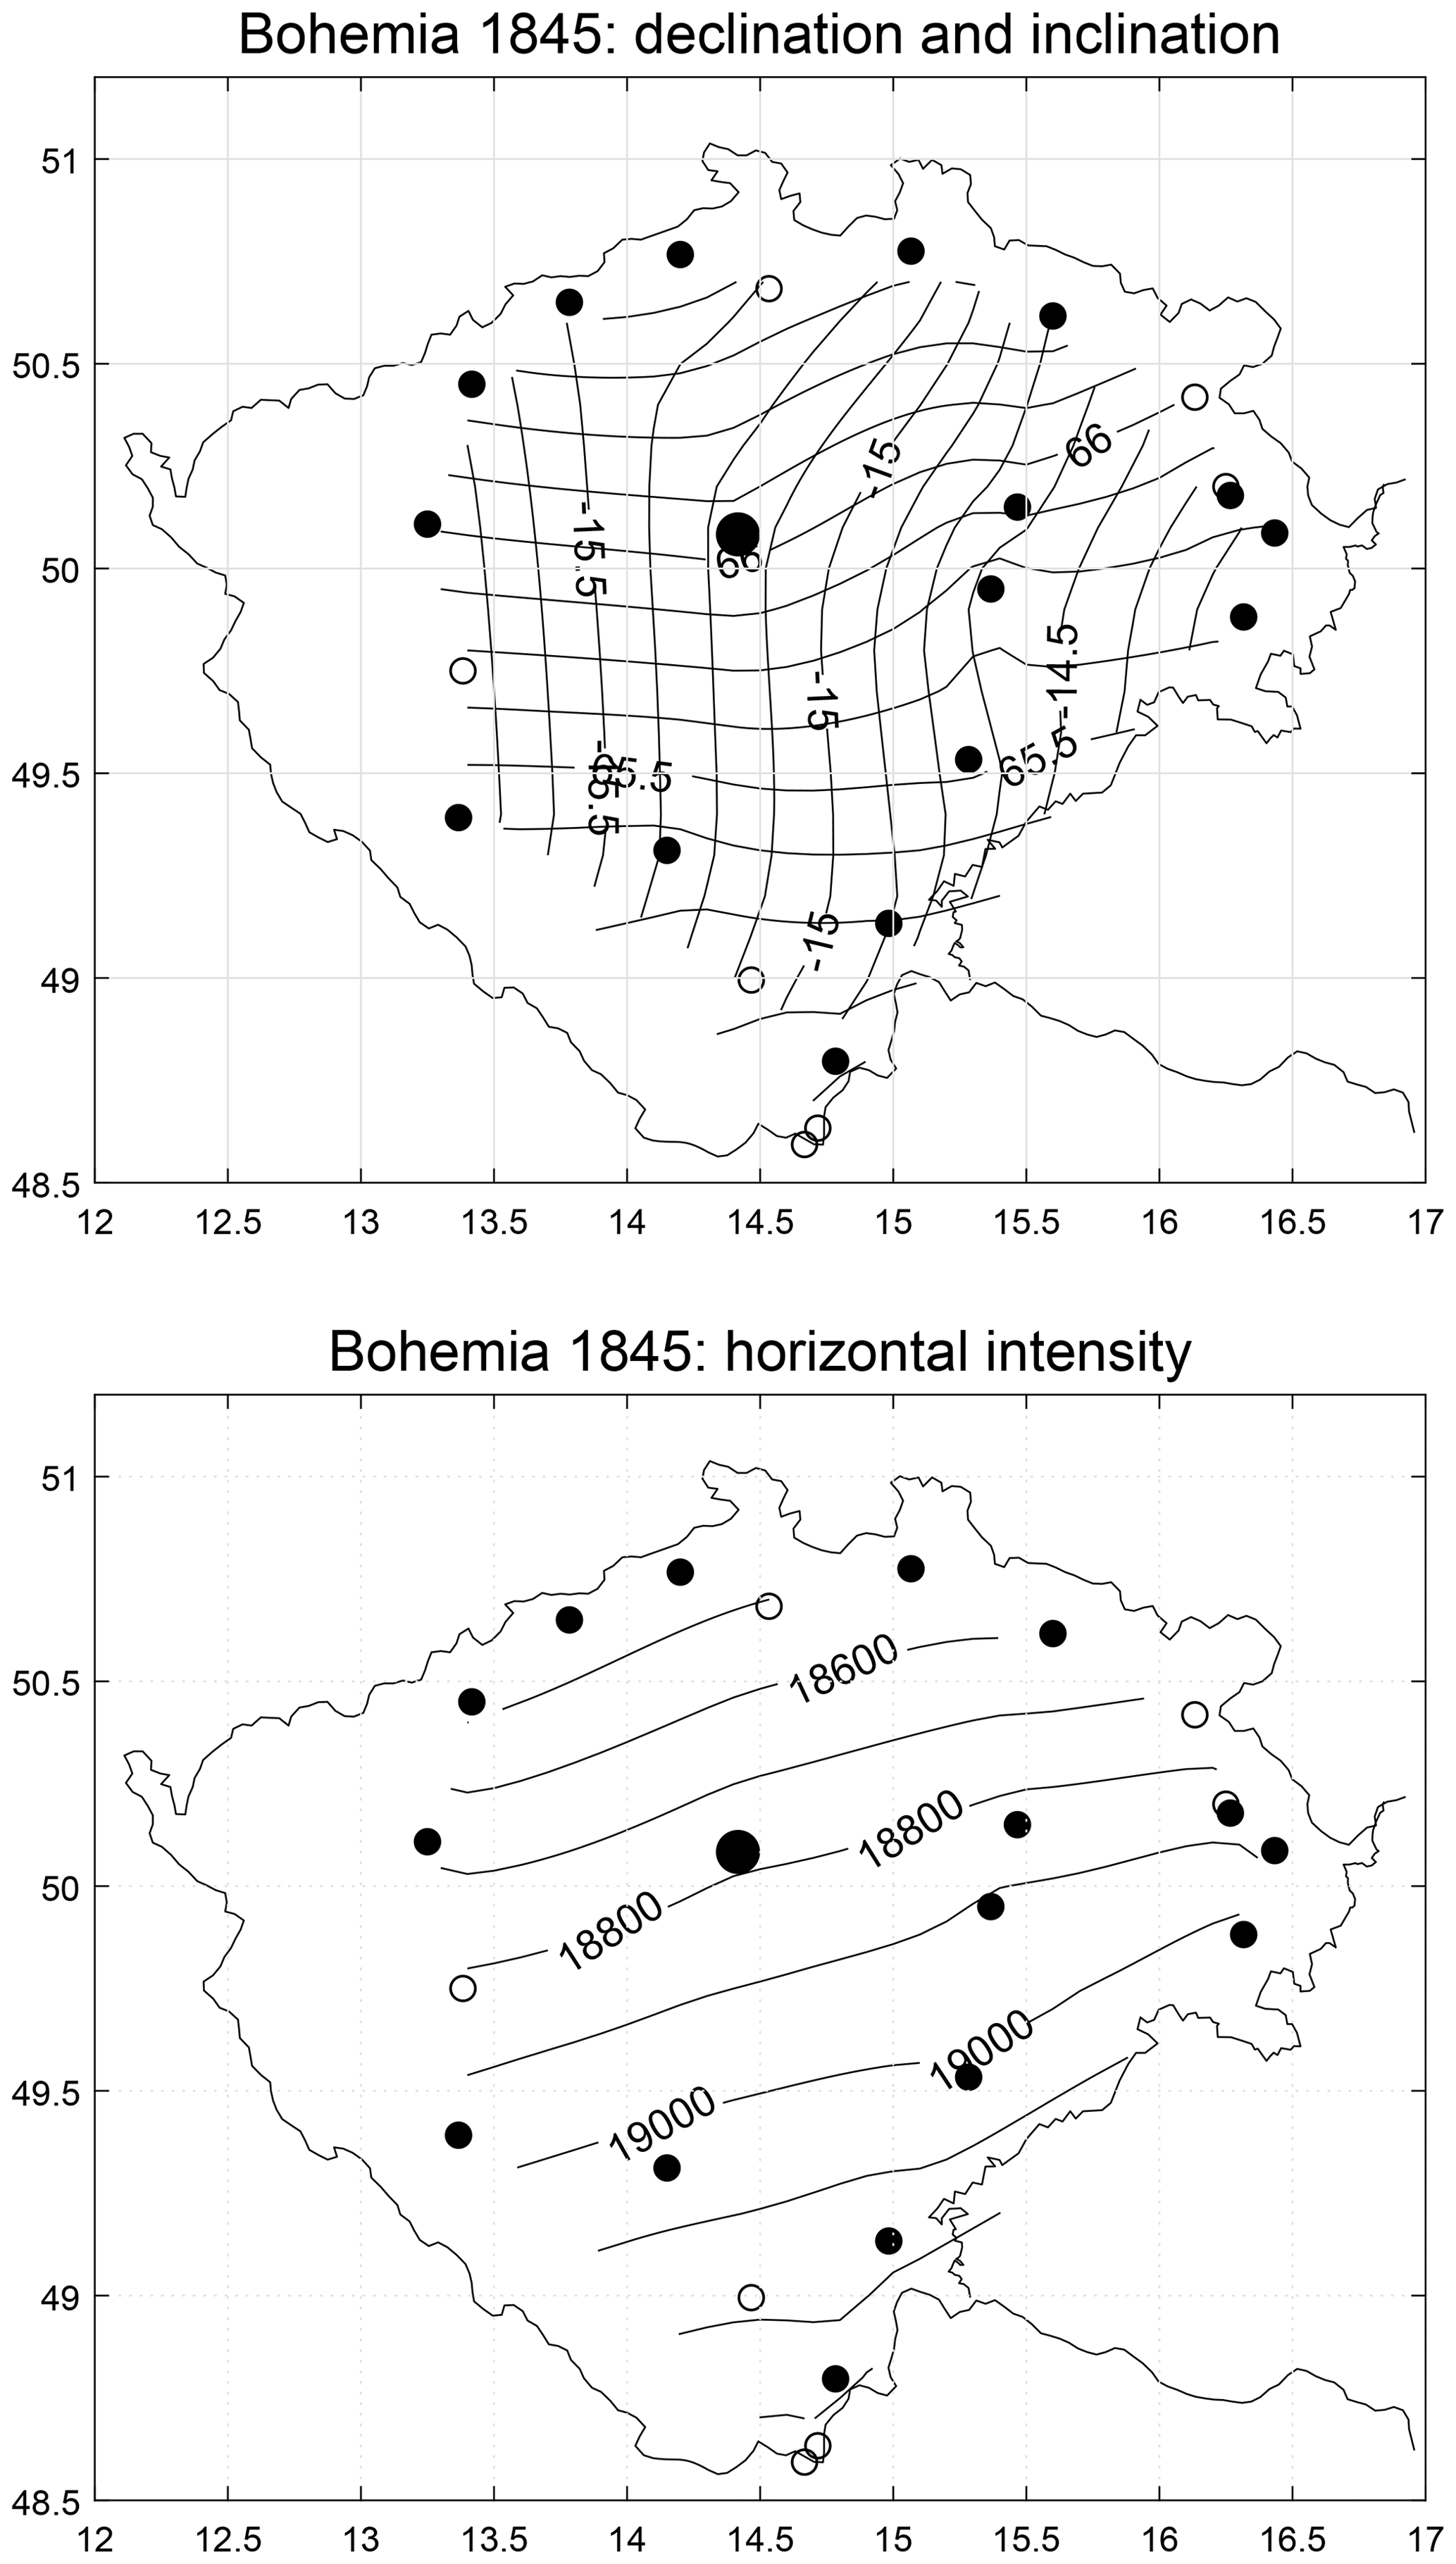
Figure 5The contour maps for the magnetic declination (nearly vertical contours with values between −14.25 and −15.75∘, where the minus sign shows that the declination was western at that time), the inclination (nearly horizontal contours with values between 65.125 and 66.375∘) and the horizontal intensity (nearly horizontal contours with values between 18 500 nT in the south and 19 300 nT in the north). The contours are based on Kreil's original data. The observation locations are shown as circles, and the empty symbols denote points without inclination measurements.
Over the next 10 years, Kreil, with the help of Fritsch, made magnetic measurements in other parts of the Austrian territory, other countries in southeastern Europe and on the coast of Asia Minor. The resulting maps, reduced to the 1850.0 epoch, were published in Kreil (1862).
In this paper, we mentioned the events, some technical details about the observation instruments and the observation records that we consider to be crucial for the beginnings of geomagnetic field measurement at the Clementinum observatory in Prague. We showed that Karl Kreil was a key figure in this process. We draw attention to the fact that systematic regular observations of the magnitude of the magnetic field had already commenced in Prague in 1839; this corresponds to 2 years after Gauss invented the bifilar device and 5 years after Gauss had introduced the physical unit for the magnetic field. This ranks Clementinum among the world's leading workplaces that have significantly contributed to the development of geomagnetism.
The bifilar device, which was in operation at Clementinum at the beginning of geomagnetic observations, made it possible to record several interesting magnetic storms, for example the above-mentioned event of 3–4 September 1839. The tracking of such old events represents unique material for the study of phenomena that are part of today's dynamically developing topic of space weather. This shows that delving into old annals can offer a benefit, even for the most modern contemporary science.
Mapping the distribution of the geomagnetic field, on the other hand, represents another aspect of research on the Earth's body, in which regular geomagnetic surveys continue to these days.
Daily observations of the declination (1839–1917) and horizontal intensity (1839–1904) are available in the supplementary material of Hejda et al. (2021a), and magnetic storm data (declination and horizontal intensity) and term-day observations are available from https://doi.org/10.1594/PANGAEA.936921 (Hejda et al., 2021b). For the particular magnetic storm outlined in this paper, the converted data are accessible in an online database at https://doi.org/10.1594/PANGAEA.936848 (Hejda et al., 2021c).
PH authored most of the introductory historical content of the paper (Sects. 1 and 2) and also wrote the section on the first magnetic survey in Bohemia (Sect. 5). FV prepared the passage about the bifilar magnetometer (Sect. 3). MR put together the information on the first recorded magnetic storm (Sect. 4). The authors participated equally in the final editing of the manuscript.
The contact author has declared that none of the authors has any competing interests.
Publisher's note: Copernicus Publications remains neutral with regard to jurisdictional claims in published maps and institutional affiliations.
We would like to thank Susan Macmillan and Domenico Di Mauro for their helpful comments, which improved the paper.
This research has been supported by the Vedecká Grantová Agentúra MŠVVaŠ SR a SAV (grant no. 2/0085/21).
This paper was edited by Roman Leonhardt and reviewed by Susan Macmillan and Domenico Di Mauro.
Cid, C., Saiz, E., Guerrero, A., Palacios, J., and Cerrato, Y.: A Carrington-like geomagnetic storm observed in the 21st century, J. Space Weather Spac., 5, A16, https://doi.org/10.1051/swsc/2015017, 2015. a
Garland, G. D.: The contributions of Carl Friedrich Gauss to geomagnetism, Hist. Math., 6, 5–29, 1979. a, b, c, d
Gauss, C. F.: Intensitas vis magneticae terrestris ad mensuram absolutam revocata [The intensity of the Earth's magnetic force reduced to absolute measurements]. Societatis regiae scientarium Gottingensis [Royal Society of Scientists of Göttingen], read on 15 December 1832, printed in Volume 8 of the treatises of the Society, 1832. a
Gauss, C. F.: Ueber ein neues, zunächst zur unmittelbaren Beobachtung der Veränderungen in der Intensität des horizontalen Theils des Erdmagnetismus bestimmtes Instrument [About a new instrument, first intended for the direct observation of the changes in the intensity of the horizontal part of the terrestrial magnetism], in: Resultate aus den Beobachtungen des magnetischen Vereins im Jahre 1837 [Results from the observations of the Magnetic Union in the year 1837], edited by: Gaus, C. F.s and Weber, W., Verlage der Dieterichschen Buchhandlung, Göttingen, 1–19, 1838. a
Glassmeier, K.-H.: Gauss, Carl Friedrich (1777–1855), in: Encyclopedia of Geomagnetism and Paleomagnetism, edited by: Gubbins, D. and Herrero-Bervera, E., Springer, Dordrecht, 279–280, ISBN 978-1-4020-3992-8, 2007. a
Hejda, P., Horáček, J., and Bayer, T.: Secular variation on the territory of the Czech Republic and reduction of the magnetic survey to the epoch 2010.5. Ann. Geophys.-Italy, 55, 1095–1099, https://doi.org/10.4401/ag-5445, 2012. a
Hejda, P., Valach, F., and Revallo, M.: The geomagnetic data of the Clementinum observatory in Prague since 1839, Ann. Geophys., 39, 439–454, https://doi.org/10.5194/angeo-39-439-2021, 2021a. a, b, c, d, e, f, g, h
Hejda, P., Revallo, M., and Valach, F.: Data of magnetic storms and term-day observations from the Prague-Clementinum observatory (1839–1849), PANGAEA [data set], https://doi.org/10.1594/PANGAEA.936921, 2021b. a, b, c, d
Hejda, P., Revallo, M., and Valach, F.: Magnetic storm observations from the Prague-Clementinum observatory on 1839-09-03, PANGAEA [data set], https://doi.org/10.1594/PANGAEA.936848, 2021c. a, b
Hejda, P., Revallo, M., and Valach, F.: Magnetic storm and term-day observations at the Prague observatory Clementinum in the mid-19th century, Geosci. Data J., 10, 39–44, https://doi.org/10.1002/gdj3.141, 2022. a, b
Kreil, K.: Magnetische und Meteorologische Beobachtungen zu Prag, Wiener Zeitschrift für Physik, Chemie und Mineralogie, Erster Band, 18–37, 1840. a
Kreil, K.: Magnetische und meteorologische Beobachtungen zu Prag, Erster Jahrgang: Vom 1. Juli 1839 bis 31. Juli 1840 [Magnetic and meteorological observations in Prague, first volume: from 1 July 1839 to 31 July 1840], Druck und Papier von Gottlieb Haase Söhne, Prag, 1841. a, b, c, d, e, f
Kreil, K.: Magnetische und meteorologische Beobachtungen zu Prag, Zweiter Jahrgang: Vom 1. August 1840 bis 31. Juli 1841 [Magnetic and meteorological observations in Prague, second volume: from 1 August 1840 to 31 July 1841], Druck und Papier von Gottlieb Haase Söhne, Prag, 1842. a, b, c, d, e
Kreil, K.: Magnetische und geographische Ortbestimmungen in Böhmen, ausgeführt in den Jahren 1843–1845. [Magnetic and geographical localizations in Bohemia, carried out in the years 1843–1845.], in: Abhandlungen der Königlichen Böhmischen Gesellschaft der Wissenschaften, 4 (1845–1846), 381–475, 1847. a, b
Kreil, K.: Magnetische und geographische Ortbestimmungen im südostlichen Europa und einigen Küstenpunkten Asiens. [Magnetic and geographic localizations in south-eastern Europe and some coastal points in Asia], in: Denkschriften der Kaiserlichen Akademie der Wissenschaften, Math.-nat. Classe 20, 1–94, 1862. a
Mayaud, P. N.: Derivation, Meaning, and Use of Geomagnetic Indices, American Geophysical Union, Washington, D. C., Geoph. Monog. Series, 22, 154 pp., https://doi.org/10.1029/GM022, 1980. a
Reich, K. and Roussanova, E.: Karl Kreil und der Erdmagnetismus, Verlag der Österreichischen Akademie der Wissenschaften, ISBN 978-3700181866, 2018. a
SIG: Observations magnétiques a Praha et a Stará Ďala. Ročenka Čsl. státního ústavu geofysikálního za rok 1927 – Annuaire de l'Institut géophysique de la République Tchécoslovaque 1927, Praha, 1927. a
SMI: Meteorologická a magnetická pozorování́ na Státní́ Hvězdárně v Praze (Klementinum) – Observations météorologiques et magnétiques faites l'Observatoire Astronomique de Prague (Klementinum), Vol. 79/81, 1918–1920, State Meteorological Institute, Prague, 1923. a
Snow, R.: Observations of the Aurora Borealis from September 1834 to September 1839, Noyes and Barclay, Castle Street, Leicester Square, London, UK, 1842. a
Valach, F., Hejda, P., Revallo, M., and Bochníček, J.: Possible role of auroral oval-related currents in two intense magnetic storms recorded by old mid-latitude observatories Clementinum and Greenwich, J. Space Weather Spac., 9, A11, https://doi.org/10.1051/swsc/2019008, 2019. a, b
Van Baak, D. A.: Re-creating Gauss's method for non-electrical absolute measurements of magnetic fields and moments, Am. J. Phys., 81, 738–744, https://doi.org/10.1119/1.4816806, 2003. a
Wienert, K. A.: Notes on geomagnetic observatory and survey practice, United Nations Educational, Scientific and Cultural Organization (Unesco), Van Buggenhoudt, Brussels, 1970. a
Wittmann, A. D.: Carl Friedrich Gauss and the Gauss Society: a brief overview, Hist. Geo Space. Sci., 11, 199–205, https://doi.org/10.5194/hgss-11-199-2020, 2020. a
- Abstract
- Beginnings of the geomagnetic observations in Prague – the merit of Karl Kreil
- Organisation of geomagnetic observations and their records in printed yearbooks
- The first bifilar magnetometer in Prague
- The first magnetic storm observed at Clementinum
- The first magnetic survey in Bohemia
- Conclusions
- Data availability
- Author contributions
- Competing interests
- Disclaimer
- Acknowledgements
- Financial support
- Review statement
- References