the Creative Commons Attribution 4.0 License.
the Creative Commons Attribution 4.0 License.
 | 21 Feb 2020
A 1782–1794 sea level record at Trieste (northern Adriatic)
Fabio Raicich
The physician Leonardo Vordoni recorded sea heights at Trieste from 1782 to 1794 because of his interest in studying the connections between tides and the course of diseases that he attributed to the same forces. The data, expressed in Paris feet and inches (1 ft = 12 in. = 32.4845 cm), consist of heights measured on a pole, relative to the green algae belt corresponding to the mean high water. The measurements were reported in a manuscript that was recently found in the correspondence received by Giuseppe Toaldo, an astronomer in Padua. The observations were made twice a day until June 1791 and more frequently afterwards; the data from July 1791 onwards reasonably describe both the astronomical tide and the inverted-barometer (IB) effect. The low frequency of observations and poor metadata information seriously limit the scientific value of the data set, which, therefore, has mainly a historical value. In comparisons with modern data, the amplitude of sea level variations appears rather large, as if a unit shorter than the Paris foot was used. Moreover, an anomalously large decadal trend exists, which might be due to the pole sinking into the sea floor. The sea heights were digitized and are available through SEANOE (SEA scieNtific Open data Edition; https://doi.org/10.17882/62598; Raicich, 2019a).
- Article
(12963 KB) - Full-text XML
- BibTeX
- EndNote


The communities living along the northern Adriatic coast have always been sensitive to sea level variations, in particular to the floods caused by storm surges (locally known as acqua alta). Ancient chronicles about events that occurred in the Venice Lagoon date back to the Middle Ages (Enzi and Camuffo, 1995). In the northern Adriatic the first modern tide gauge stations were established about 150 years ago, and some of them are still active, namely Trieste (since 1859), Venice (1871) and Porto Corsini/Marina di Ravenna (1873) (Fig. 1) (Raicich et al., 2006; Raicich, 2007; Zerbini et al., 2017; Bruni et al., 2019).
However, earlier observations of relative sea level exist, such as those made in the 1751–1769 period by Tommaso Temanza in Venice and in 1779–1792 by Giuseppe Vianelli in Chioggia, about 20 km from Venice (Fig. 1) (Raicich, 2015). Those observations were performed on a regular basis, although with interruptions, by educated persons with a scientific background (medicine, natural sciences, physics, engineering and architecture). The technology and methods were far from modern standards; nevertheless those data can provide valuable information on the sea level variability in the region on various timescales, from daily to interannual. Unfortunately, those data cannot be reliably connected to modern observations due to insufficient information on vertical height references.
Modern sea level observations at Trieste started when a self-recording tide gauge was installed on Molo (Pier) Sartorio in October 1859 (Schaub, 1869). Since then, except in the 1890s, observations have been performed regularly to date on the same site by the different organizations that managed the tide gauge station (Lorenz et al., 1875; I.R. Governo Marittimo, 1877–1890; Sterneck, 1905; Raicich, 2007). Earlier data were recently found in a manuscript held in the Ancient Archive of the Astronomical Observatory in Padua, Italy, among the correspondence received by the astronomer Giuseppe Toaldo. The data consist of sea level observations made at Trieste from 1782 to 1794 by the physician Leonardo Vordoni (Vordoni, 1795a).

Figure 1The geographic area of interest; the locations cited in the text are shown.
The main aim of this paper is to make Vordoni's observations known to the scientific community and to assess their quality. Because of several problems that will be addressed, the value of those data is mainly historical, although some information of scientific interest can be extracted.
In the next section a short biography of Leonardo Vordoni will be presented. The manuscript will be described in Sect. 3. Section 4 will describe data consistency checks based on tidal analysis and the recognition of the inverted-barometer (IB) effect. In Sect. 5 the method used to derive mean sea levels over different timescales will be outlined. Some comments about storm surges will be provided in Sect. 6. Finally, concluding remarks will be presented in Sect. 7.
The most complete biography of Leonardo Vordoni can be found in Stancovich (1829); additional information is reported by Mainati (1818) and Lorenzutti (1859). Relevant locations in Vordoni's life are shown in Fig. 1.
Leonardo Vordoni was born on the Greek island of Corfu, which in those times was ruled by the Republic of Venice (Repubblica Serenissima). He served as an officer in the Venetian navy and became a surgeon in the Corfu hospital. He then studied at the university in Padua, obtaining the qualification of surgeon (1768) and the degree of doctor in philosophy and medicine (1772). Meanwhile he had moved to central Dalmatia, first to the town of Skradin (Scardona) then to nearby Šibenik (Sebenico), now in Croatia. In 1778 Vordoni went to Trieste, which was in Austria, to serve as the physician of the local Greek–Illyrian community. In 1781 he passed examinations in Vienna to have his degrees recognized in Austria, as they had been obtained abroad, in the Republic of Venice.
As many physicians of his times, Vordoni was interested in studying relationships between the course of diseases and environmental conditions. In particular, he turned his attention to tides or, in his own words, flux and reflux. He noticed that the evolution of some fevers and tides were similar. In particular, fevers used to increase and decrease twice a day, like semidiurnal tides, in such a way that a higher fever corresponded to high tide. He also claimed to have found a monthly cycle consisting of 15 d with a fever and 15 d without, with a higher fever occurring near spring tides. He concluded that the same forces were responsible for both the course of fever and the oceanic motion connected to tides (Vordoni, 1795a). Nothing else was reported; therefore we do not know if Vordoni studied this subject in depth.
In a letter to Toaldo, Vordoni stressed the importance of performing and exploiting regular observations on the environment, mentioning that he had started his own measurements 40 years before, probably when he was living in Skradin (Vordoni, 1809). Vordoni was also the first to perform instrumental meteorological observations in Trieste on a regular basis, in particular the monthly precipitations for 1787–1807 (Rossetti, 1829). Those data were sent every year to Giuseppe Toaldo and Vincenzo Chiminello, astronomers in Padua, who published them in their Giornale astro-meteorologico (Vordoni, 1788; GAM, 1789–1802, 1803–1808).
The manuscript with the sea level observations made at Trieste (Vordoni, 1795a) was delivered to Toaldo by Giovanni Vordoni, Leonardo's son, in 1795 (Vordoni, 1795b). Giovanni studied in Padua, obtaining a degree in medicine in 1791 (Lorenzutti, 1859), and this probably enabled him to meet Toaldo and establish contact with his father.
Leonardo Vordoni died at the age of 84 in 1813 (Comune di Trieste, 1813).
The manuscript consists of two booklets, a larger one, composed of 76 pages, where the observations are reported in tables, and a smaller one, of 16 pages, with comments about the relationship between the course of diseases and the sea level fluctuations (Vordoni, 1795a). The time series starts on 1 January 1782 and ends on 12 October 1794, with only one major gap from 1 May to 31 August 1783 and some sparse missing data. An isolated observation made on 19 June 1795 is also reported in the comments booklet, suggesting that Vordoni might have kept on measuring sea heights after 12 October 1794. Some inconsistencies are present, particularly about the calendar. The quite uniform handwriting suggests that it was a copy written on purpose to be given to Toaldo (see Sect. 2); therefore copying mistakes might have been introduced. Appendix A summarizes the main problems encountered.
The data manuscript begins with a foreword page titled Monitus, written in Latin. It includes the following information about the measurement methodology and some typical characteristics of sea level variability.
The measurements are made taking advantage of a pole, located at 50 paces (passus) from the shore. Sea heights are expressed in Paris feet and inches (1 ft = 12 in. = 32.4845 cm; Martini, 1883). A green trace exists on the pole, corresponding to the ordinary sea height (altitudo ordinaria maris). From 14 years of observations, the sea level normally descends to 5 ft (162 cm) below the ordinary height. The mean sea height (altitudo media maris) is defined as 2.5 ft (81 cm) below the ordinary height, which is the middle between the ordinary sea height and the height of normal descent. In the tables zero corresponds to the mean sea height. The highest observed sea level is 6 ft (195 cm) above the ordinary height, and the lowest is 7 ft (227 cm) below; these values correspond to +8.5 (276 cm) and −4.5 ft (−146 cm) relative to the mean height, respectively. The sea floor lies 11 ft (357 cm) below the ordinary height (Fig. 2).

Figure 2Scheme of the main levels reported by Vordoni measured relative to the ordinary sea height (left scale) and to the mean sea height (right scale). Monitus is the first page of the manuscript (see text for details; 1 ft = 12 in. = 32.4845 cm; Martini, 1883).
The passus used by Vordoni might be the Dalmatian passo (that unit was not used in the Austrian territories), corresponding to 173.867 cm (Wagner and Strackerjan, 1855); therefore, the distance from the shore should have been about 87 m. It is not possible now to locate the pole, which might have been part of a wooden pier. The green trace is a belt formed by algae, known in Venice as the comune marino, corresponding to the mean high water (Rusconi, 1983). The reference to 14 years of observations might indicate that Vordoni did not report all his measurements in the manuscript. Vordoni did not provide details on how the measurements were carried out in practice; this point will be discussed in Sect. 5.
Each page of the manuscript (Fig. 3) is divided into three vertical sections, each consisting of a table of nine columns. Column 1 shows the month and year, the latter only at the beginning of the page, and column 2 shows the day. The hour of observation is reported in Roman numerals in column 3 if until noon or in column 4 if after noon. Columns 5–9 contain sea heights relative to the mean sea height: zero is written in column 7; heights below zero are written in columns 5–6; and heights above zero are in columns 8–9. Columns 6 and 8 contain values less than 3 ft (97 cm), and columns 5 and 9 contain values larger or equal to 3 ft (97 cm). The measurements were made in multiples of 3 in. (8.1 cm) and therefore have a precision of about ±4 cm. Furthermore, there is no indication if and how the observer took into account the wind waves.
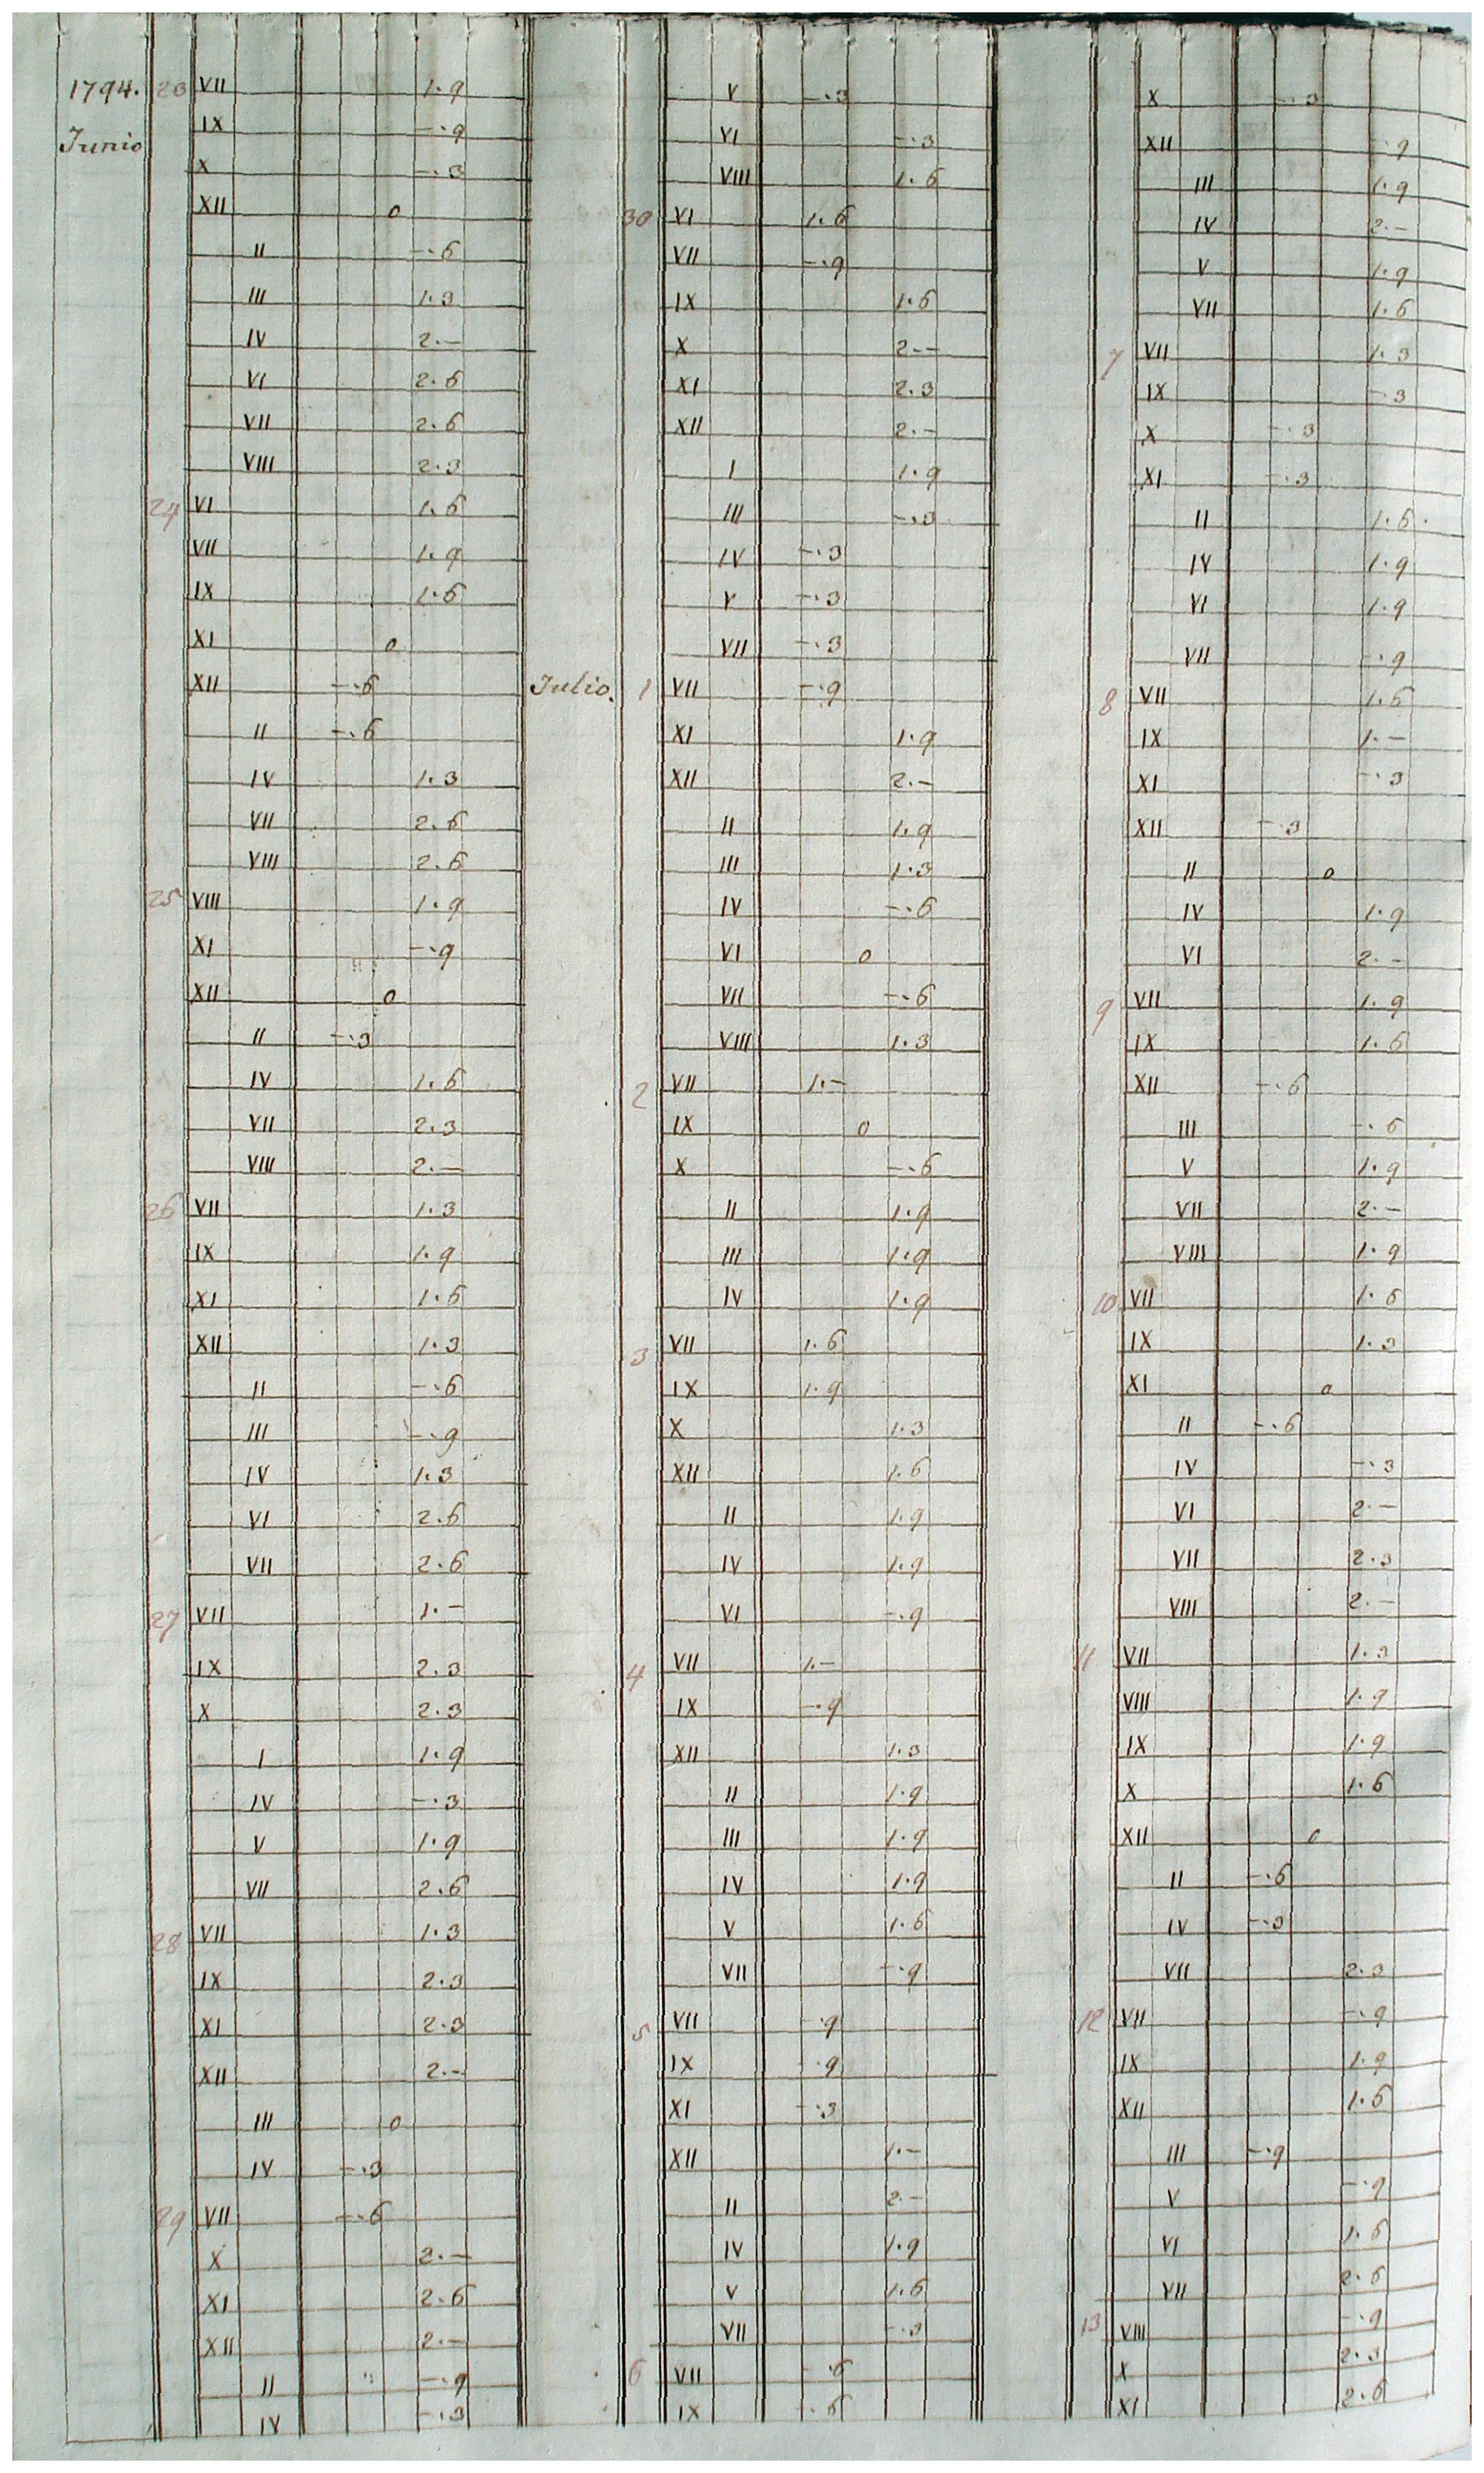
Figure 3Manuscript page from 20 June to 13 July 1794 (courtesy of the Ancient Archive of the National Institute for Astrophysics Astronomical Observatory, Padua, Italy; INAF).
Considering the measurements with a round number of feet as a reference, those with 6 in. (16.2 cm) are about 10 % more frequent; those with 3 in. (8.1 cm) are 28 % less frequent; and those with 9 in. (24.4 cm) are 43 % less frequent. This fact might indicate the tendency to round to the nearest foot or half-foot, particularly in case of significant wave motion. A similar asymmetry was also found by Woodworth (1999) in Liverpool sea level data, the difference being that measurements with 6 in. were less frequent than those with a round number of feet. (Note, however, that Liverpool observations were made in multiples of 1 in. (2.7 cm).)
Time was computed according to the central European style, in which the day started at midnight (by contrast, in the Italian states the day usually started half an hour after sunset). Local apparent time was very likely adopted. Based on the equation of time (Meeus, 1998) its difference relative to local mean time (namely GMT+55 min, corresponding to the Trieste longitude of 13.75∘ E) was between −15 min (on 3 November) and +16 min (on 11 February). Unfortunately, it was not possible to verify these details because the times reported by Vordoni are always round hours, and differences of 15 min or less were not detectable.
Until 30 June 1791 the observations were only made at 07:00 and 16:00. Following 1 July 1791 the number of daily data increased, often extending from earlier than 07:00 to later than 16:00, particularly in the summer months. A maximum of 16 observations were made on 12 August 1791. With few exceptions, measurements were never made during the night. Figure 4 shows the number of observations available on a daily basis. Only in July 1791–July 1792 and July 1793–August 1794 were more than five observations per day generally performed. The relatively high frequency of the observations in the later years might indicate that the pole was easily accessible, thus supporting the hypothesis, mentioned above, that it belonged to a pier rather than being an isolated mooring in the roadstead.
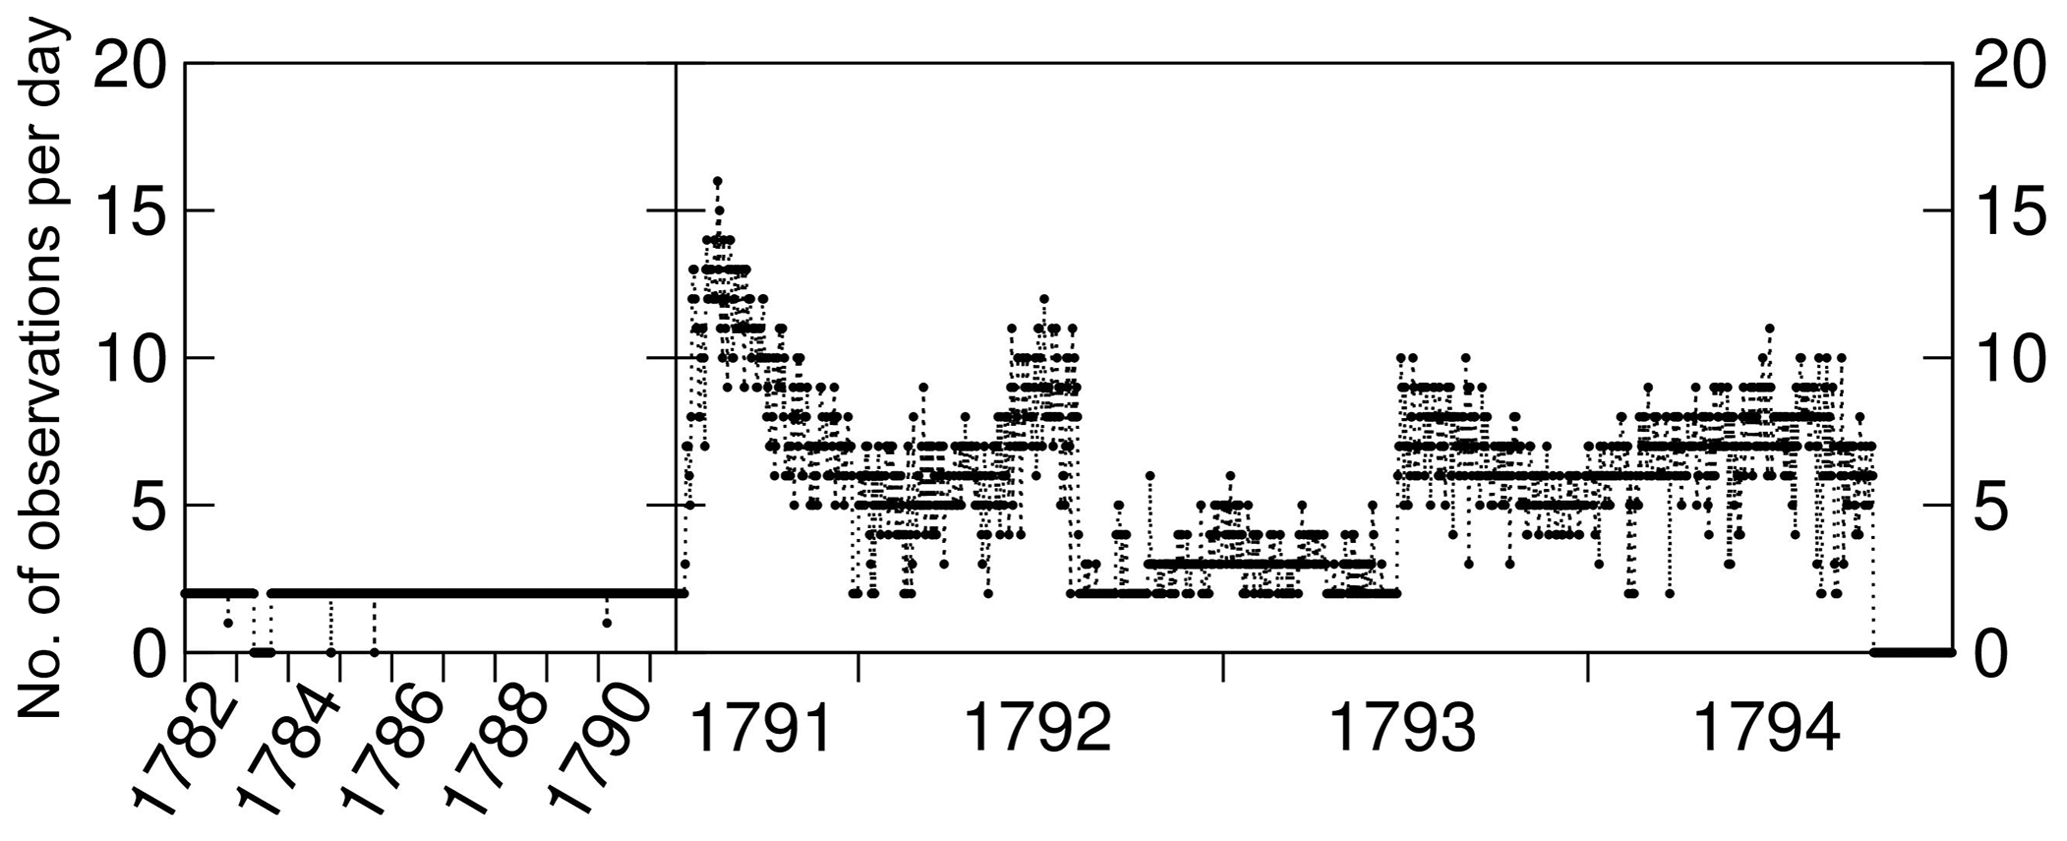
Figure 4Number of observations per day. The horizontal scale is expanded for display purposes from July 1791 onwards.
The highest sea level reported in the tables is +10.5 ft (+341 cm) on 31 October 1793, but it seems unrealistically high. The second highest value is +6.5 ft (+211 cm), recorded on 23 February 1785, 26 December 1787, 27 October 1791, 25 November and 23 December 1792, and 5 November 1793. The lowest height is −3.5 ft (−114 cm), observed on 22 May 1787 and 25 November 1791. Compared with the extremes reported in the Monitus page, the highest value is 2 ft (65 cm) lower, and the lowest value is 1 ft (32.5 cm) higher. Perhaps the actual extremes were not included in the tables.
Unfortunately, there is no information about vertical references that could allow us to connect Vordoni's data to known benchmarks on land and, therefore, to sea levels obtained from modern observations.
The data reported in the manuscript are available from SEANOE (SEA scieNtific Open data Edition) as “Leonardo Vordoni's sea level record at Trieste (1782–1794)” (https://doi.org/10.17882/62598; Raicich, 2019a).
Sea heights were first converted to centimetres. A visual check was performed to detect possibly wrong data. In general, the irregular and low frequency sampling and the low time and height precision did not allow for reconstructing the sea level variability accurately enough to understand if suspect behaviours were caused by erroneous data or real sea level fluctuations, for instance related to seiches or rapid atmospheric-pressure changes. Several suspect values were found, but there was not enough objective information to reject them. Only one observation was deemed probably erroneous and discarded, namely the very high sea level observed on 31 October 1793 at 14:00 (10.5 ft; 341 cm); in fact, it would have represented a very severe flood of the city, but such an event was never reported by any chronicles.
In order to verify the time series consistency, we investigated the sea height variability connected with the astronomical tide and the inverted-barometer effect. As described in Sect. 3, the different sampling frequency divides the time series into two parts. The observations prior to July 1791 could not be used because of the insufficient time sampling. In July 1791–July 1792 and July 1793–August 1794 the observations are more frequent, and they often span more than 12 h during the same day; therefore those periods were selected for the analyses.
4.1 Tidal analysis
Godin and Trotti (1975) summarized the harmonic constants for Trieste, which had been estimated previously by several authors since the beginning of the 19th century. In most studies seven constituents were generally used for tidal predictions, namely the larger lunar elliptic semidiurnal (N2), the principal lunar semidiurnal (M2), the principal solar semidiurnal (S2), the lunisolar semidiurnal (K2), the lunar diurnal (O1), the solar diurnal (P1) and the lunisolar diurnal (K1). In the present work, to check whether the July 1791–July 1792 and July 1793–August 1794 periods of data were also consistent with these seven constituents, they were analysed alongside modern hourly data from 2017 (Raicich, 2019b).
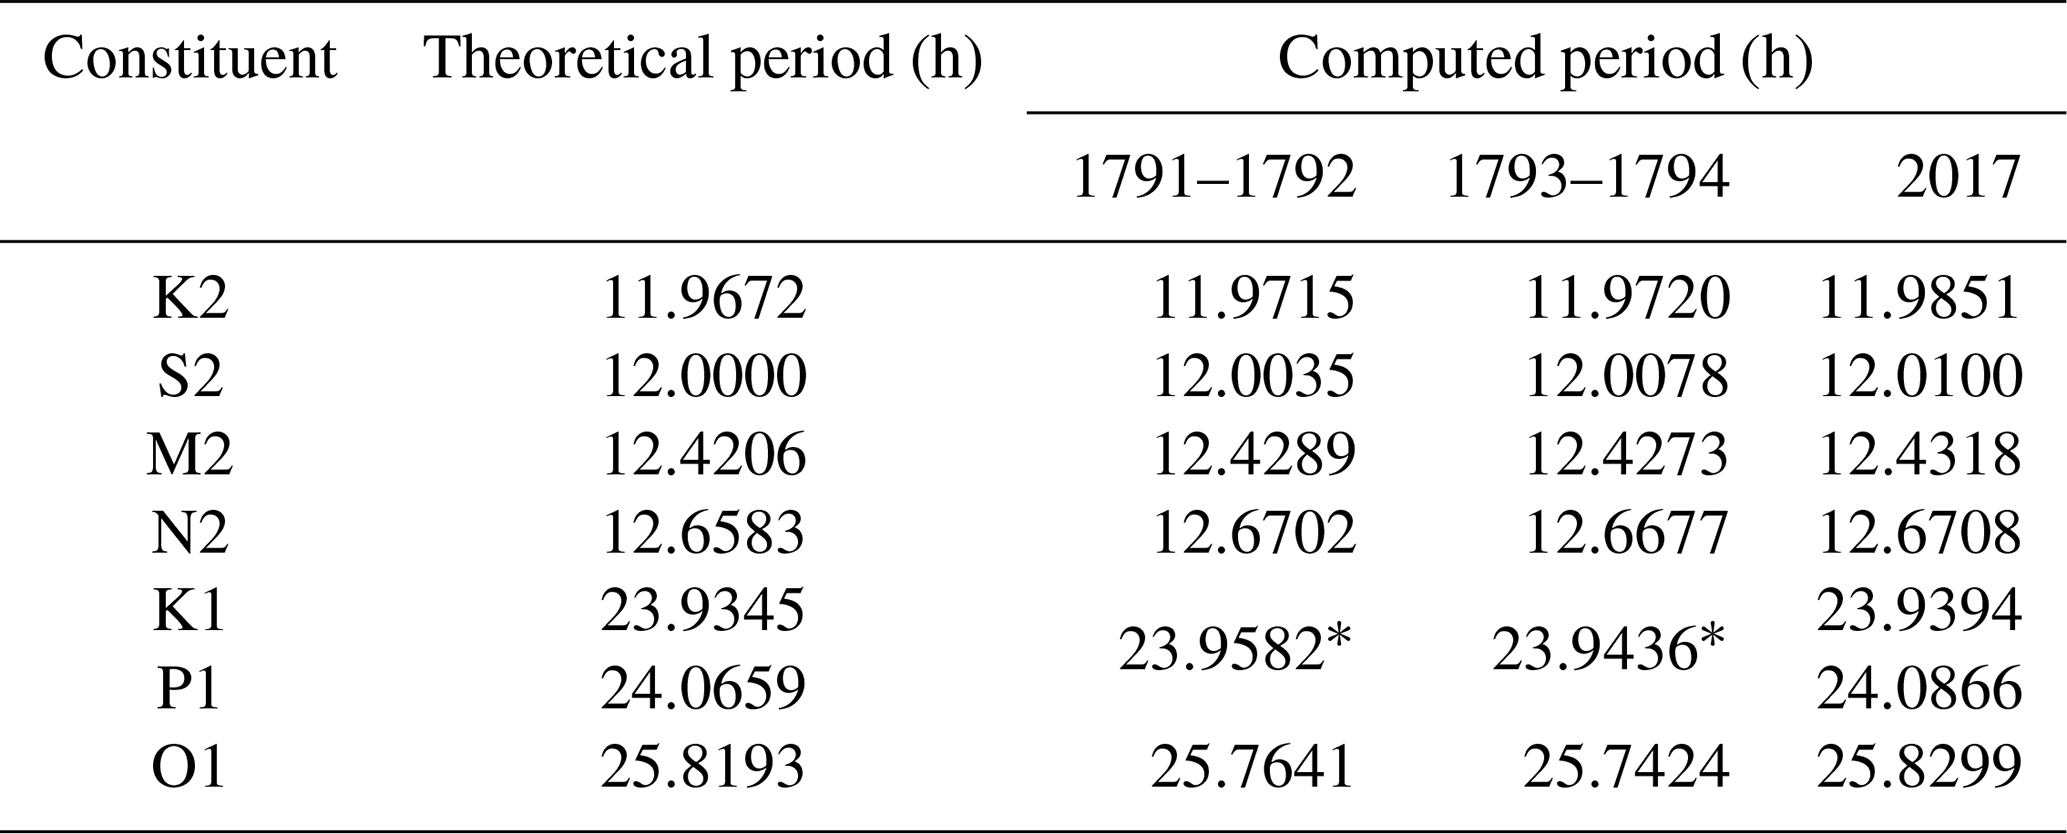
To recognize the main constituents of the astronomical tide, the Lomb–Scargle periodogram analysis was used, as it is suitable for unevenly spaced time series (Lomb, 1976; Scargle, 1982). The results are summarized in Table 1 and Fig. 5. Five of the seven above-mentioned constituents were correctly detected, while P1 and K1 could not be discriminated from each other and appear as a single peak in the spectrograms of both 1791–1792 and 1793–1794. The analysis of the 2017 data correctly detected all the seven constituents. In the analysis of the 18th-century data, spurious constituents appear, for instance around 8 h periods. The reason is the irregular data sampling and the incomplete description of the daily cycle. Such spurious peaks were also found by analysing the time series of 2017 with artificial gaps introduced using the same gaps of the 18th-century time series.

Figure 5Normalized spectrograms obtained from the periodogram analysis of the 1791–1792 (a), 1793–1794 (b) and 2017 (c) data. The period interval (T for time) between 7 and 27 h is shown. The seven main tidal constituents are identified on top, and their theoretical periods (Table 1) are indicated by the vertical red dashed lines.
Table 1Summary of the seven main tidal constituents for Trieste, their theoretical periods and the periods computed with the periodogram analysis of the 1791–1792, 1793–1794 and 2017 data. The asterisk indicates that the constituents were not discriminated by the analysis.
Having established that the sea level fluctuations connected to tides are described by Vordoni's data, the observations were compared with tidal predictions computed by means of the TASK-2000 software (Bell et al., 1999), using the tidal constants estimated from the analysis of the 2017 data (Raicich, 2019b). As a result, the phases of the 18th-century data and the tidal predictions agree reasonably well, while the observed amplitudes appear larger than expected (see the example in Fig. 6).

Figure 6Comparison of original and rescaled sea heights of 31 July–17 August 1791 with tidal prediction. The observed data (original and rescaled) are offset for display purposes by adjusting their respective mean to that of the tidal prediction in the same period.
To quantify the discrepancy, full (i.e. without gaps) predicted hourly time series of 1791–1792 and 1793–1794 were reconstructed by a linear combination of the main seven tidal constituents mentioned above, with amplitudes and phases estimated by fitting to the observations. To account for the uncertainties, the standard deviations (SDs) of the reconstructed time series were then computed, obtaining 37.7 cm for 1791–1792 and 34.6 cm for 1793–1794. For comparison, the same procedure was applied to hourly data from each year from 1939 to 2018 (Raicich, 2019b), obtaining a mean SD of 26.5±0.3 cm. On average, the SD in the 18th century is 37 % larger than in modern times (about 10 cm).
The large differences are confirmed by the information in the Monitus page of the manuscript. According to Vordoni the usual tidal range is 5 ft (about 162 cm). It is difficult to understand what “usual” means and which tidal range Vordoni refers to. However, from 1939–2018 data (Raicich, 2019b), it is known that the mean difference between the mean daily highest and lowest hourly values is 88 cm. Consequently, Vordoni's value appears to be 84 % larger.
There is not enough historical information to explain the discrepancy. A possible reason is that the Paris foot was 37 % larger than the height unit that was actually used, which, therefore, would have been about 24 cm rather than about 32.5 cm. Among the many units of length used in Europe before the introduction of the metric system, in southern France the palme or pan was common, corresponding to 24.5–25.5 cm depending on the city (Doursther, 1840). However, this is just a speculation, as we have no information to support it.
Another possibility is that the measurements were taken along an inclined pole, not a vertical one, thus overestimating the sea level changes. The inclination corresponding to a 37 % overestimate is about 43∘, and such a big deviation from the vertical could not have been disregarded. Regarding possible effects of bathymetry on the amplitude of sea level fluctuations, the depth at the observation site was about 2.8 m (8.5 ft) below the mean sea height (see Sect. 3), not much different from the depth at the modern tide gauge site of about 2 m depth relative to the mean sea level.
In conclusion, Vordoni appears to have observed the sea level methodically, but the heights appear to be affected by a scale error. Except for the sea height scale, the data appear to reasonably describe the sea level variations connected to tides.
Under the assumption that the whole time series was affected by the same scale anomaly, for the subsequent analyses the data were rescaled by dividing the original heights by 1.37. As this factor is empirical, the results should not be taken too rigorously. The scope of rescaling is not to estimate correct values, but it is rather to obtain more realistic sea heights for the discussion. The effect of rescaling can be seen in the example illustrated in Fig. 6.
4.2 The inverted-barometer effect
A further consistency check involves the inverted-barometer effect, which is the response of sea level to atmospheric-pressure variations. We used linear regression coefficients to quantify the inverse relationship between sea level and pressure anomalies, which corresponds to approximately −1 cm hPa−1 in equilibrium conditions (e.g. Pugh, 1987). In practice, the IB coefficient obtained by linear regression of observations seldom corresponds to the equilibrium value because of the dynamic sea level response in shallow waters to travelling pressure disturbances and due to the effect of the local and remote wind fields. Therefore, we used the regression coefficients simply in a comparative way, assuming that bad data would lead to uncorrelated anomalies and/or unreasonable IB coefficient.
Regressions involved daily values. As in the tidal analysis, for the 18th-century sea heights we chose the July 1791–July 1792 and July 1793–August 1794 periods. The insufficient representation of the daily cycle introduced a bias that was estimated empirically using average corrections, using the hourly data from 1939 to 2018 (Raicich, 2019b). The calculation of corrections is described in Appendix B, and the corrected heights are given in Eq. (B6). The procedure is similar to that used in Raicich (2015). The atmospheric-pressure data were obtained from the Padua time series of Camuffo and Jones (2002). Padua is the closest site to Trieste with daily pressure data for this period. Although Padua is 150 km away from Trieste, it is suitable for our calculations because of the typically large spatial scale of atmospheric-pressure patterns and because we are interested in atmospheric-pressure anomalies rather than in absolute measurements. For comparison, modern sea level data for 2017 were used from Raicich (2019b), and daily means of atmospheric pressure come from Agenzia Regionale per la Protezione dell'Ambiente del Friuli Venezia Giulia (ARPA-FVG) (2019).
A daily sea level anomaly is the difference between the observed daily mean and a suitable mean sea level, which accounts for the variability on seasonal and longer timescales. This is represented by a low-frequency sea level component encompassing the timescale longer than or equal to 6 months, which was estimated by means of an objective analysis technique (Gandin, 1965; Bretherton, 1976). The same procedure was applied to atmospheric-pressure data to obtain mean daily pressure anomalies.
Time series of sea height and pressure anomalies for October 1791–April 1792 (a) and October 1793–April 1794 (b) are shown in Fig. 7. The inverse relationship between sea level and pressure is generally visible. The IB coefficient was estimated from the merged time series of July 1791–July 1792 and July 1793–August 1794, obtaining −1.1 cm hPa−1 with a correlation coefficient of between sea level and pressure anomalies; −1.1 cm hPa−1 is also obtained using the 2017 data, with . The IB coefficient relative to Chioggia data of the 18th century was found to be −0.9 with (Raicich, 2015). All coefficients are significant at p<0.01.
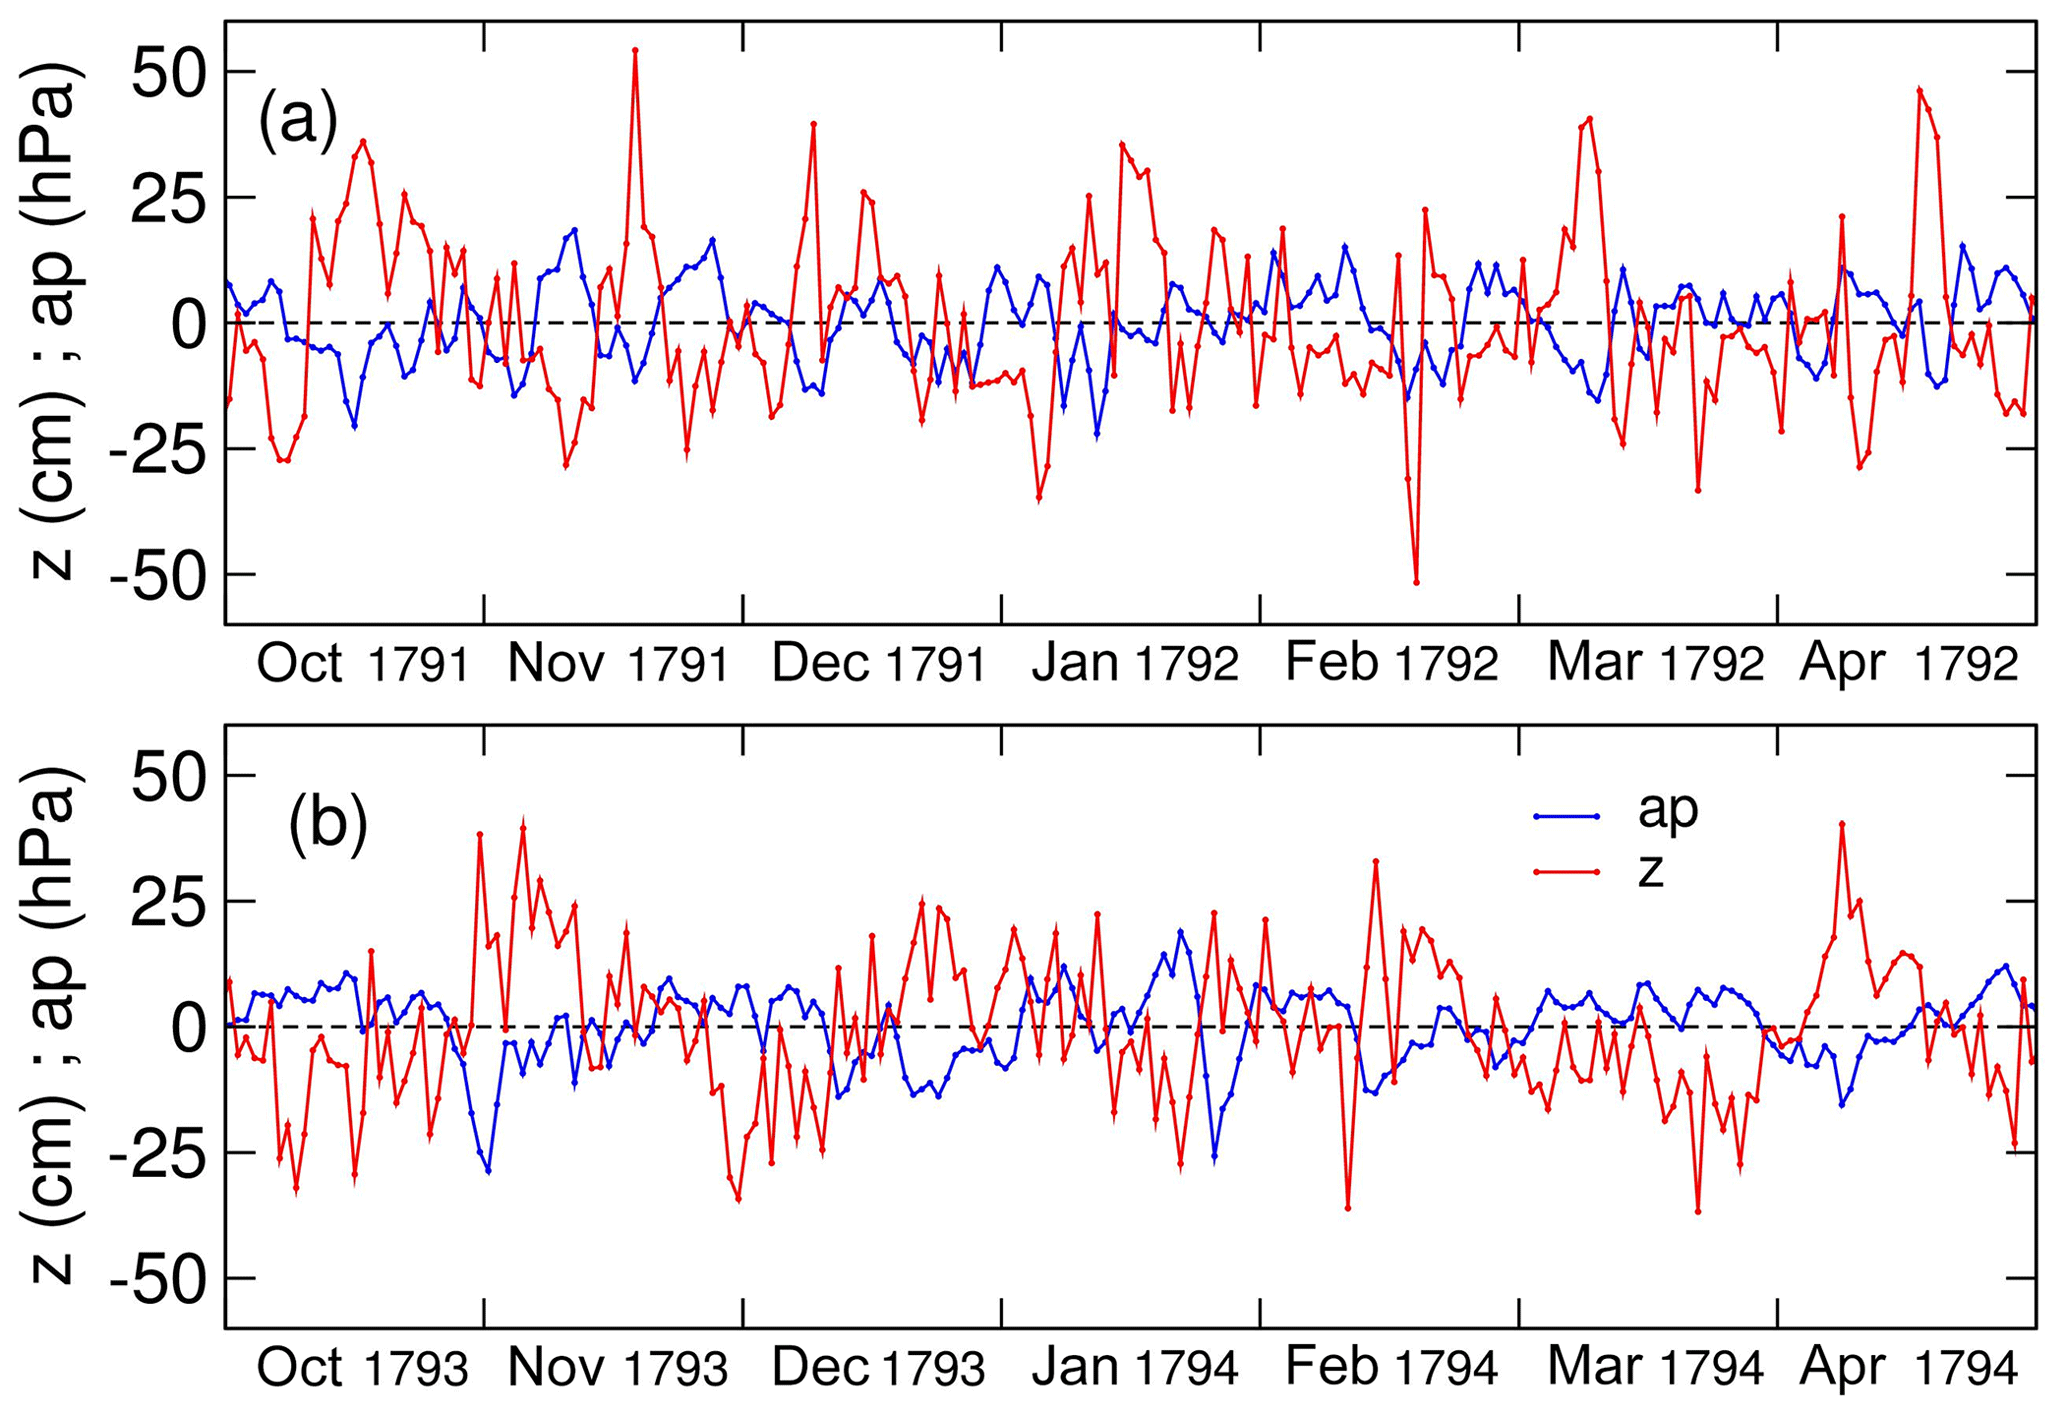
Figure 7Anomalies of Trieste sea height (z, red) and Padua atmospheric pressure (ap, blue) in (a) October 1791–April 1792 and (b) October 1793–April 1794.
These results show that the rescaled and bias-corrected sea heights from July 1791 onwards account for the IB effect rather well, and it is a further indication of the reasonably good quality of the observations.
Monthly and annual mean sea levels were computed to obtain information about the long-term, in our case decadal, trend.
Monthly means were computed from the daily means obtained from Eq. (B6). At least 26 d per month were available except in May–August 1783 and October 1794, which were excluded from the calculation. Except for 1783 and 1794, the annual means were computed from 12 monthly means. The monthly and annual means, before and after corrections were applied as described in Appendix B, are displayed in Fig. 8a. The errors on the corrected monthly values (not shown) vary from 2.0 to 2.5 cm until June 1791 and from 0.8 to 2.1 cm afterwards; the errors on the annual values (not shown) are 0.6 cm until June 1791 and between 0.4 and 0.5 cm since July 1791.
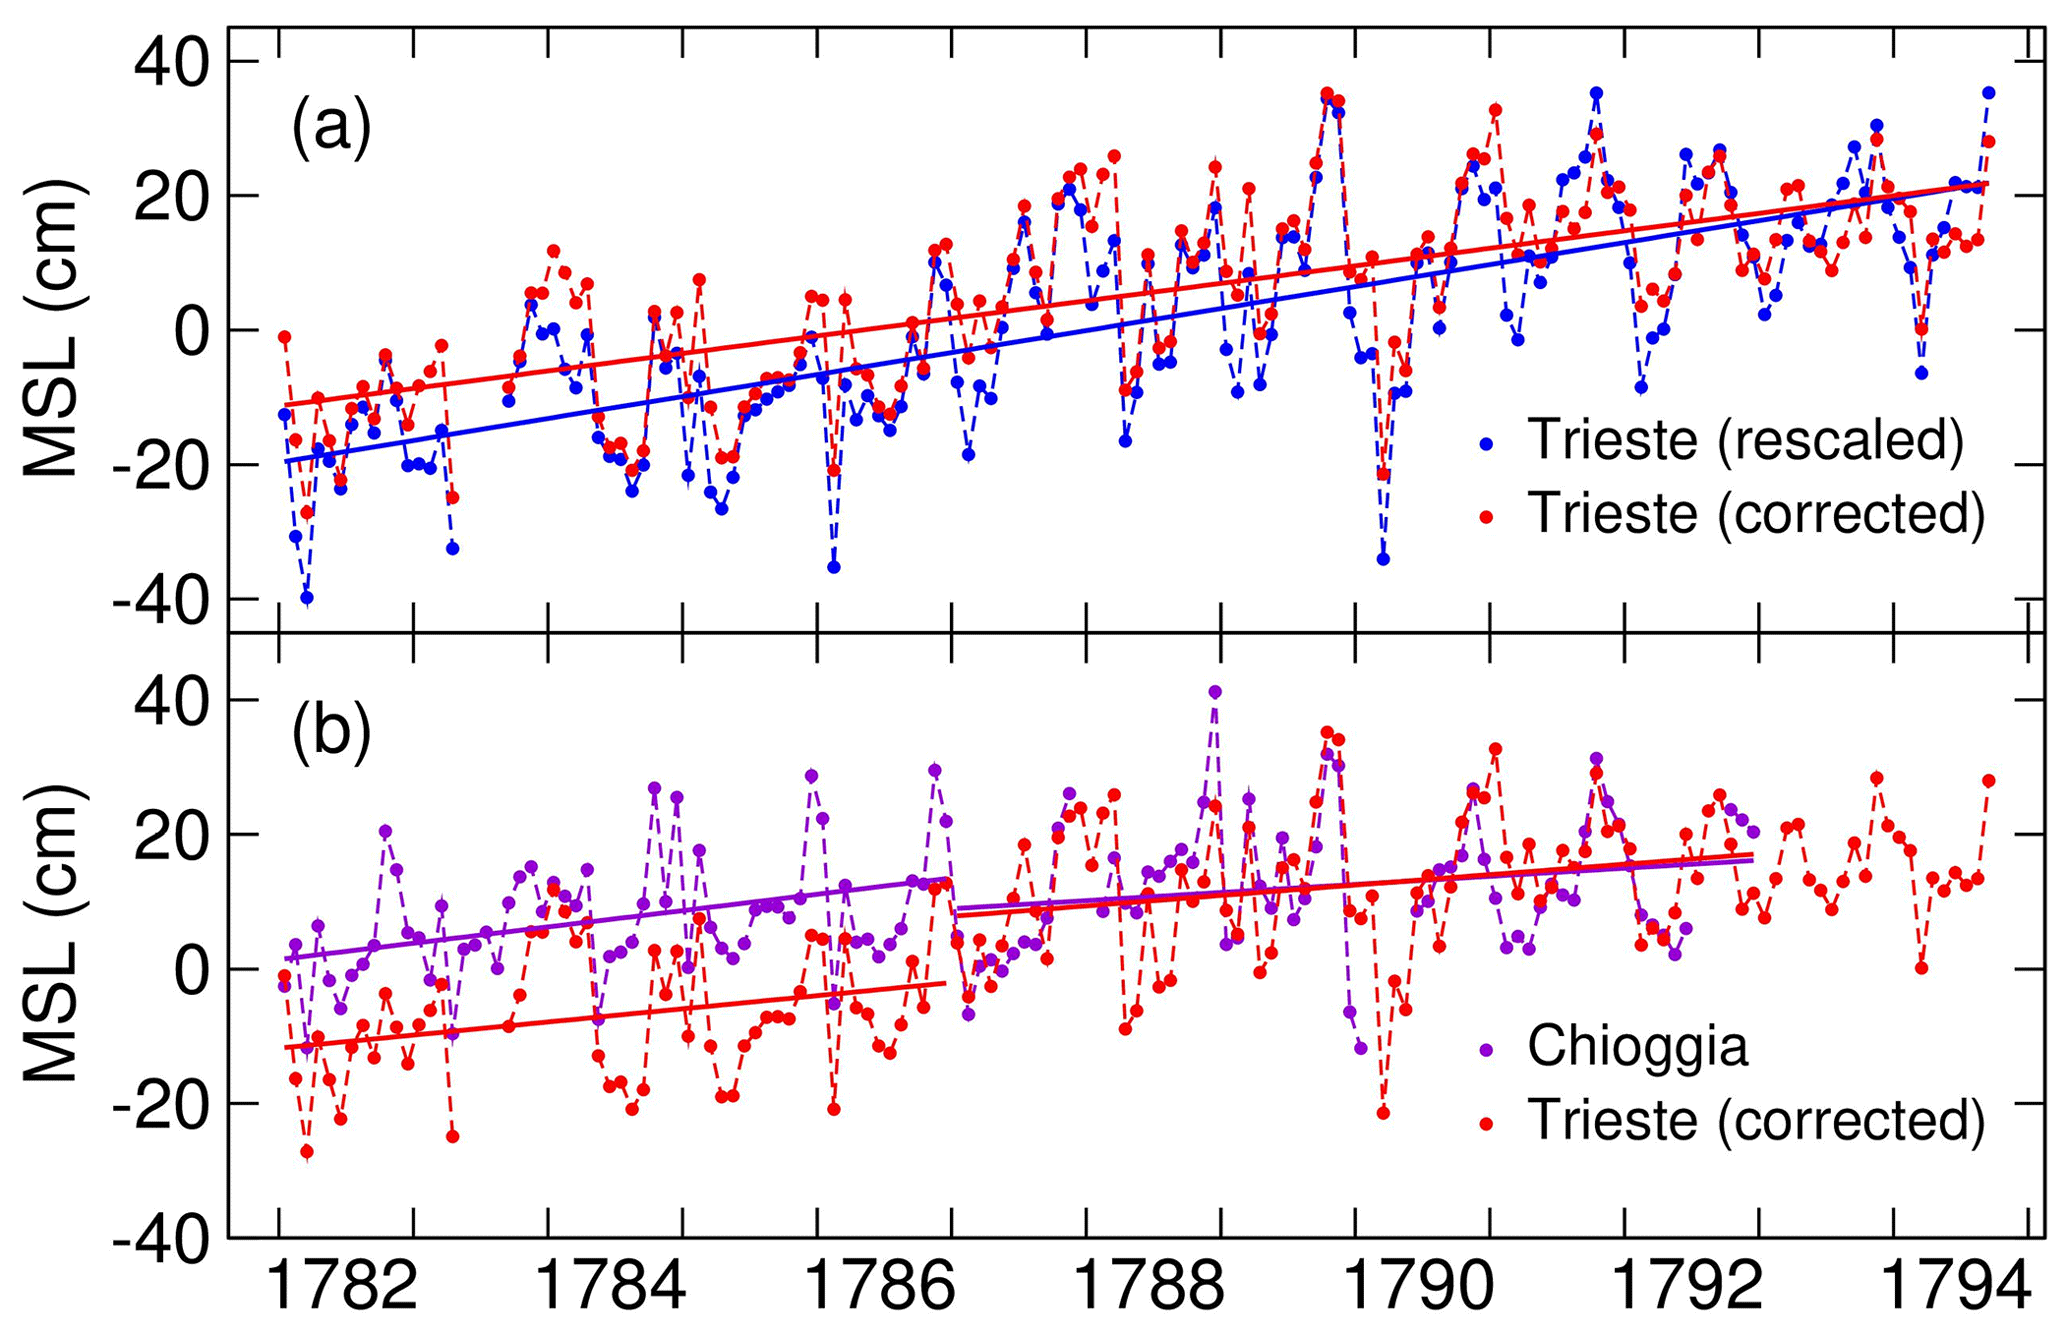
Figure 8(a) Monthly mean sea levels of Trieste: rescaled heights (blue) and corrected heights (red). (b) Comparison of the monthly mean sea level (MSL) of Trieste (red) and Chioggia (purple). The Chioggia time series was offset so that the 1787–1792 mean sea levels of both stations coincide.
We saw that Vordoni measured the sea heights relative to the mean sea height, lying 2.5 ft (81 cm) below the ordinary sea height, i.e. the green algae belt (Sect. 3 and Fig. 2). The algae belt position varies on seasonal timescales because algae adapt to the mean high water changes in turn related to the mean sea level variations that are mainly caused by the atmospheric-forcing regimes and the steric effect (Raicich, 2015). If the measurements had been made relative to the current position of the algae belt, the seasonal cycle and most of the interannual variability would have been filtered out, leaving only the sub-seasonal variability. This did not occur because the record exhibits a seasonal cycle in the range of about 15 cm, computed as the difference between the autumn maximum and the winter minimum and a total mean sea level change of about 30 cm from 1782 to 1794 (Fig. 8a). Therefore, we can reasonably assume that a unique mark, defined on the pole, was used as the reference for all the observations.
The trend of the bias-corrected time series is 2.6±0.2 cm yr−1 when it is estimated from monthly means and 2.8±0.4 cm yr−1 from annual means. The trend uncertainty is the SD obtained from the linear fit. Although the time series is short, those trends appear suspect. For comparison, in modern data the largest trends over periods of similar length are 0.8±0.1 cm yr−1 in 1989–2002 and 0.9±0.3 cm yr−1 in 2003–2014, which is one third of the 1782–1794 trend.
A comparison was made with the 1782–1792 data measured by Vianelli in Chioggia; for display purposes the Chioggia time series was offset so that the 1787–1792 averages coincide (Fig. 8b). Most of the seasonal and interannual variations look similar, but before 1787 the mean sea height in Trieste is over 10 cm lower than in Chioggia. In the period 1782–1786 the trends are 2.0±0.9 cm yr−1 at Trieste and 2.4±0.7 cm yr−1 at Chioggia, while in 1787–1792 they are 1.5±0.7 and 1.2±0.7 cm yr−1, respectively.
In each period the linear trends of the two time series are consistent, within the errors, but this is not necessarily an indication of good quality of Trieste data. In fact, the relative sea level trend at Chioggia is expected to be larger than at Trieste because Chioggia lies in a region prone to significant subsidence. Antonioli et al. (2009) reported average rates of vertical tectonic movements in the Holocene between −0.1 and +0.3 mm yr−1 at Trieste and about −0.6 mm yr−1 in the southwestern Venice Lagoon near Chioggia.
A possible explanation for the relatively large trend of the Trieste sea level is that the pole used for the measurements was sinking into the sea floor of the Trieste harbour which is largely mud and sand.
Despite the low and irregular frequency of Vordoni's observations, some major extreme events were recorded. The sea level variability on synoptic timescales is coherent over the northern Adriatic basin (Raicich, 2010). Therefore, large surges are often observed along the whole northern Adriatic coast. Depending on the wind strength and direction, during a storm the surge peak can occur at different times at Trieste and Chioggia, which are on opposite sides of the basin. Moreover, the maximum observed sea level is determined by the time lag between the peaks of the surge and the astronomical tide. After the storm surge seiches develop, the most important of which is a longitudinal oscillation of the basin with a period of 21–22 h, not far from those of the O1, P1 and K1 tidal constituents (Raicich et al., 1999). Seiche peaks may also contribute to very high sea levels when they are in phase with the astronomical tide.
As Chioggia data consist of high and low waters (Raicich, 2015), the sea level peaks were generally recorded, while at Trieste they might have been missed, particularly if they occurred at night.
According to contemporary chronicles, three remarkable storm surges were observed during the period covered by the observations, namely on 12 March 1783, 24–25 November 1792 and 23–24 December 1792. In what follows the reported sea level values are relative to the mean sea heights; the Chioggia data were discussed in Raicich (2015).
On 12 March 1783 the highest observed sea level was 115 cm at Trieste while in Chioggia, the highest high water was 128 cm. Various authors reported that this event was significant in the Venice Lagoon (Enzi and Camuffo, 1995). The event was also witnessed by an anonymous author (Anonymous, 1795) who observed a “terrifying tide that caused barrels to float in wine cellars” in Piran, now in Slovenia, about 20 km southwest of Trieste (Fig. 1).
During the event of 25 November 1792 the sea height reached 150 cm at Trieste, whereas in Chioggia a 119 cm peak was observed on the day before. Chronicles about this event in Venice and Chioggia are available (Enzi and Camuffo, 1995), while no reports exist about Trieste.
On 24 December 1792 the highest high water at Chioggia reached 168 cm. At Trieste the highest sea height occurred on 23 December with 150 cm. In this case chronicles from Venice are the only ones available (Enzi and Camuffo, 1995).
Unfortunately, the lack of useful vertical references, including landmarks, does not allow for connecting Vordoni's data to modern observations and assessing the impact of those, and other non-documented, events on the urban area.
The Greek-born physician Leonardo Vordoni left a 12-year-long time series of sea level observations at Trieste from 1 January 1782 to 12 October 1794, which, together with those observed in the Venice Lagoon in the same period, suggests a widespread interest in sea level variability in the northern Adriatic region in those times.
During the present analysis several problems arose because of unclear information on the observation methods and metadata. This limits the scientific value of Vordoni's data, which, therefore, have mainly historical relevance. Comparisons with modern records and some basic analyses revealed several faults and defects, including possible copying mistakes. Nevertheless, having in mind that Vordoni's main objective was to study the relationship between sea level changes and the course of diseases, the observations might have been of some use to him.
A positive characteristic of the data set is that, in spite of the low data accuracy, it is possible to detect the known seven main tidal constituents (namely N2, M2, S2, K2, O1, P1 and K1) that have been traditionally used for tidal predictions in Trieste. The analysis can only be done for data since July 1791, when more than 12 h often pass from the first to the last observation during the same day, but the results show that Vordoni used to observe the sea level quite methodically.
There are two major negative aspects from this study. One is related to possible vertical movements of the pole, used to measure the sea heights, which was probably sinking into the soft sea floor causing a large (compared to modern data) positive trend. This may not be a surprise if the pole had been installed recently and had not yet stabilized. The other drawback is that the data seem expressed in a unit smaller than the Paris foot, which Vordoni explicitly stated was adopted. In fact, if his statement is correct, the range of the sea level oscillations connected with the astronomical tide is about 37 % larger than expected from modern data, which seems unrealistic. Having recognized a certain consistency of the data, the sea heights were reduced by the factor 1.37, in order to discuss more realistic data. Clearly, we do not claim that such values are the right ones.
Moreover, there is not enough information to connect the vertical reference of Vordoni's data to modern observations.
Taking advantage of mean sea levels measured at Chioggia in the same period, it is possible to confirm that the rescaled sea heights are realistic and that the vertical movement of the datum is a reasonable hypothesis. There are two reasons: (a) an evident discontinuity in 1786–1787 (Fig. 8b) and (b) the trends of the two time series are similar before and after the discontinuity, which is in contrast with the known significantly larger vertical land motion rate in Chioggia than in Trieste (Antonioli et al., 2009).
Overall, the conclusions drawn from the analysis of the Vordoni data should be treated with some caution. Nevertheless, the data rescue and following analysis have thrown light on a previously unrecognized historical sea level data set which may nevertheless prove of interest to other researchers in the future.
Here we summarize and discuss various problems found in Vordoni's manuscript.
Let h be the sea height in Paris feet and inches; we recall that the value is written in column 5 if , in column 6 if , in column 7 if h=0, in column 8 if and in column 9 if h≥3.
Note that mistakes might have been introduced in the manuscript because, as mentioned in Sect. 3, it is probably a copy.
- a.
The calendar is affected by mistakes, mostly related to 29 February:
- –
29 February 1787 is erroneously included;
- –
29 February 1788 is missing;
- –
31 January 1790 is missing;
- –
29 February 1790 is erroneously included;
- –
29 February 1792 is missing;
- –
dates from 19 to 32 August 1793 were initially written; subsequently, 19 was simply deleted, while 20–32 were corrected to 19–31; as a consequence, an extra day without a number exists between 18 and 19 August 1793.
- –
In such cases it is possible that the writer first wrote dates in the empty tables, making mistakes and sometimes resetting the calendar; then he wrote the sea heights sequentially without paying much attention to the dates alongside. We assumed the sequence of sea level data to be correct and changed the dates accordingly. In detail, the original period 29 February 1787–28 February 1788 was corrected to 1 March 1787–29 February 1788; the original period 1–29 February 1790 was corrected to 31 January–28 February 1790; and the original period 1 March 1792–18 August 1793 was corrected to 29 February 1792–17 August 1793. The date of 18 August was attributed to the extra day.
- b.
There are missing data:
- –
1 November 1782, 07:00;
- –
1 May–31 August 1783;
- –
27–31 October 1784;
- –
31 August 1785: 31 was corrected to 1, which was aligned with Septembri (September);
- –
28 February 1790 (originally 29 February, see point a above), 16:00;
- –
5 December 1793, 08:00;
- –
28 September 1794, 16:00.
- –
- c.
Two sea heights are reported at the same time:
- –
22 October 1782, 16:00: the value 1.– is written both in columns 5 and 6; probably the value was erroneously written in column 6, reserved for zero, but not erased.
- –
8 November 1782, 16:00, 9 November 1782, 07:00, and 21 September 1786, 16:00: two different heights are reported, one in column 6 and one in column 8; we hypothesized that they represent minimum and maximum heights related to waves, and we adopted the averages.
- –
25–29 January 1784: two identical heights are reported in each line, both in columns 6 and 8; because in the days before and after that interval the height was normally positive at 07:00 and negative at 16:00, we assumed that the alternation should continue and that the author did not erase the data in the wrong column.
- –
27 May 1787, 16:00: 0 is reported in column 7, and 1 is in column 8; because a 1 ft height is usually written as 1.–, we assumed that it is an incomplete 1.3, subsequently not erased, which was actually written in column 8, the line below (28 May 1787, 07:00).
- –
- d.
The sea height is entered in a wrong column:
- –
15 April 1783, 07:00: a non-zero height is entered in column 7; it was set to positive.
- –
16–18 November 1784: non-zero heights are entered in column 7; a comparison with Chioggia data shows that the sea level was somewhat lower than in previous days; therefore the values were set to negative.
- –
20 October 1787, 16:00: a non-zero height is reported in column 7; it is the only exception within a long sequence of positive heights lasting several days, and it was set to negative.
- –
20 February–2 March 1789: several non-zero heights are written in column 7, and zero heights are in column 6; they were moved to the correct columns.
- –
14 September 1794, 11:00 and 12:00: heights less than 3 ft (97 cm) were written in column 9; it was considered a column mistake, and the entries were moved to column 8.
- –
- e.
There are inconsistencies probably caused by writing mistakes:
- –
5 December 1783, 07:00 and 16:00: 3.– and 9.– in columns 6 and 8, respectively.
- –
3 May 1791, 16:00: 9.– in column 8.
- –
16 June 1792 (originally 17 June, see point a above), 12:00: 3.– in column 6.
- –
Compared to values in nearby days, these values, particularly 9, appear too large. We assumed that the heights were written in the correct columns, but the correct entries were –.3 and –.9.
The value of 10.6 on 31 October 1793 is deemed unrealistically large.
A minor problem comes from the possible rounding of sea heights. Except when the height is 0, the usual format is F.I, where F represents feet and I is inches. Normally, I is a dash (representing 0), 3, 6 or 9. In 14 cases I is 2, 5, 7 or 8. These values might result from rounding up or down 1.5 (average of 0 and 3), 4.5 (3 and 6) and 7.5 (6 and 9), respectively. The original values were kept.
A basic assumption is that the climatology of historic sea level data is characterized by the same seasonal cycles as the modern data. The modern mean seasonal cycle can be computed from 80 years of observations (1939–2018), while the period covered by historic data is much shorter and, therefore, more sensitive to anomalous conditions. However, we could verify that both mean seasonal cycles exhibit a semi-annual oscillation characterized by the absolute minimum in March–April followed by a relative maximum in June, a relative minimum in July–August and the absolute maximum in October–November.
The 1782–1794 data can be represented by , where h=0 to 23 is the hour, d=1 to dmax (dmax varying from 28 to 31, depending on the month) is the day, m=1 to 12 is the month and y=1782 to 1794 is the year. As described in Sect. 3, only two observations per day are available until June 1791, while the number increases up to a maximum of 16 afterwards. Each day shows a peculiar pattern of present and missing data that can be represented by , where p=1 if the observation is present and p=0 if it is missing. Biased (zb) and unbiased (zu) daily means are computed, respectively, as
and
Clearly zu can only exist for the 1939–2018 data, while in 1782–1794 only zb exist. Provided that primes identify variables relative to the 1939–2018 period (80 years), biased daily means () for to 2018 can be obtained using the p function relative to y=1782 to 1794. For a given day and month (d,m)
The mean daily correction was estimated as
which is the average difference between unbiased and biased monthly means. is normally 80, but it is 79 for 15–17 April, 24–28 May and 20–23 June due to missing data in the 1939–2018 record. The SD was used as a measure of the error.
Explicitly, the corrected daily means are obtained as
In order to reduce the effect of outliers, the fluctuations of timescales shorter than 30 d were filtered out by means of objective analysis (Gandin, 1965; Bretherton, 1976). Figure B1 shows the time series of filtered c (Eq. B4) and σc (Eq. B5); discontinuities appear on 1 July 1791 because the data prior to and since that date were filtered separately. As only one observation was available on 1 November 1782 and 28 February 1790, these days were discarded from the analysis.
The effect of data sampling is evident from the magnitudes of corrections and errors and the different annual cycles exhibited until and after 1791. Overall, until June 1791 the corrections range between −14 cm in February and −1 cm in October, and the errors range between 11 cm in January and 14 cm in July. From July 1791 onwards the lowest corrections generally vary from −13 to −9 cm in winter, and the largest vary from 7 to 10 cm in summer; because of the increased amount of observations, errors are smaller than in the first part of the record and mostly vary between 5 and 10 cm.
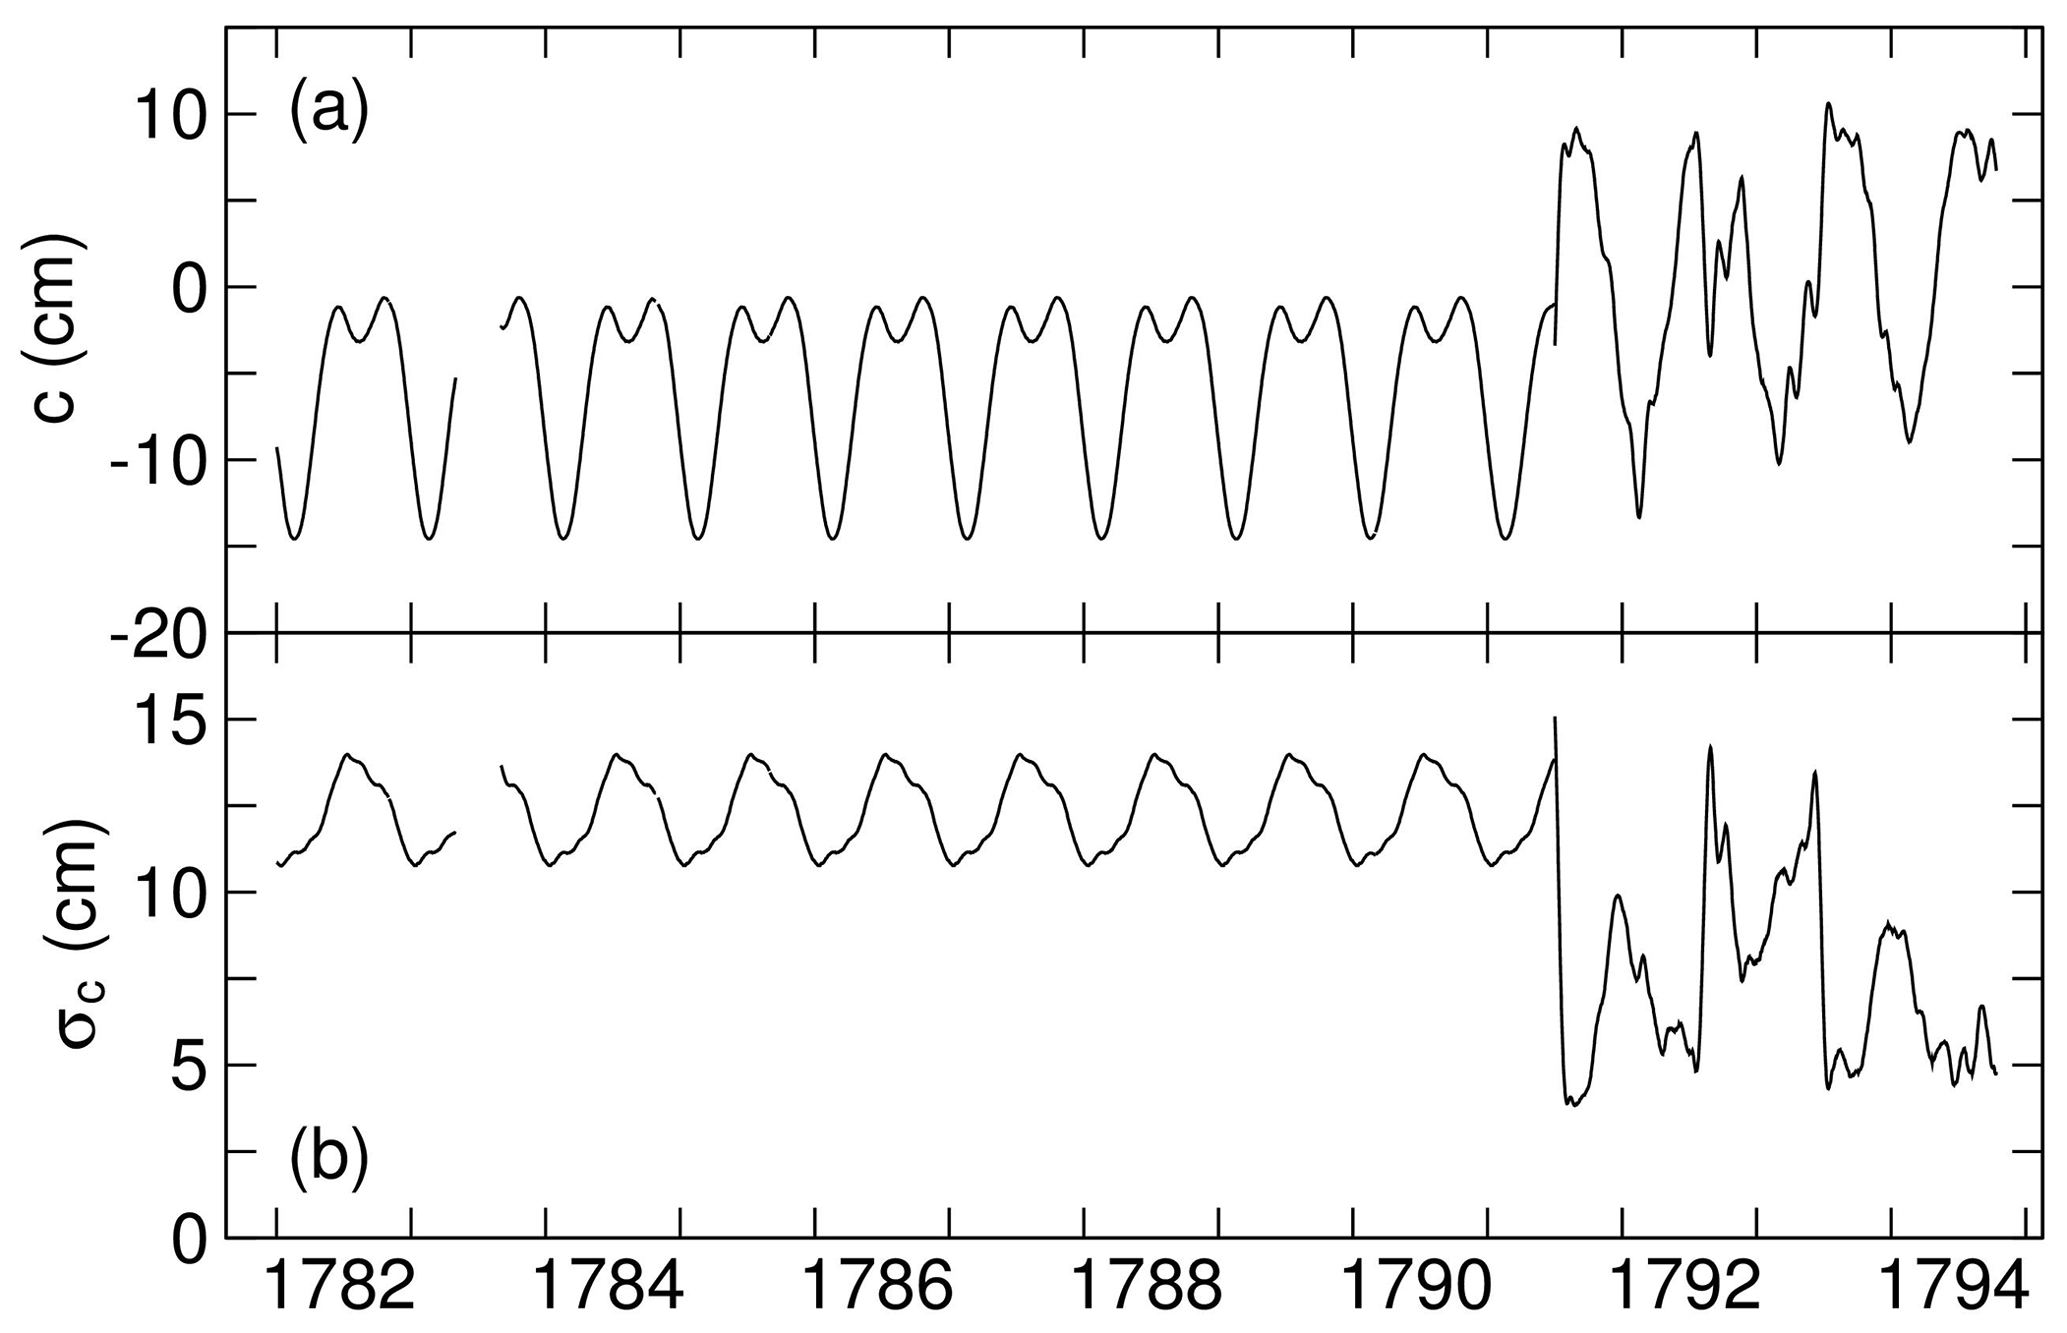
Figure B1Thirty-day filtered corrections (a) and errors (b). Discontinuities on 1 July 1791 appear because the data prior to and from that date onwards were filtered separately.
The sea heights measured by Leonardo Vordoni are available from SEANOE as “Leonardo Vordoni's sea level record at Trieste, northern Adriatic (1782–1794)” (https://doi.org/10.17882/62598; Raicich, 2019a). The 1782–1792 data of Chioggia were published from 1784 to 1795 in the Ephemerides Societatis Meteorologicae Palatinae, volumes 2–12, available at: http://www.bsb-muenchen.de (last access: 12 September 2019). The modern sea level data of Trieste, namely the hourly values from 1939 to 2018, are available from SEANOE as “Sea level observations at Trieste Molo Sartorio (Italy)” (https://doi.org/10.17882/62758; Raicich, 2019b).
The author declares that there is no conflict of interest.
This article is part of the special issue “Developments in the science and history of tides (OS/ACP/HGSS/NPG/SE inter-journal SI)”. It is not associated with a conference.
The author is grateful to Luisa Pigatto and Valeria Zanini of the Ancient Archive of the INAF Astronomical Observatory in Padua, Italy, for giving access to Leonardo Vordoni's manuscripts for data digitization and for granting permission to publish the data in the SEANOE repository and to reproduce the manuscript page used for Fig. 3. The author also thanks Philip Woodworth and an anonymous reviewer, whose comments helped improve the paper.
This paper was edited by Kristian Schlegel and reviewed by Philip Woodworth and one anonymous referee.
Agenzia Regionale per la Protezione dell'Ambiente del Friuli Venezia Giulia (ARPA-FVG): Archives of “ARPA-FVG – OSMER e GRN”, available at: http://www.meteo.fvg.it (last access: 12 August 2019), 1999.
Anonymous: Review on “Memoria delle procelle, che annualmente sogliono regnare nelle maremme veneziane” by G. Filiasi, Memorie per servire alla storia letteraria e civile, XXII, 13–21, available at: https://books.google.it/books?id=FSJuTK3cBZ0C&pg=PT1&dq=memoria+delle+procelle&hl=it&sa=X&ved=0ahUKEwjytMm_ydDnAhWOZMAKHYi2CTMQ6AEIKDAA#v=onepage&q=memoria%20delle%20procelle&f=false (last access: 23 July 2019), 1795.
Antonioli, F., Ferranti, L., Fontana, A., Amorosi, A., Bondesan, A., Braitenberg, C., Dutton, A., Fontolan, G., Furlani, S., Lambeck, K., Mastronuzzi, G., Monaco, C., Spada, G., and Stocchi, P.: Holocene relative sea-level changes and vertical movements along the Italian and Istrian coastlines, Quarterly Int., 206, 102–133, https://doi.org/10.1016/j.quaint.2008.11.008, 2009.
Bell, C., Vassie, J. M., and Woodworth, P. L.: POL/PSMSL Tidal Software Kit 2000 (TASK-2000), Permanent Service for Mean Sea Level, CCMS Proudman Oceanographic Laboratory, Bidston Observatory, Birkenhead, UK, available at: http://www.psmsl.org/train_and_info/software/task2k.php (last access: 23 July 2019), 1999.
Bretherton, F. P., Davis, R. E., and Fandry, C. B.: A technique for objective analysis and design of oceanographic experiments applied to MODE-73, Deep-Sea Res., 23, 559–582, 1976.
Bruni, S., Zerbini, S., Raicich, F., and Errico, M.: Rescue of the 1873–1922 high and low waters of the Porto Corsini/Marina di Ravenna (northern Adriatic, Italy) tide gauge, J. Geodesy, 93, 1227–1244, https://doi.org/10.1007/s00190-019-01238-w, 2019.
Camuffo, D. and Jones, P. (Eds.): Improved Understanding of Past Climatic Variability from Early Daily European Instrumental Sources (with CD-ROM), Kluwer, Dordrecht, the Netherlands, 2002.
Comune di Trieste: Stato civile, Registro degli atti di morte n. 1078, manuscript, Biblioteca Civica, Archivio Diplomatico, 17 C 5/2, Trieste, Italy, 1813.
Doursther, H.: Dictionnaire universel des poids et mesures anciens et modernes, M. Hayez, Bruxelles, Belgium, available at: https://books.google.it/books?id=KAibOR651tkC&printsec=frontcover&dq=Dictionnaire+universel+des+poids+et+mesures+anciens+et+modernes&hl=it&sa=X&ved=0ahUKEwjyi87nydDnAhVMIMUKHSnaAhMQ6AEIKzAA#v=onepage&q=Dictionnaire%20universel%20des%20poids%20et%20mesures%20anciens%20et%20modernes&f=false (last access: 12 September 2019), 1840.
Enzi, S. and Camuffo, D.: Documentary sources of the sea surges in Venice from AD 787 to 1867, Nat. Hazards, 12, 225–287, 1995.
GAM: Piogge di varj luoghi, Giornale Astrometeorologico, G. Storti, Venice, Italy, 1789–1802.
GAM: Piogge di varj luoghi, Giornale Astrometeorologico, F. Andreola, Venice, Italy, 1803–1808.
Gandin, L. S.: Objective Analysis of Meteorological Fields, Israel Program for Scientific Translations, Jerusalem, Israel, 1965.
Godin, G. and Trotti, L.: Trieste – Water Levels 1952–1971. A Study of the Tide, Mean Level, and Seiche Activity, Department of the Environment, Fisheries and Marine Service, Ottawa, Canada, available at: http://www.dfo-mpo.gc.ca (last access: 4 August 2019), 1975.
I.R. Governo Marittimo: Annuario Marittimo 1875–1889, J. Ohswaldt, then Lloyd Austro-Ungarico, then Lloyd Austriaco, Trieste, Italy, 1877–1890.
Lomb, N. R.: Least-squares frequency analysis of unequally spaced data, Astrophys. Space Sci., 39, 447–462, https://doi.org/10.1007/BF00648343, 1976.
Lorenz, J. R., Prey, A., and Stahlberger, E.: Ebbe und Fluth (Gezeiten). Dritter Bericht an der ständigen Commission für die Adria, Carl Gerald's Sohn, Vienna, Austria, 85–122, 1875.
Lorenzutti, A.: Della vita e degli studi del medico Giovanni Vordoni morto il 23 maggio 1830 in Trieste: discorso letto la sera del 23 aprile 1831 al Gabinetto di Minerva, in: Discorsi inediti del dott. Antonio Lorenzutti, Pagani, Trieste, Italy, 7–30, available at: https://books.google.it/books?id=ishvx34s6b0C&pg=PA5&dq=Della+vita+e+degli+studi+del+medico+Giovanni+Vordoni&hl=it&sa=X&ved=0ahUKEwiXlbGRytDnAhXFyqQKHQLsCGQQ6AEIKDAA#v=onepage&q=Della%20vita%20e%20degli%20studi%20del%20medico%20Giovanni%20Vordoni&f=false (last access: 23 July 2019), 1859.
Mainati, G.: Croniche ossia memorie storiche sacro-profane di Trieste, tomo V, Picotti, Venice, Italy, available at: https://books.google.it/books?id=cg8uAAAAcAAJ&printsec=frontcover&dq=Croniche+ossia+memorie+storiche+sacro-profane+di+Trieste&hl=it&sa=X&ved=0ahUKEwin4LO6ytDnAhXH0aQKHQ5NBeIQ6AEIMDAB#v=onepage&q=Croniche%20ossia%20memorie%20storiche%20sacro-profane%20di%20Trieste&f=false (last access: 23 July 2019), 1818.
Martini, A.: Manuale di Metrologia, Ossia Misure, Pesi e Monete in Uso Attualmente e Anticamente Presso Tutti i Popoli, Loescher, Turin, Italy, available at: http://www.braidense.it/dire/martini/indice.htm (last access: 23 July 2019), 1883.
Meeus, J.: Astronomical algorithms, Willmann-Bell Inc., Richmond, VA, USA, 1998.
Pugh, D. T.: Tides, Surges, and Mean Sea Level, John Wiley & Sons Ltd., Chichester, UK, 1987.
Raicich, F.: A study of early Trieste sea level data (1875–1914), J. Coastal. Res., 23, 1067–1073, https://doi.org/10.2112/04-0325.1, 2007.
Raicich, F.: On the contributions of atmospheric pressure and wind to daily sea level in the northern Adriatic Sea, Cont. Shelf Res., 30, 1575–1581, https://doi.org/10.1016/j.csr.2010.05.017, 2010.
Raicich, F.: Long-term variability of storm surge frequency in the Venice Lagoon: an update thanks to 18th century sea level observations, Nat. Hazards Earth Syst. Sci., 15, 527–535, https://doi.org/10.5194/nhess-15-527-2015, 2015.
Raicich, F.: Leonardo Vordoni's sea level record at Trieste, northern Adriatic (1782–1794), SEANOE, https://doi.org/10.17882/62598, 2019a.
Raicich, F.: Sea level observations at Trieste Molo Sartorio (Italy), SEANOE, https://doi.org/10.17882/62758, 2019b.
Raicich, F., Orlić, M., Vilibić, I., and Malačič, V.: A case study of the Adriatic seiches (December 1997), Nuovo Cimento C, 22, 715–726, 1999.
Raicich, F., Crisciani, F., Ceschia, M., and Pierobon, V.: La serie temporale del livello marino a Trieste e un'analisi della sua evoluzione dal 1890 al 2003, in: La variabilità del clima locale relazionata ai fenomeni di cambiamento climatico globale, edited by: Cortemiglia, G. C., Pàtron, Bologna, Italy, 199–220, https://doi.org/10.1007/978-3-642-02687-4, 2006.
Rossetti, D.: Elementi per la statistica di Trieste e dell'Istria. Parte I, Archeografo Triestino 1 (1st series), 13–34, available at: https://archive.org/details/archeografotrie03triegoog/mode/2up (last access: 23 July 2019), 1829.
Rusconi, A.: Il Comune Marino a Venezia, ricerche e ipotesi sulle sue variazioni altimetriche e sui fenomeni naturali che le determinano, Publication No. 159, Ufficio Idrografico del Magistrato alle Acque di Venezia, Venice, Italy, 1983.
Scargle, J. D.: Studies in astronomical time series. II. Statistical aspects of spectral analysis of unevenly spaced data, Astrophys. J., 263, 835–853, https://doi.org/10.1086/160554, 1982.
Schaub, F.: Instruction zur Behandlung der selbstregistrirenden Fluthmesser für die österreichisch-adriatischen Beobachtungsstationen, Erster Bericht der ständigen Commission für die Adria, Karl Gerald's Sohn, Vienna, Austria, 66–68, https://books.google.it/books?id=_PqfAAAAMAAJ&pg=PP3&dq=Erster+Bericht+der+st%C3%A4ndigen+Commission&hl=it&sa=X&ved=0ahUKEwjEiPP3y9DnAhULCewKHTtzAz8Q6AEIMjAB#v=onepage&q=Erster%20Bericht%20der%20st%C3%A4ndigen%20Commission&f=false (last access: 23 July 2019), 1869.
Stancovich, P.: Biografia degli uomini distinti dell'Istria, tomo III. Gio. Marenigh, Trieste, Italy, available at: https://archive.org/details/bub_gb_dTGp9xk0n1wC/mode/2up (last access: 23 July 2019), 1829.
Sterneck, R. V.: Kontrolle des Nivellements durch die Fluthmesserangaben und die Schwankungen des Meeresspiegels der Adria. Mitteilungen der k.u.k. Militär-Geographischen Institutes, 24, 75–111, available at: http://anno.onb.ac.at (last access: 23 July 2019), 1905.
Vordoni, L.: Quadro delle piogge cadute nel 1787, manuscript, Corrispondenza da altri a Giuseppe Toaldo, Vordoni, Trieste, Cod. V, Ancient Archive of INAF Astronomical Observatory, Padua, Italy, 1788.
Vordoni, L.: Sul flusso e riflusso del mare 1782 al 1794 fino a tutto 12 8bre. Aestus maris in Tergest. Littore observat. a Leonardo Vordoni M.D. ab anno MDCCLXXXII ad annum MDCCXCIV, manuscript, Osservazioni meteorologiche di autori vari raccolte da Giuseppe Toaldo: Trieste, Leonardo Vordoni, Cod. XIV, Ancient Archive of INAF Astronomical Observatory, Padua, Italy, 1795a.
Vordoni, L.: Letter from Leonardo Vordoni to Giuseppe Toaldo dated 18 July 1795, manuscript, Corrispondenza da altri a Giuseppe Toaldo, Vordoni, Trieste, Cod. V, Ancient Archive of INAF Astronomical Observatory, Padua, Italy, 1795b.
Vordoni, L.: Lettera del dottor Leonardo Vordoni protomedico di Trieste sulla trascuratezza di applicazione delle osservazioni meteorologiche all'agricoltura, e specialmente alla medicina, Giornale Astro-Meteorologico per l'anno 1810, 95–97, F. Andreola, Venice, 1809.
Woodworth, P. L.: A study of changes in high water levels and tides at Liverpool during the last two hundred and thirty years with some historical background. Proudman Oceanographic Laboratory Report No. 56, Bidston, UK, available at: http://nora.nerc.ac.uk/id/eprint/3916/1/ir56.pdf (last access: 17 December 2019), 1999.
Wagner, G. and Strackerjan, F. A.: Compendium der Münz-, Maass-, Gewichts- und Wechselcours-Verhältnisse sämmtlicher Staaten und Handelsstädte der Erde, B.T. Tauber, Leipzig, Germany, available at: https://archive.org/details/bub_gb_v5U7AAAAcAAJ/mode/2up (last access: 23 July 2019), 1855.
Zerbini, S., Raicich, F., Prati, C. M., Bruni, S., Del Conte, S., Errico, M., and Santi, E.: Sea-level change in the northern Mediterranean Sea from long-period tide gauge time series, Earth Sci. Rev., 167, 72–87, https://doi.org/10.1016/j.earscirev.2017.02.009, 2017.
- Abstract
- Introduction
- Biography of Leonardo Vordoni
- The manuscript
- Data consistency checks
- Monthly and annual mean sea levels
- Storm surges
- Concluding remarks
- Appendix A: Problems and inconsistencies in the data set
- Appendix B: The estimation of daily mean sea heights
- Data availability
- Competing interests
- Special issue statement
- Acknowledgements
- Review statement
- References