the Creative Commons Attribution 4.0 License.
the Creative Commons Attribution 4.0 License.
 | 07 Sep 2026
Classical antiquity origin of spatial data underlying portolan charts: how Pietro Vesconte might have assembled the Carta Riccardiana utilising maps in Marinus of Tyre's projection

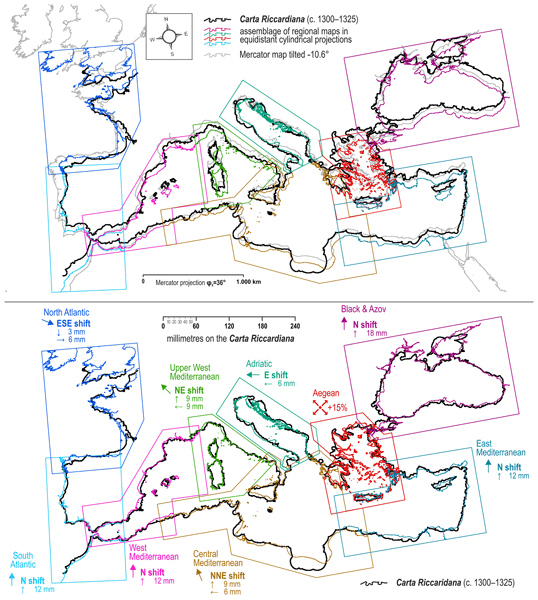
The remarkably accurate representation of coastlines on late mediaeval portolan charts has garnered significant scholarly interest in uncovering the origin of their spatial data, with the prevailing hypothesis suggesting that they are authentic products of their time, created by synthesising numerous shipborne bearing and distance measurements. The pursuit of those answers also prompted the establishment and advancement of a cartometric approach, through which they can be attained with quantitative accuracy. This study is based on cartometric analyses and historical evidence, providing a comprehensive examination of the anonymous Carta Riccardiana portolan chart, presumably created by Pietro Vesconte between 1300 and 1325. It posits a paradigm shift regarding the late mediaeval origin hypothesis, tangibly indicating that the conventional geometry of portolan charts was likely developed by late mediaeval copyist-cartographers who utilised regional maps from classical antiquity, originally made in the projection of Marinus of Tyre calibrated to their mid-latitudes as inputs, which they partially scaled and gradually tilted, using a map in Ptolemy's first projection as a reference model. Concurrently, the article provides a historical overview of the most significant cartometric studies in the field, critically analysing their unique systemic parameters that have influenced various hypotheses regarding the origin of portolan charts – specifically, the systemically induced similarity with the modern map in the Mercator projection, which is, in the case of the Carta Riccardiana, at least, a misleading notion.
-
Please read the editorial note first before accessing the article.
-
Article
(26743 KB)
-
Please read the editorial note first before accessing the article.
- Article
(26743 KB) - Full-text XML
- BibTeX
- EndNote


The abrupt emergence of nautical cartography in the Mediterranean in the late 13th century in the form of manuscript portolan charts (Fig. 1) and atlases (Beazley, 1904; Campbell, 1987) – named after portolani, contemporaneously created texts containing information about courses and distances between ports – constitutes one of the most intriguing events in the history of cartography due to a variety of their distinctive characteristics that distinguish them from any known cartographic antecedents, which can be phenomenologically categorised into three sets of features.
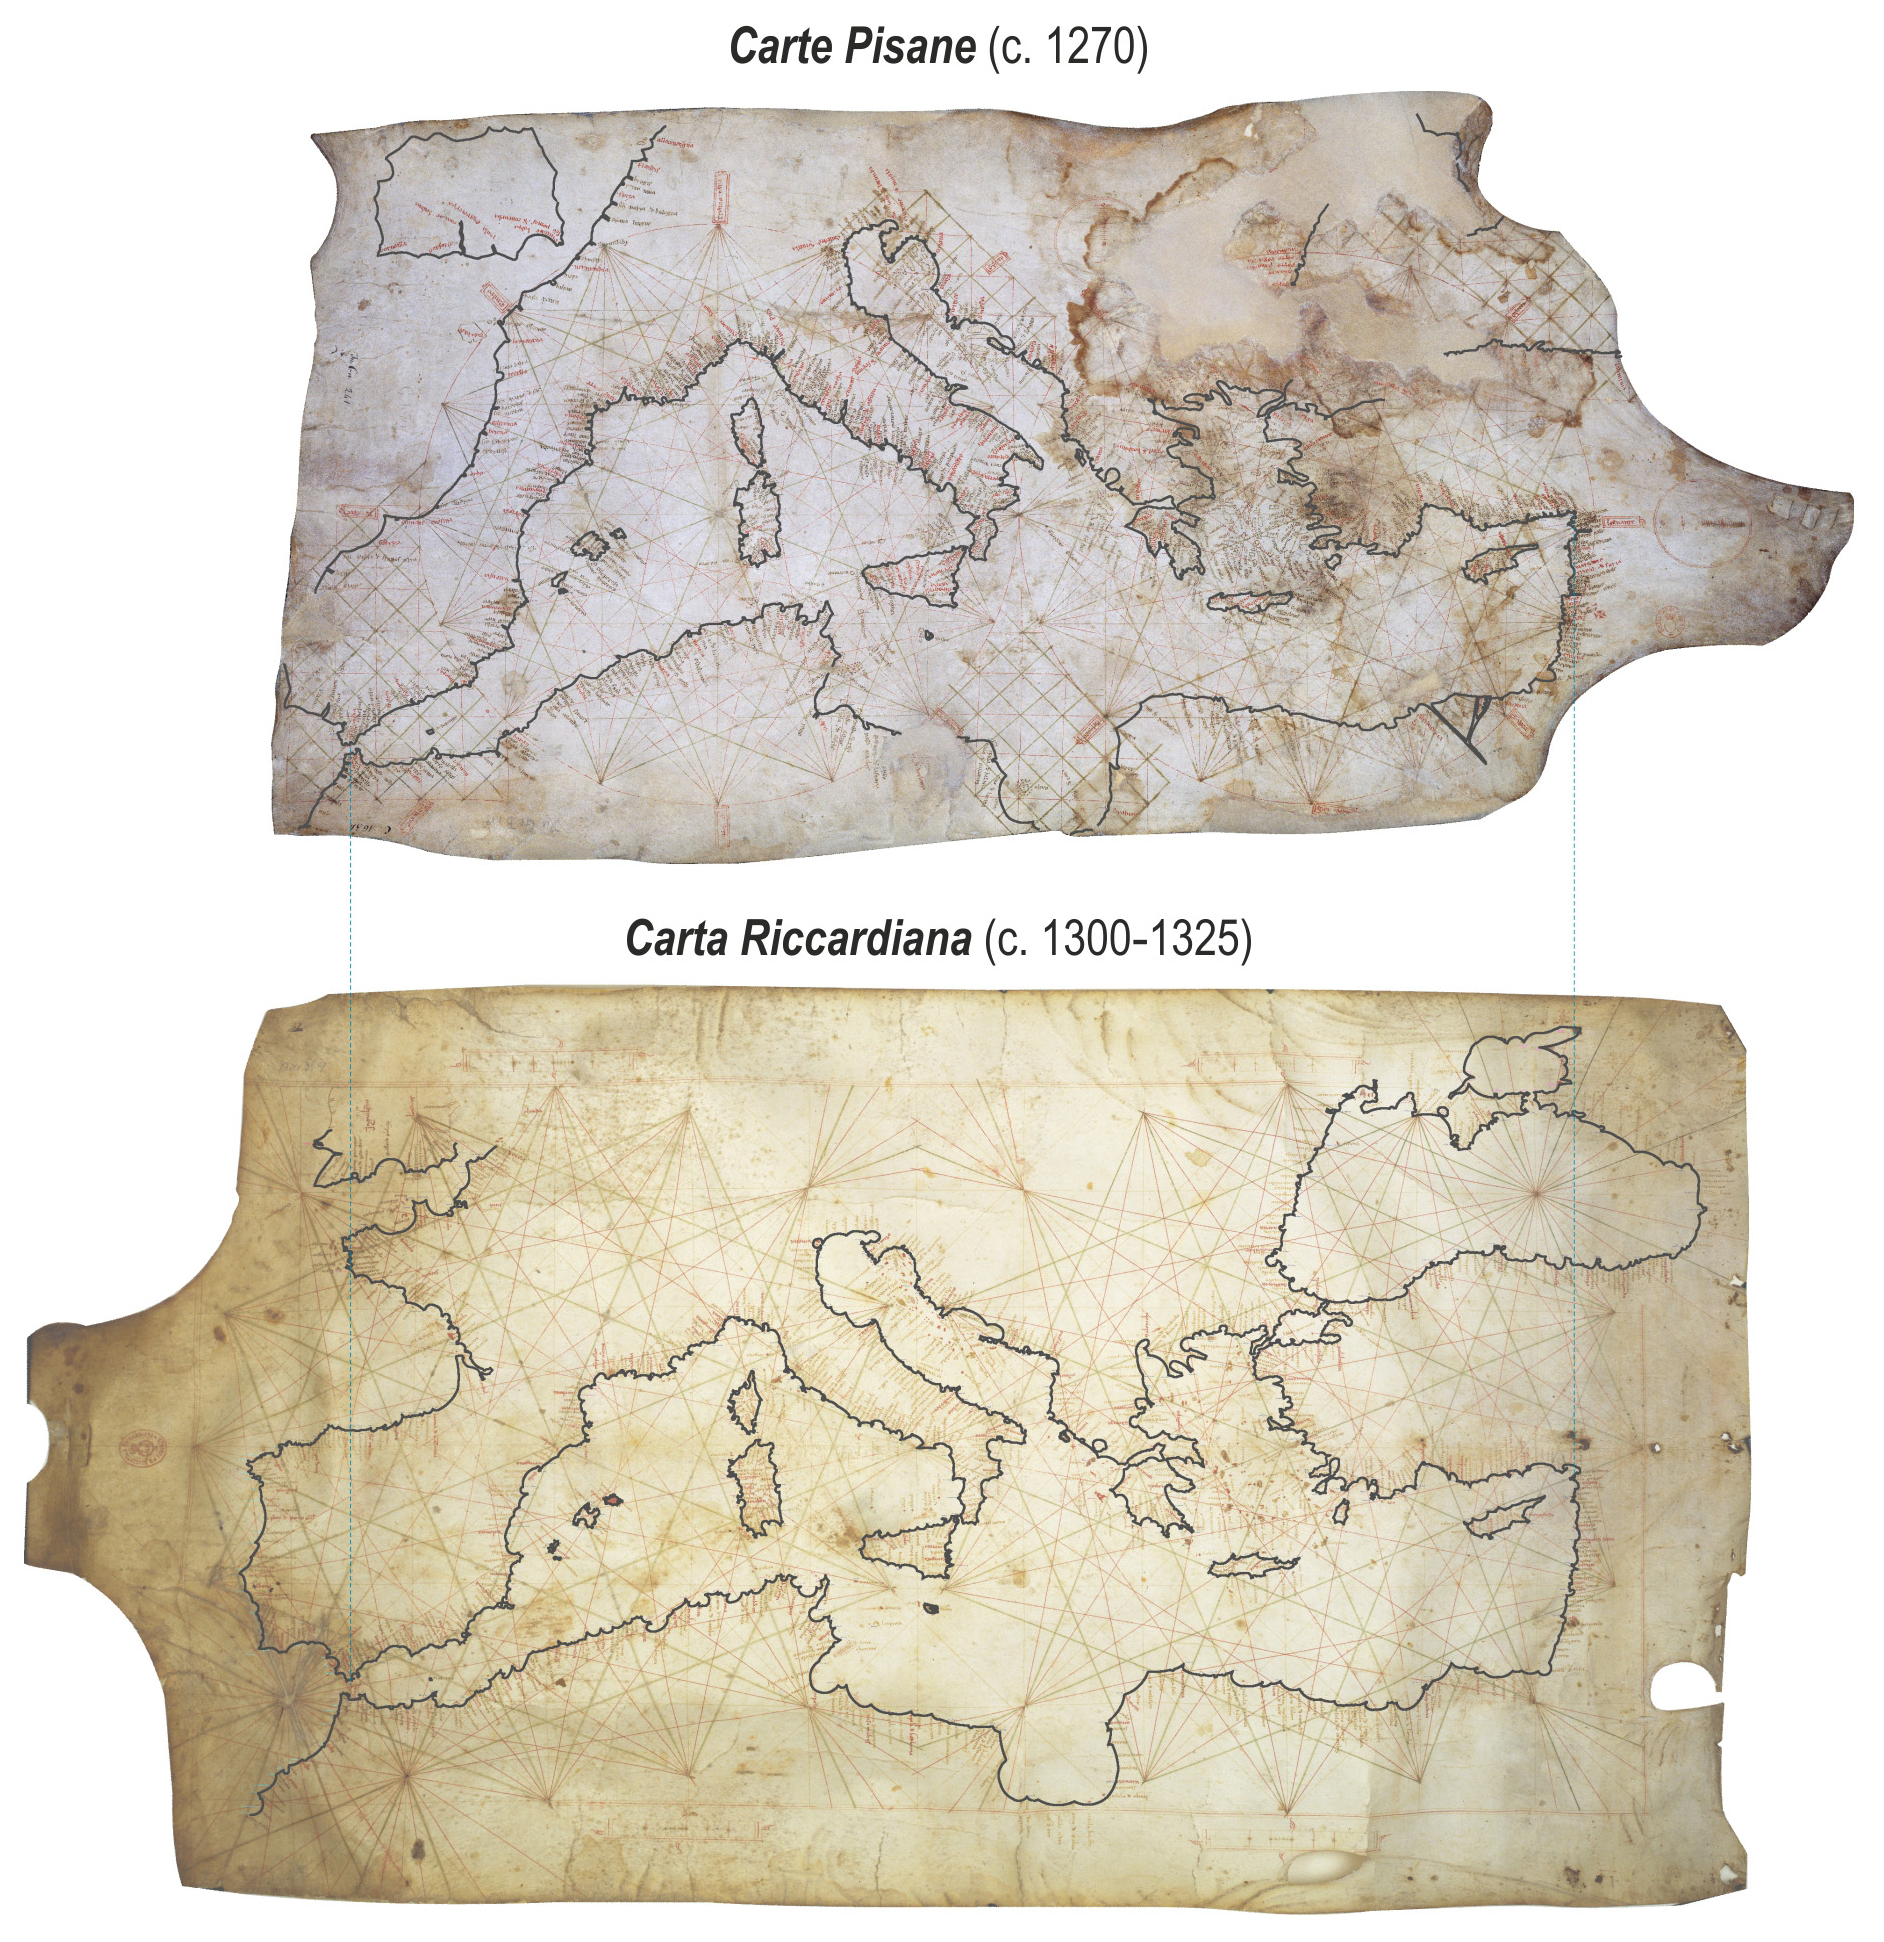
Figure 1The anonymous Carte Pisane (ca. 1270) and the Carta Riccardiana (ca. 1300–1325) with vectorised coastline contours, scaled to equalise their longitudinal extent of the Mediterranean. Chart sources: Bibliothèque nationale de France, département Cartes et plans, GE B-1118 (RES); Biblioteca Riccardiana, Ricc. 3827.
The first one is related to the focus and aesthetics of spatial representation, prioritising the mainland and island coastlines of the Mediterranean and Black Seas, as well as the Atlantic coasts of Western Europe and Northwest Africa. The typical coastline renderings on portolan charts are schematic, featuring a series of arcs orientated towards the land, producing a sawtooth appearance from the sea with toponyms inscribed perpendicularly to coastline contours, necessitating the rotation of the charts and atlas sheets for their full utilisation. The second one comprises practical navigational instruments – linear scale bars (Fig. 2) and wind roses – incorporated directly into the charts, which, to the best of current knowledge, emerged on portolan charts for the first time in history. The third and most captivating feature is their exceptionally realistic portrayal of coastlines, which markedly contrasts with the conventional rather simplified depictions found even on the most complex Western European mappaemundi of the era such as the Hereford, and Ebstorf maps (Woodward, 1987; Pujades, 2023), as well as the Tabula Rogeriana, produced in the mid-twelfth century for the Norman King of Sicily, Roger II, by the Arab geographer Muhammad al-Idrisi, who was largely influenced by Arabic translations of Claudius Ptolemy's Geographia (Ahmad, 1998; Tibbets, 1998a, 1998b).
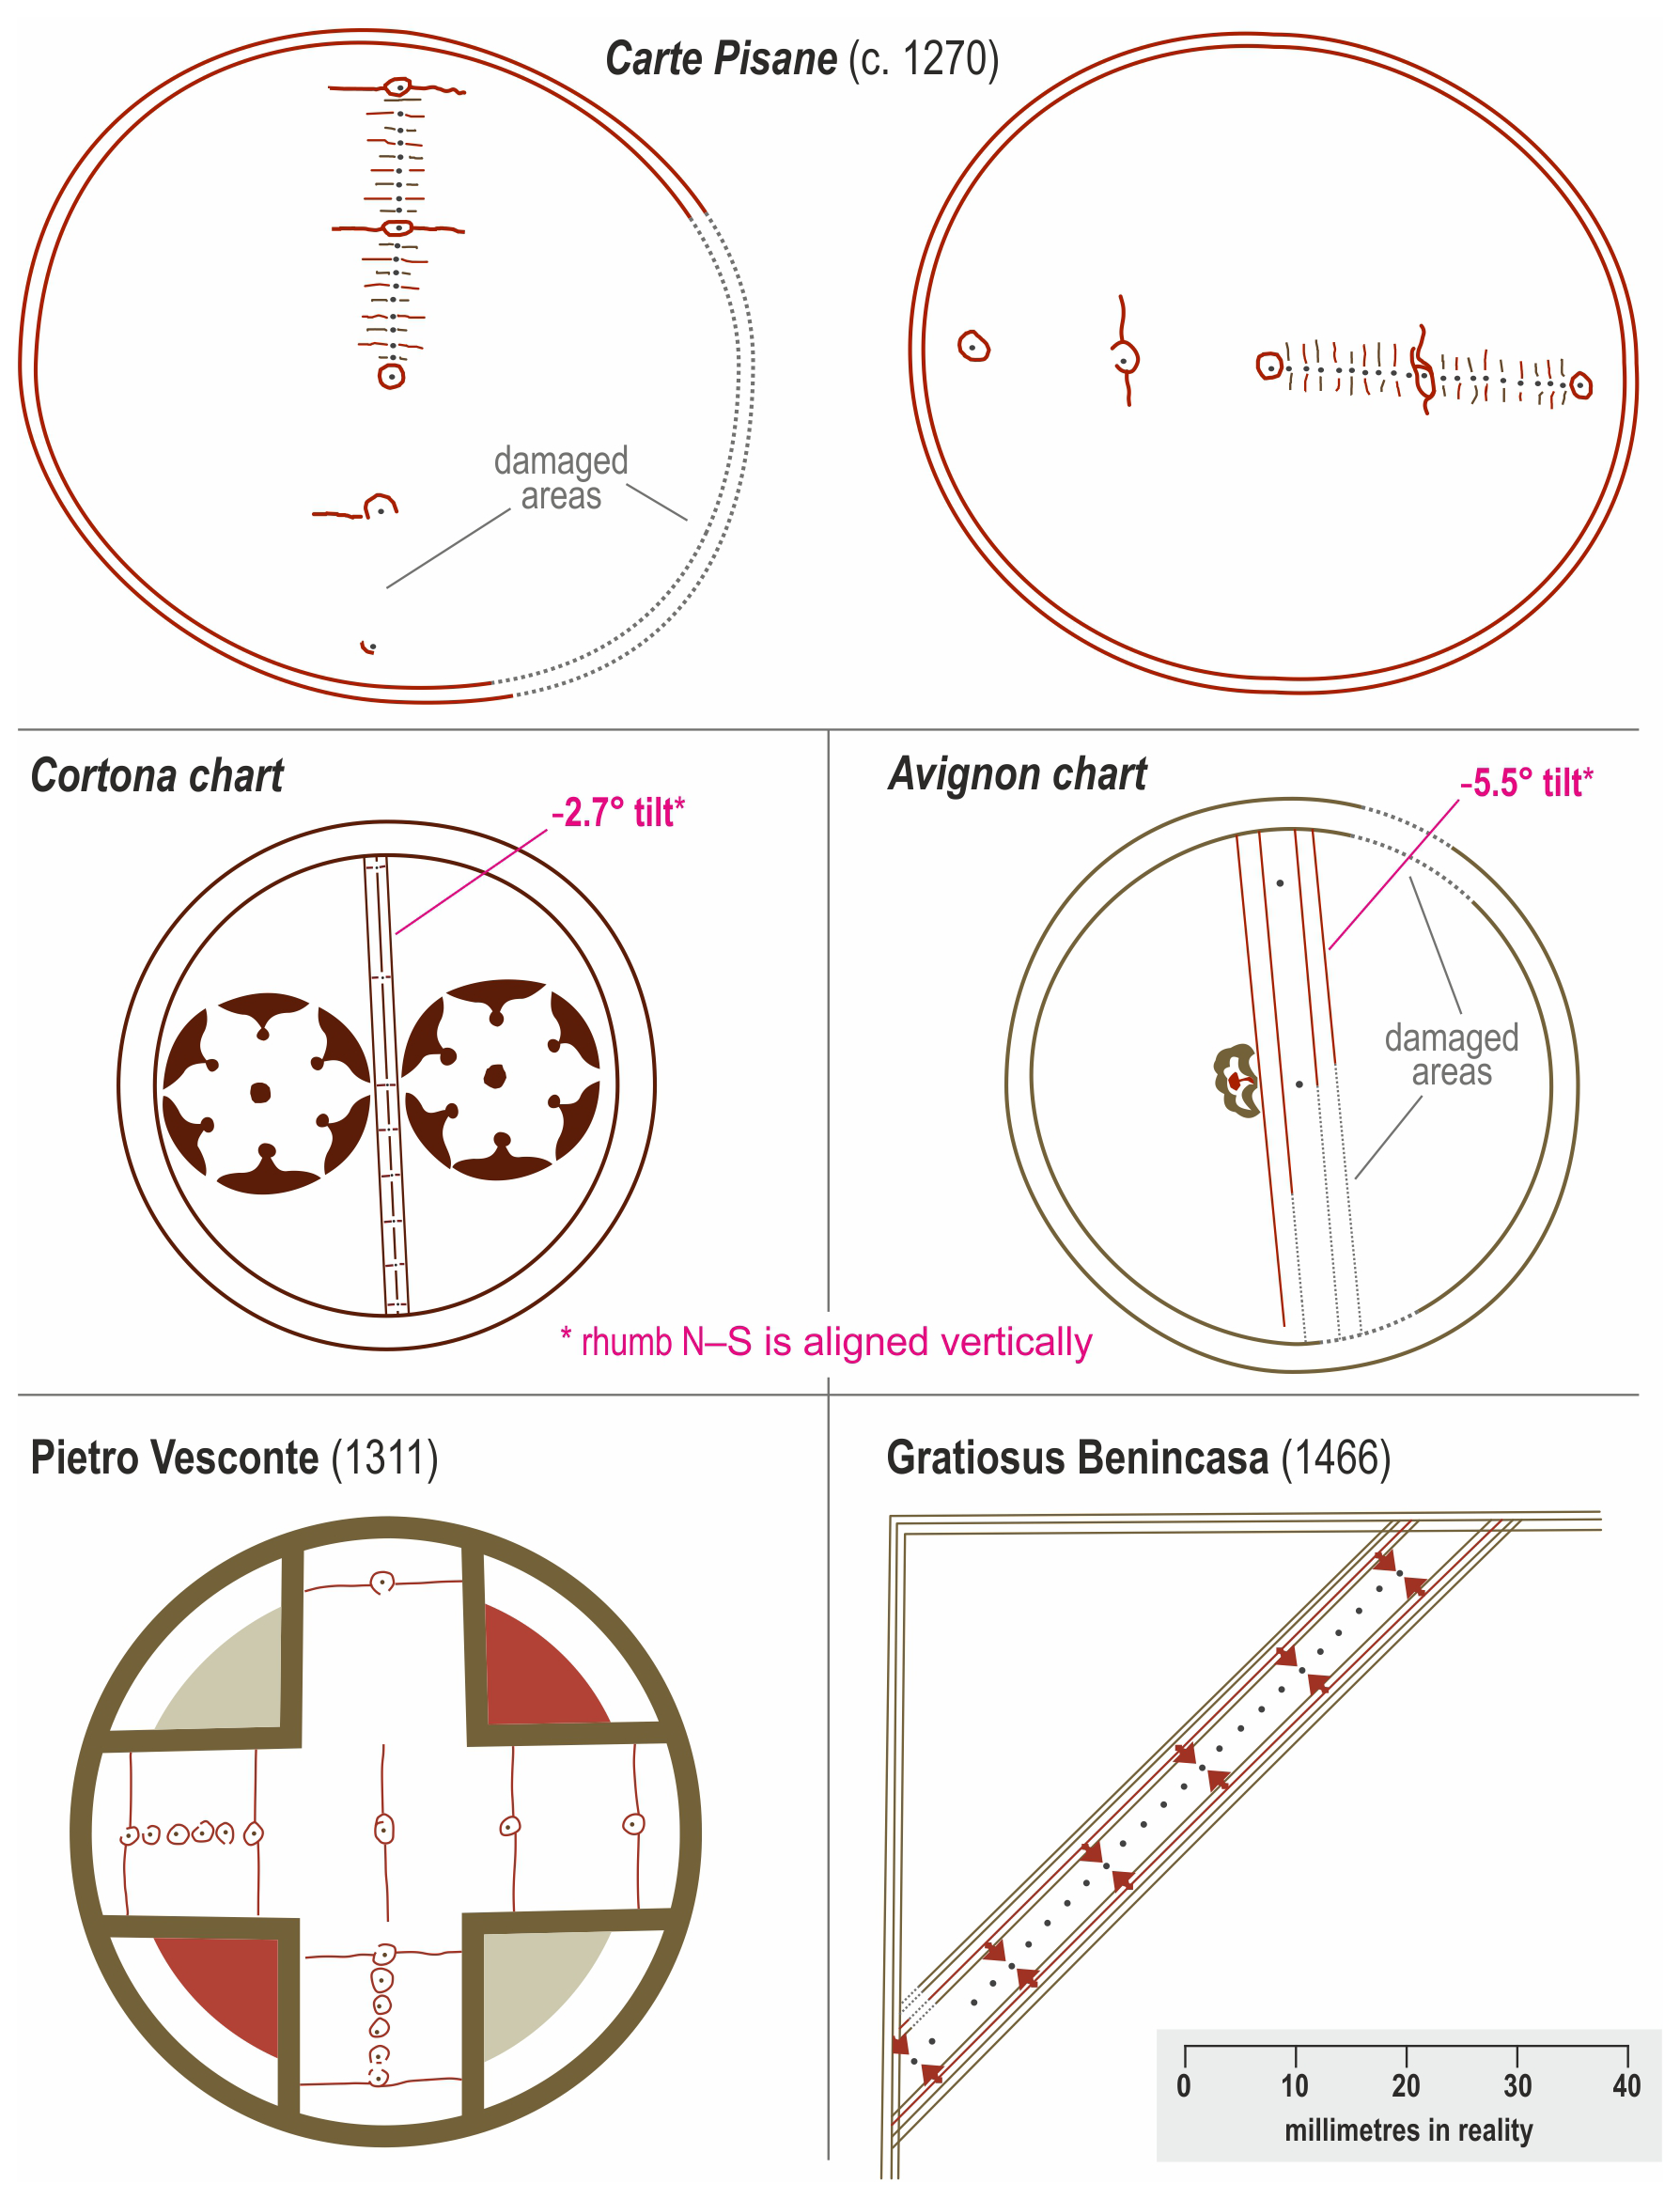
Figure 2Vectorised scale bars from selected portolan charts. The variations in their alignments display that the cartographers who created them were erroneously convinced that distances are accurately preserved in all directions across the entire chart field.
Mediaeval and premediaeval origin hypotheses
The exceptional planimetric accuracy of coastline contours on portolan charts (Fig. 3) has prompted increased interest from scholars since the second half of the 19th century, aimed at discovering the origin of the spatial data utilised in their development, as the late mediaeval cartographers did not record the exact sources or datasets utilised in their creation. Most studies arising from this inquiry were undertaken by historians of cartography, predominantly using descriptive methodologies. The resulting consensus that has emerged from them – a consensus that has gradually established itself as a paradigm regarding their origin in the academic community – is that the sudden appearance of portolan charts and portolani is a self-evident fact that during the 13th century there was an intensification of maritime activities in the Mediterranean, accompanied by a technological leap in the form of the discovery of the magnetic compass, and that navigators of that period intensively measured and recorded their sailing courses and distances travelled, based on which cartographers subsequently created portolan charts (Fischer, 1886; Kretschmer, 1909; Stevenson, 1911; Taylor, 1951a, b; Pujades, 2007, 2023; Gaspar, 2007, 2008, 2010, 2023). Conversely, the methodologically rigorous quantitative studies of portolan charts, grounded in cartometric analyses of their geometric characteristics contextualised with established historical data (Wagner, 1896/1969; Loomer, 1987; Nicolai, 2014, 2024; Marelić, 2024a, b, 2025a, b), typically indicate that the origins of their spatial data are older, suggesting that portolan charts are late mediaeval reproductions of earlier cartographic sources.
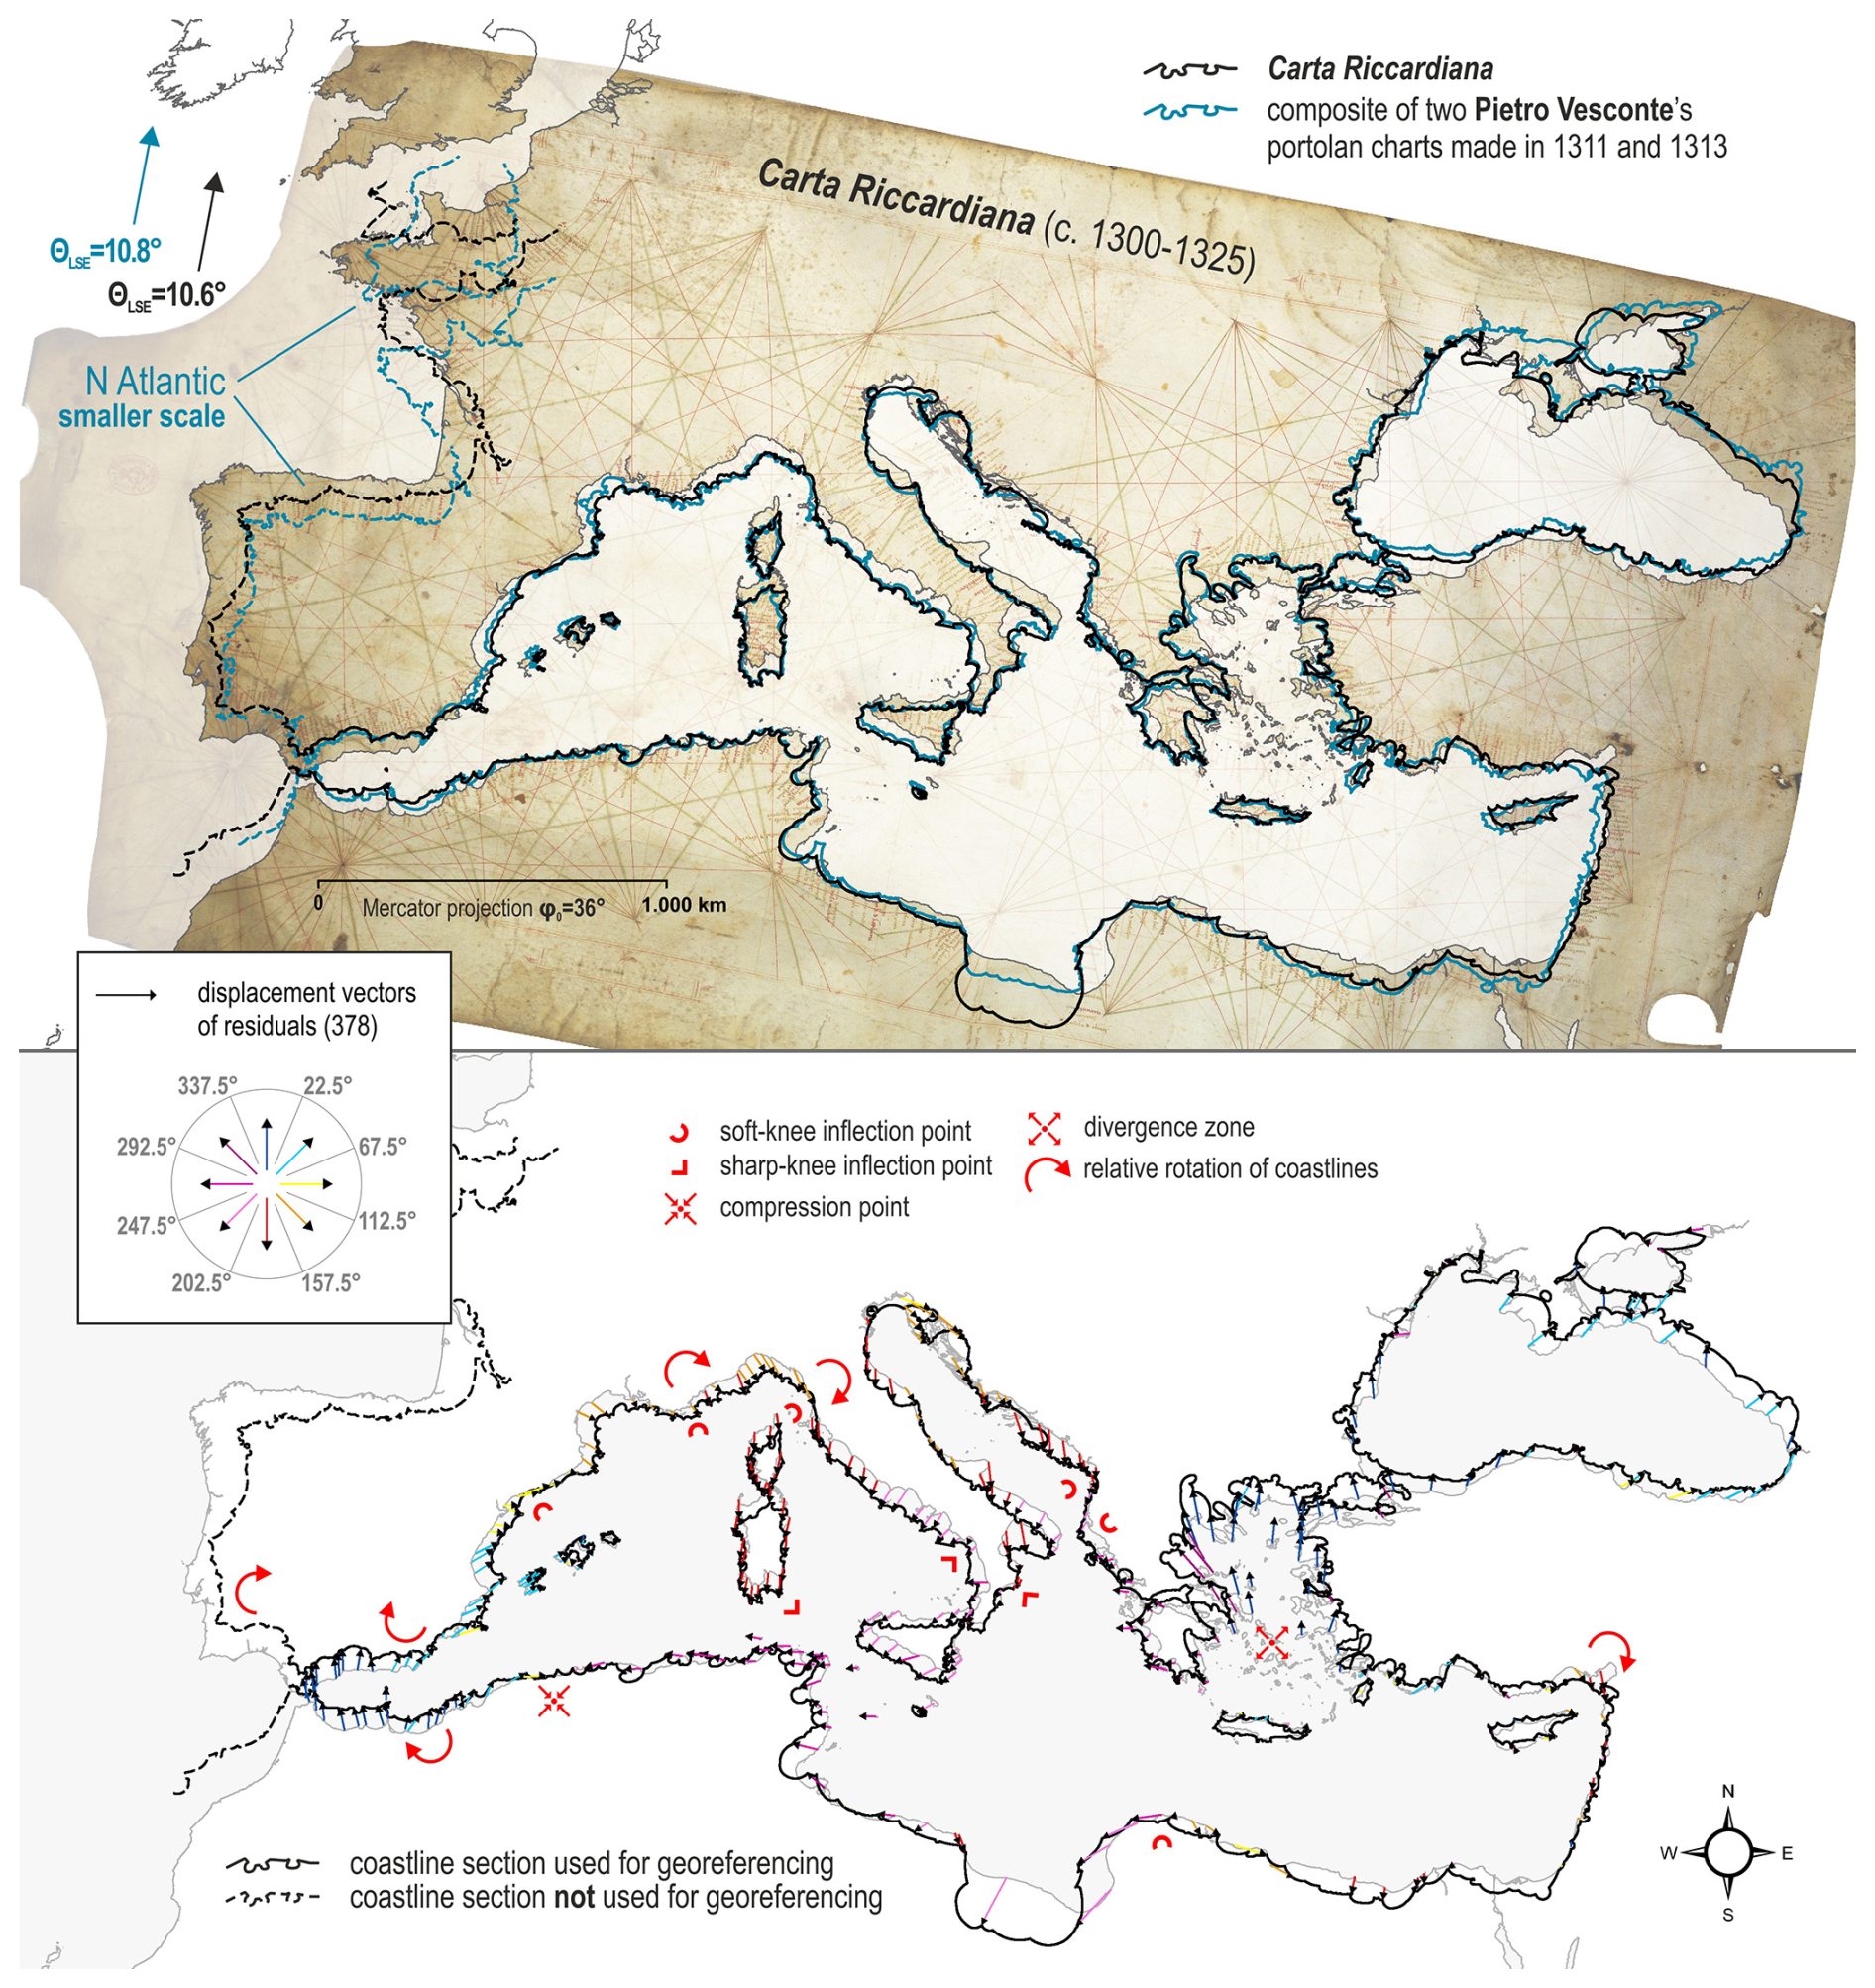
Figure 3The digitised image of the anonymous Carta Riccardiana portolan chart (ca. 1300–1325) georeferenced to a modern reference map in the Mercator projection and its vectorised coastline overlaid with the vectorised coastline of the georeferenced composite of two Pietro Vesconte's charts made in 1311, and 1313 (the upper part), and the magnitude and orientation of its displacement vectors of residuals (the lower part). Chart source: Biblioteca Riccardiana, Ricc. 3827. Basemap shapefile source: http://www.marineregions.org (last access: 7 December 2025; Claus et al., 2017).
The article utilises extensive and detailed cartometric approach in conjunction with historical information and proposes a plausible and straightforward method by which late mediaeval Ligurian cartographers graphically assembled copies of cartographic sources from classical antiquity into a coherent unit known as a portolan chart, to which they subsequently incorporated linear scale bars and wind roses for navigational purposes. The hypothesis is corroborated through one of the earliest portolan charts, the anonymous Carta Riccardiana (ca. 1300–1325), which displays the European Atlantic coasts at a comparatively larger map scale than contemporaneously and some later made portolan charts, and was likely created by Pietro Vesconte. Although he was of Genoese descent, all his known portolan charts and atlases were produced in Venice between 1311 and 1327, and he likely authored maps in Marino Sanudo's book Liber Secretorum Fidelium Crucis (The Book of Secrets of the Faithful of the Cross) published in circa 1320 (Nordenskiöld 1897, p. 57; Campbell 1987, pp. 407, 432, 434, 460; Krtalić, 2022, pp. 4, 8). The author of charts made in 1321 and 1327 that resemble his earlier works is Perrinus (Perrino) Vesconte. Adolf E. Nordenskiöld thought Perrinus is a variation of the name Petrus (Nordenskiöld 1897, p. 58), while Paolo Revelli believed Perrinus was Petrus Vesconte's son or a nephew (Revelli, 1937, according to Campbell, 1987, p. 407, note 274). The proposed method also demonstrates why the geometric best fit of portolan charts with the modern reference map in the Mercator projection across the Mediterranean and Black Sea areas – discussed in more detail in Sect. 6.1, 6.2, and 6.3 – has occasionally been misinterpreted as evidence that the conformal cylindrical projection was invented centuries before Gerard Mercator conceptually introduced it, even by the author himself.
The article outlines two concurrent overviews of historical advancements in science and technology. One overview discusses the history of cartography, geodesy, navigation, and the use of the magnetic compass in classical antiquity and the late Middle Ages, which are crucial for understanding the fundamental findings of this research. The other overview covers the history of academic and peer-reviewed quantitative and cartometric research on the geometry of portolan charts published since the mid-19th century, while critically evaluating the unique systemic parameters that have influenced diverse hypotheses about the origin of spatial data on portolan charts. Consequently, the elements pertaining to the methodology and prior research in this paper are inseparably and intricately woven throughout its entire structure.
The anticlockwise tilts of coastline renderings on portolan charts have historically been often interpreted as clear evidence that late mediaeval sailors navigated these regions using the magnetic compass, perceiving the compass directions as true due to the lack of understanding of the (easterly) magnetic declination. A superficial examination of events may suggest a causal relationship between the magnetic compass and portolan charts, as both originated in the Mediterranean around the same period.
The earliest European records of the usage of the magnetic compass for navigation are Alexander Neckam's late twelfth-century works De Utensilibus (On Utensils) and De Naturis Rerum (On the Nature of Things), describing a compass featuring a floating needle (Taylor, 1957, p. 95; Nicolai, 2014, pp. 143–145). In 1205, Guyot de Provins described a compass with a floating needle in a poem, indicating that the needle, buoyed by straw, consistently aligns with the North Star, having previously been touched by the “ugly black stone” [the magnetite ore]; a technique employed in navigation if celestial bodies are not visible (Taylor, 1957, pp. 95–96). Another early account is a letter by the French engineer Petrus Peregrinus dated 1269, entitled Epistola de magnete (A letter about the magnet), indicating that the magnetic needle aligns with the meridians that converge at the antipodal celestial poles, wherein the same poles repel and the opposite poles attract. Peregrinus delineated two varieties of compasses: one with a floating oval magnet positioned in a bowl which floats in water within a larger transparent container, and another classified as a dry pivot compass having a magnetised iron needle pivoting around a vertical axis that is affixed to the base, coupled with a compass rose marked with cardinal directions and a degree scale along its edge (Lane, 1963, pp. 615–616; Smith, 1970, pp. 14–15). Intriguingly, Benedetto Cotrugli, in his 1464 book De Navigatione (On Navigation) posits that knowledge of the dipole and orientation properties of magnets may have existed in the Mediterranean during classical antiquity, and that the compass might have been utilised as a navigational instrument. He cites Albertus Magnus's 13th-century work, De Lapidibus (On Stones), wherein he alludes to a statement by Aristotle (fourth century BCE):
The angle of a magnet is its power to attract iron to Zoron, that is, the North, and this is used by sailors. But the opposite angle of the same magnet to it draws iron to Afon in the South Pole, and if you approach the iron to the angle of Zoron, the iron will turn to itself to Zoron, and if the opposite angle is approached, it will turn directly to Afon.
Cotrugli subsequently remarks: “And according to this double authority [likely referring to both Aristotle and Albertus Magnus], we have a magnet serving at different poles” (Cotrugli, 1464, pp. 43r–43v).
In the context of employing a magnetic compass in the Mediterranean, a 15th-century legend posits that the magnetic compass was invented in the early 14th century in Amalfi, credited to Flavio Gioja, despite the absence of archival evidence regarding his existence (Lane, 1963, p. 616; Nicolai, 2014, p. 147). Roel Nicolai cites Flavio Biondo's 1474 publication, Italia Illustrata, which denotes that this invention was conventionally acknowledged in Amalfi (Biondo 1474, as noted by Nicolai, 2014, p. 147). Another historical attribution of magnetic compass to the Amalfitans is in Cotrugli's De Navigatione, where he states: “And later the Amalfitans discovered the use of the magnet, as I have learned from many experienced sailors worthy of belief, with whom I have conferred much on it, most especially the Genoese” (Cotrugli, 1464, p. 43r). The subsequent advancement in compass technology was the creation of the mariner's compass, wherein the compass rose is affixed to the compass needle rather than the base of the housing, significantly facilitating the reading of the bearing. Frederic C. Lane asserts that the mariner's compass was utilised in the Mediterranean region from the early 14th century, specifically around the year 1300, with its invention attributed to the city of Amalfi. According to him, the swift evolution of the representation from the Carte Pisane to that of Pietro Vesconte's charts is associated with the improvements in compass technology at the transition from the 13th to the 14th century (Lane, 1963, p. 616–617).
In contrast, Nicolai, by examining Ramon Pujades's analysis of the historical occurrences of the term bussola or buxola (Pujades, 2007), which refers to the mariner's compass, argues that it was introduced in the Mediterranean too late (in the mid-14th century) to establish a sufficient database of courses sailed for the creation of the earliest surviving portolan charts (Nicolai, 2014, p. 168). He also computes that the bearings in the oldest known portolan, the Liber de existencia riveriarum at forma maris nostri mediterranei (Book of the appearance of shores and the shape of our Mediterranean Sea), the earliest known portolan document supposedly created in the early 13th century that was likely accompanied by a portolan chart now lost (Gautier Dalché, 1995), suggest that the earlier portolan chart geometrical framework might have originally been aligned with geographic north (Nicolai, 2024). Moreover, the average coastline tilt of approximately −10° in portolan charts does not align with the easterly magnetic declination values from the late Middle Ages in their eastern regions, according to paleomagnetic models (Niccolai 2014, 2024; Marelić, 2024a, b, 2025a). This topic is discussed in multiple subsequent sections of this article, most thoroughly in Sect. 7.4.
Geographer Armand D'Avezac (1863) was among the first to express a professional opinion regarding the origin and geometric attributes of portolan charts, suggesting that they emerged from the aggregation of numerous shipborne observations of navigational courses and distances travelled during the late Middle Ages, which were directly transcribed onto a flat map surface with a constant scale, thereby “literally” putting them “into a family of primitive flat maps” (“… appartiennent virtuellement à la famille primitive des cartes plates”) (D'Avezac, 1863, p. 298). D'Avezac presumably posits that neglecting the curvature of the Earth's surface inherently results in a family of the so-called “primitive” map projections, known as equidistant cylindrical projections; notably the plate carrée, which is an equidistant cylindrical projection with its standard parallel situated at the equator. Nevertheless, these projections, originally developed in ancient Greece, do not display the convergence of the meridians, and preserve true-to-scale distances solely along their images of meridians and the standard parallel(s), while the distortions of distances in the longitudinal direction increase as one moves away from the standard parallel (Keuning, 1955, pp. 13–14; Snyder, 1993, pp. 5–7). It appears to have been counterintuitive not only to D'Avezac but also to numerous individuals unfamiliar with the differences between the spherical or ellipsoidal geometry of the Earth and the Euclidean projected geometry of maps and nautical charts that neglecting the curvature of the Earth's surface cannot yield a map with a rectangular graticule that uniformly preserves distances across its entire field. In fact, no map projection, including those designated as equidistant, can maintain true-to-scale distances in all directions.
In 1881, geodesist Matteo Fiorini (1881) proposed that the radiating lines of their wind roses in 32 directions imply that the most plausible solution is the equidistant azimuthal projection; however, he did not strive to empirically test the hypothesis. Given that portolan charts typically feature two (invisible) circles of wind roses, this hypothesis suggests that they represent amalgamations of two adjacent equidistant azimuthal projections; one centred in the Western Mediterranean and the other in the Eastern Mediterranean. It further suggests that late mediaeval cartographers possessed the expertise to translate locally observed bearing data into the oblique aspect of such a projection. The invention of the equidistant azimuthal projection is frequently credited to Abu Rayhan Muhammad ibn Ahmad al-Biruni, a polymath from the Islamic Golden Age in the 10th and 11th centuries. However, its initial manifestation in polar form, which is the simplest to construct, appears on an incomplete and rudimentary star map created by Conrad of Dyffenbach in 1426. The oblique aspect, which relies on more complex calculations, was first mathematically proposed by Bradock Mead (also known as John Green) in 1717 and subsequently refined by Johann Heinrich Lambert in 1772 (Snyder, 1993, pp. 29, 58). Fiorini's concept, which contradicts the historical evolution of geodesy and cartography in the Mediterranean during the late mediaeval period, also lacked corroboration from subsequent studies on portolan chart geometry, with its first concise refutation emerging within two decades.
The establishment of the cartometric method
In 1896, geographer and cartographer Hermann Wagner published the paper The Origin of the Mediaeval Italian Nautical Charts (Wagner, 1896/1969), which presented the findings of the first-ever cartometric analysis, or cartometric method, as he originally termed it, asserting that scholars before him “have confined themselves too much to examining the outlines of older and newer maps in a comparative manner, without measuring the distances and the directions” (Wagner, 1896/1969, p. 697/478). He analysed portolan charts made by Pietro Vesconte in 1318 and Gratiosus Benincasa in 1480, conducting physical measurements of their coastlines and juxtaposing them with analogue measurements across the modern map.
Wagner notices that the length of the portolan mile (miglio) – a unit of distance on portolan charts, whose relation to other late mediaeval units remains unclear, leaving its exact length ambiguous – varies across the chart field, suggesting that portolan charts are likely composite images built from sub-pieces that exhibit variations in scale and tilt. He also exemplified a particular instance of the Adriatic Sea rendering on the Carte Pisane, the oldest-known portolan chart attributed to the unknown Genoese cartographer from the late 13th century (circa 1270), which, unlike subsequent portolan charts, does not align with its overall anticlockwise coastline tilt of the Mediterranean (compare the upper and lower parts of Fig. 1) serving as “convincing proof that already comparatively accurate maps were in existence before the introduction of the compass into navigation [in the late Middle Ages]” (Wagner, 1896/1969, p. 701/482).
In the late 19th century, palaeomagnetic models were absent, and the earliest historical records known to Wagner for the Mediterranean region dated to the 16th and 17th centuries. The anticlockwise tilt of coastlines on portolan charts prompted him to mistakenly infer the existence of a westerly magnetic declination in the area before the year 1200, when the supposed original sub-pieces of portolan charts were created. The flaw in Wagner's reasoning, which was shortly after corrected by his doctoral student, Ernst Steger (Steger, 1896), stemmed from a superficial understanding of how maps indicating (misaligned) magnetic north should be created, which is exactly the opposite. Specifically, if there is an easterly tilt of magnetic north and the cartographer is unaware of magnetic declination, mistakenly perceiving the observed (magnetic) north as true and aligning it vertically, the resultant representation of the area will, by definition, exhibit an anticlockwise (westerly) tilt of the same magnitude. A more comprehensive understanding of the phaenomenon is obtained by comparing the anticlockwise tilt of portolan chart coastlines in Fig. 1 with their georeferenced appearance on a modern map on which the convergence of the meridians is not displayed orientated to geographic north in Fig. 3, and the manual anticlockwise adjustment of its georeferenced image to restore its original alignment in the lower part of Fig. 4.
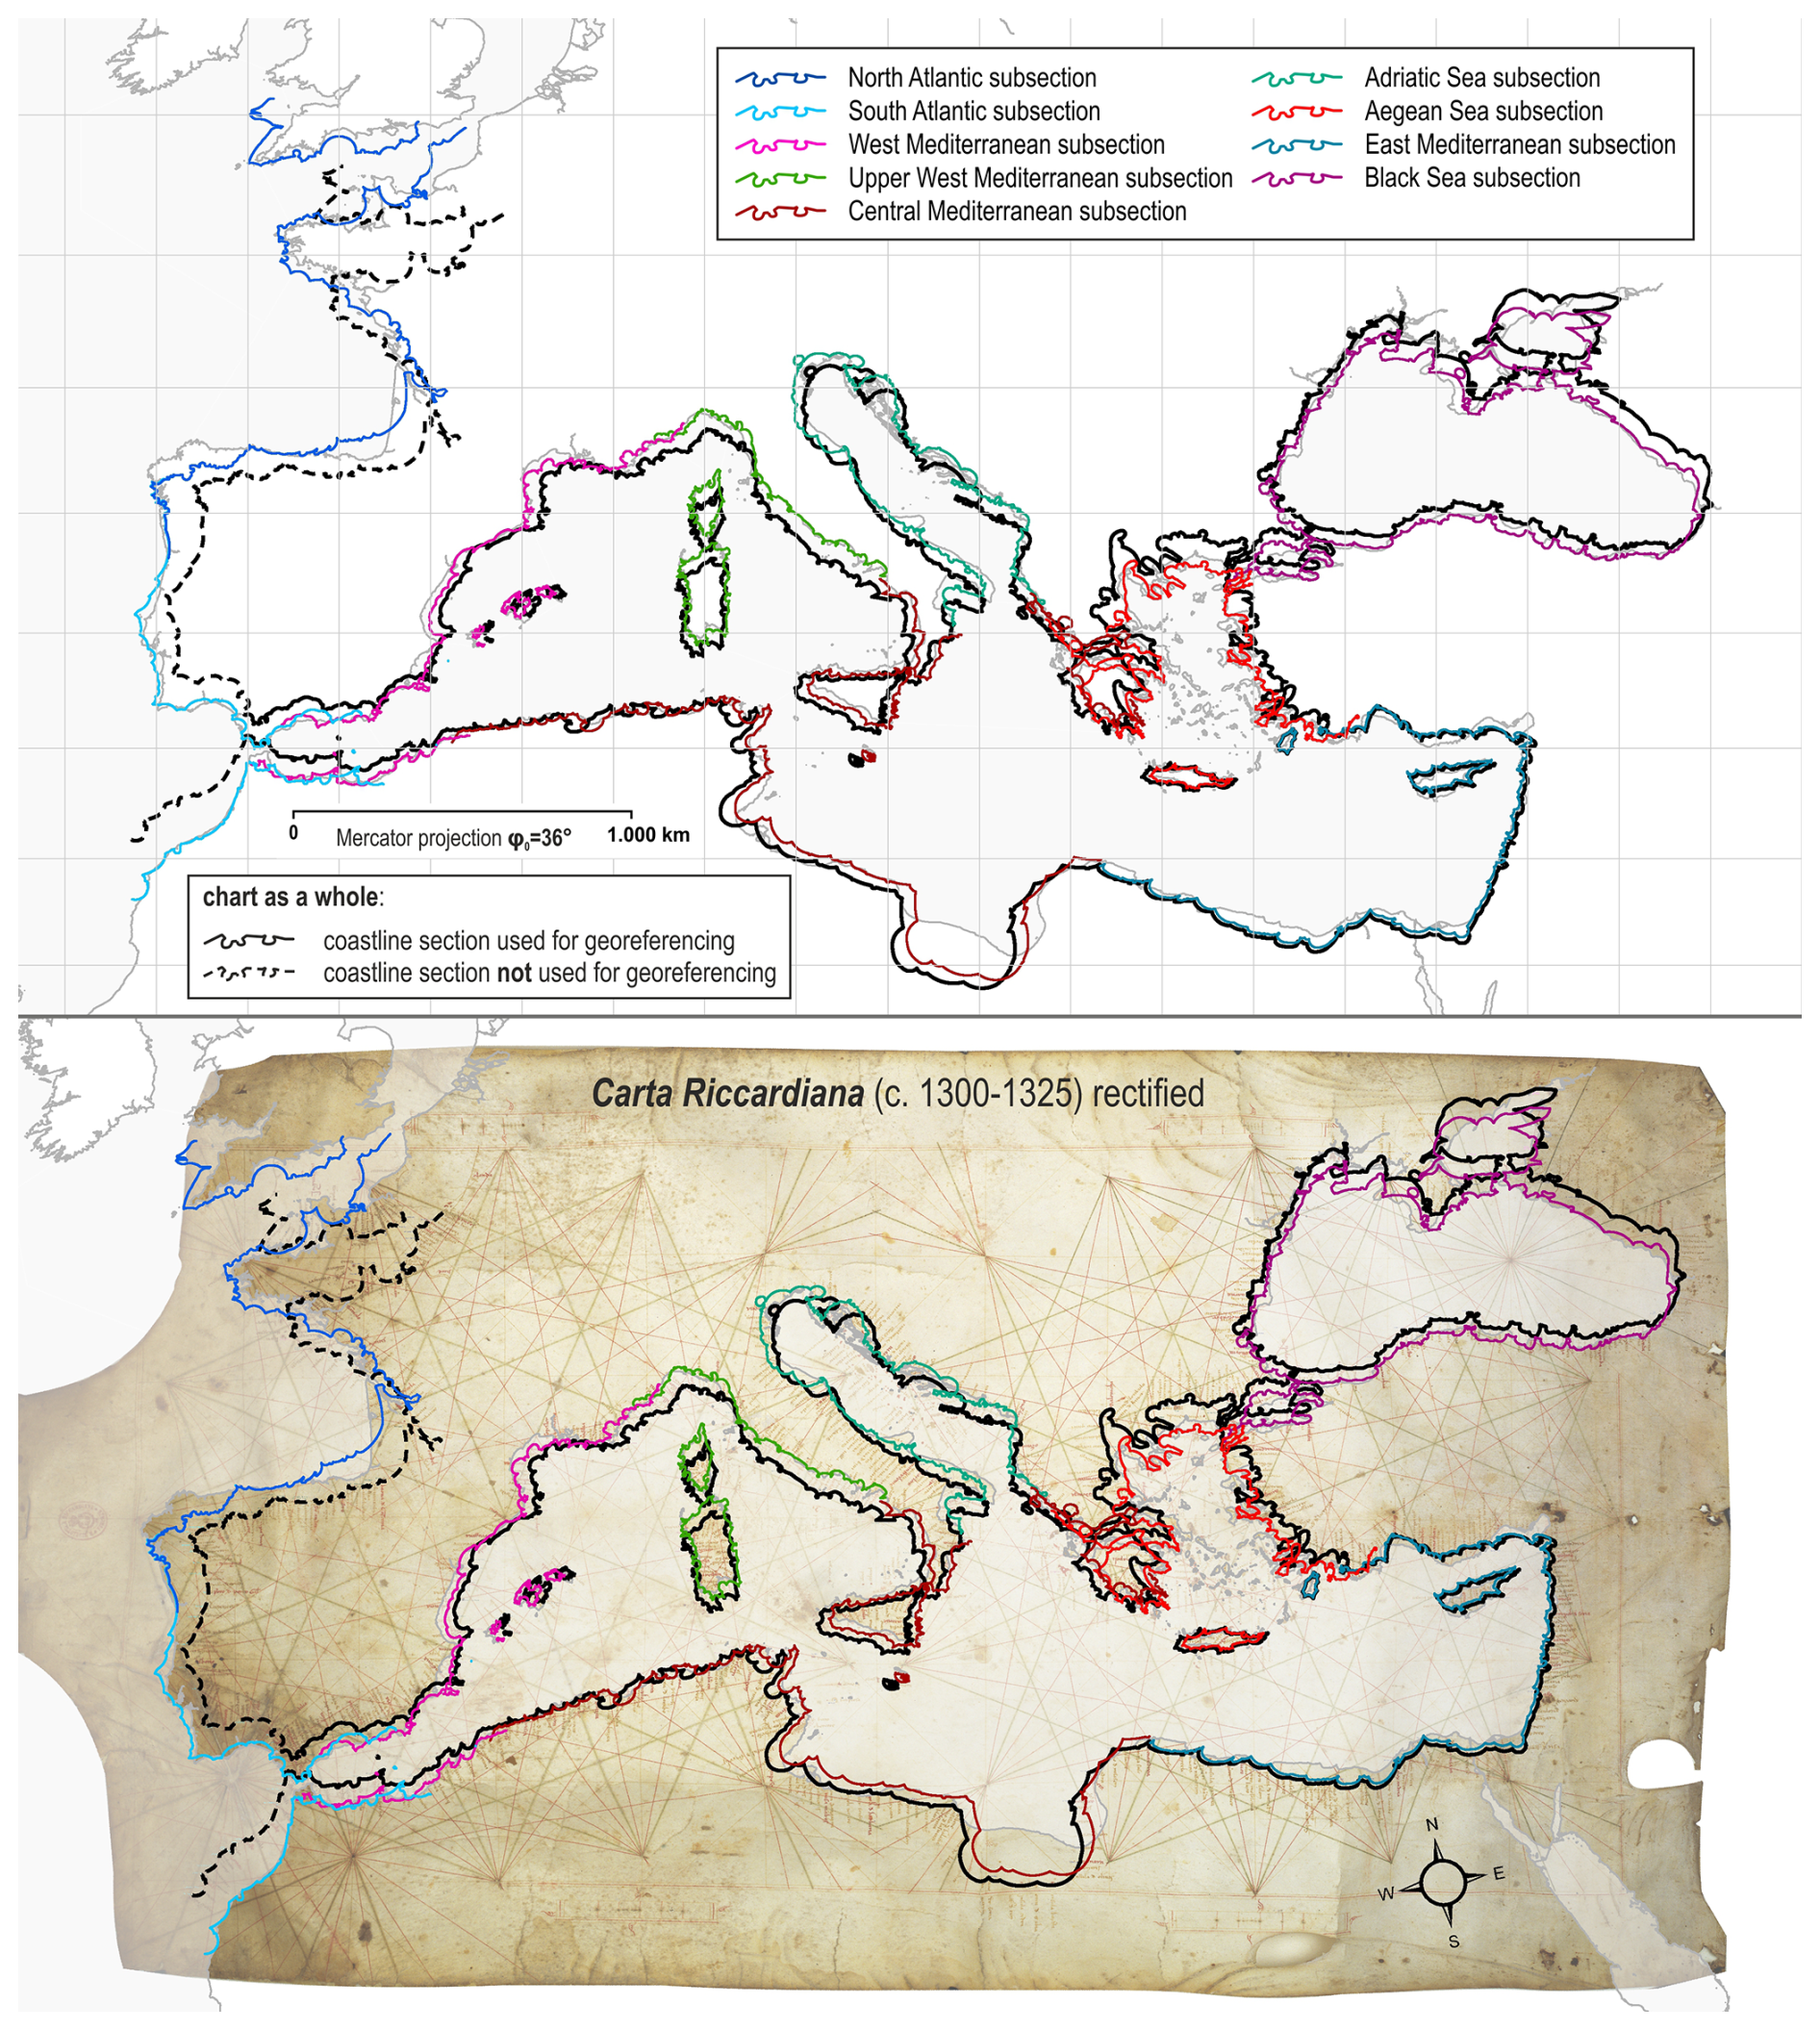
Figure 4Vectorised coastline of the georeferenced Carta Riccardiana (ca. 1300–1325) and its nine cartometrically determined coastline subsections in comparison to a modern Mercator reference map (the upper part), and its rectified image with the reference Mercator map tilted −10.6° (the lower part). Chart source: Biblioteca Riccardiana, Florence, call no.: Ricc. 3827. Basemap shapefile source: http://www.marineregions.org (Claus et al., 2017).
Wagner's concluding remarks regarding portolan charts origins were that late mediaeval Italians pieced together older charts made in the cylindrical projection, simultaneously unaware that parts west and east of Gibraltar were not joined correctly in terms of map scale. His insights initially influenced Max Eckert and Richard Uhden (Uhden, 1935). However, others, particularly those lacking familiarity with his cartometric techniques, failed to acknowledge his significant contributions, including Edward L. Stevenson (1911), Eva G. R. Taylor (1951a, b), and notably, Heinrich Winter (Winter, 1948, 1956).
In the mid-20th century, no substantial quantitative analyses of portolan chart geometry were undertaken, with the exception of Albert Clos-Arceduc's study (1956), which is significant as it concludes that the representations of the Mediterranean and Black Sea regions on portolan charts exhibit geometric similarities to those on the modern conformal cylindrical map projection, first conceptually introduced by Gerard Mercator in his 1569 world map, mathematically articulated by Edward Wright in 1599, and further refined by Henry Bond in 1645 (Keuning, 1955, p. 18; Snyder, 1993, p. 47; Monmonier, 2004, p. 8). Clos-Arceduc conducted straightforward analogue overlays of portolan chart coastlines with contemporary maps, utilising solely their furthest territorial points. He concluded that they were originally made in the Mercator projection but tilted anticlockwise, as late mediaeval cartographers were presumably oblivious to the magnetic declination during their production, particularly since their eastern portions (the Levant region along with the Black Sea) were rendered to a (large) scale that graphically suited it appropriately (Clos-Arceduc, 1956).
5.1 Empirical Map Projections (EMP) modelling
About a decade later, Waldo Tobler, a pioneer in the application of computer technologies in geosciences, validated Clos-Arceduc's concepts by employing computer-assisted quantitative analysis on the geometric properties of Petrus Roselli's portolan chart from 1468 (Tobler, 1966). He also proposed two additional map projection solutions: the oblique Mercator projection and “the oblique magnetic Mercator projection,” in which “the geographical grid [graticule of latitudes and longitudes] would appear distorted in the vicinity of local magnetic anomalies” (Tobler, 1966, p. 358). Tobler's study holds methodological significance as he was the first to derive such conclusions through the calculation of least squares estimation (LSE) between locations on the old map and a modern map, employing a Helmert four-parameter similarity two-dimensional geometric transformation, which permits bidirectional shifts, and uniform scaling and rotation of both axes (Modenov and Parkhomenko, 1965), thereby fully preserving the original geometry of Roselli's portolan chart in relative terms.
A decade later, Tobler proposed a quantitative model labelled empirical map projection (EMP), which, by using regularly spaced coordinates of locations and either orthodromic or loxodromic distances between them as inputs, generates a graphical solution similar to that of a conventional map projection (Tobler, 1977). The paper contains a map of the Mediterranean plotted by preserving loxodromic distances among points, illustrating the convergence of meridians. The only map projection that (partially) preserves loxodromic distances is the loximuthal projection, presented in 1935 by Karl Simeon and termed “loximuthal” by Tobler himself in 1966. It preserves loxodromic distances along straight lines radiating solely from its central point of construction (and no other location on the map), but is not conformal (Snyder and Voxland, 1989, pp. 90–91; Snyder, 1993, pp. 207–208). It appears that the image is a computationally generated compact mosaic of multiple adjacent loximuthal projections of local extents, centred at uniformly distributed input coordinates. Shifting the centre of a loximuthal projection results in loxodromes emanating from the previous centre being plotted as curves; consequently, this composite retains individual loxodromic distances exclusively within smaller “pockets,” rather than across the entire map area.
5.2 Insufficient cartometric and historical evidence supporting the mediaeval origin hypothesis
In the early 21st century Joaquim Alves Gaspar adopted Tobler's EMP model, modified it within his proprietary Empirical Map Projections software, and employed it in his doctoral research, where he quantitatively analysed the transition between the portolan charts of the Mediterranean and Portuguese nautical planispheres (Gaspar, 2010). Some results were partially incorporated into his recent article on the origin of portolan charts (Gaspar, 2023), augmented with additional computations. It posits the mediaeval origin of portolan charts, and his hypothesis is as follows. Gaspar asserts that, potentially centuries prior to the emergence of conventional portolan charts in the 13th century, navigators throughout diverse Mediterranean areas independently recorded notes and coastline sketches based on astronomical observations. The records were purportedly utilised to produce regional nautical charts of smaller extents, which in the twelfth century were amalgamated into a singular coherent image, a proto-portolan chart orientated to geographic north and incorporating a 16-point wind rose, employed by the unidentified Pisan cleric to author the Liber de existencia portolan. Subsequently, the magnetic compass emerged in the Mediterranean and was allegedly promptly employed in two distinct shipborne campaigns, yielding two portolan chart prototypes for the Western Mediterranean, with their coastline anticlockwise tilts differing by merely 1° [despite the cartographers' concurrent inability to accurately synchronise the Atlantic and Eastern regions within the overall representation regarding scale and tilt]. Ultimately, over the subsequent centuries, the typical portolan chart image remained mainly unchanged, while magnetic declination gradually diminished [thereby rendering portolan charts progressively less effective for navigation with the magnetic compass] (Gaspar, 2023, pp. 75, 78–82, 86). Disregarding his omission to acknowledge Nicolai (2014) as the originator of quantitative evidence demonstrating that portolani data were derived from preexisting portolan charts (see Sect. 6.2), this hypothesis is unfounded and self-contradictory for two main reasons, the first being that the study is methodologically deficient and incoherent.
For example, Gaspar measures the angle of a single straight line in the western Mediterranean on portolan charts created between the years 1270 and 1510, compares them to the paleomagnetic model CALS7k (Korte and Constable, 2005) for the period between 1150 and 1400, and concludes that there were two separate late mediaeval campaigns of shipborne bearing observations, resulting in two distinct portolan chart prototypes, with two subsets differing from one another by an anticlockwise tilt of only one degree (Gaspar, 2023, p. 75). This method, despite completely lacking redundancy in the input data for each chart, entirely overlooks their local geometric inaccuracies, which becomes evident once the charts are accurately georeferenced (see the colour-coded displacement vectors of residuals in relation to geographic north in the lower part of Fig. 3). Gaspar contends that his EMP model, which allocates an 80 % weight to directions and 20 % to distances, adjusted by the CALS7k, accurately reflects the fundamental geometric characteristics of Angelino Dulcert's chart from 1339. He concurrently recognises that it cannot replicate the scale distortions of its depictions of the Aegean and Black Seas and the entire eastern section of the chart in terms of tilt, as the easterly magnetic declination in the 13th century gradually decreased towards the Levant region (Gaspar, 2023, pp. 78–79), but omits to note that it inadequately portrays the scale of its Atlantic coasts. To address the problem, Gaspar utilises a totally different portolan chart created by Mecia de Viladestes nearly a century later (in 1413) to compute its apparent latitudes, noting the existence of three data clusters with distinctive average characteristics, two of which, located east of Gibraltar, converge at approximately 20° E longitude. Ultimately, he deduces that the discrepancies in scale and orientation signify the presence of differing sources of spatial data, thereby denying the hypothesis that the earliest portolan charts were created through a systematic survey utilising uniform standards for distances and directions across all regions (Gaspar, 2023, pp. 81–82, 85–86). However, the comprehensive cartometric analyses employing advanced methodologies, as elaborated in Sect. 6.1, 6.2, and 6.3 – two of which preceded Gaspar's conduct – consistently demonstrated that portolan charts are composed of sub-parts of comparable planimetric accuracy.
The second reason undermining the credibility of this study is the absence of historical records for validation, relying instead on cartometric analyses and quantitative modelling to substantiate interpretations of the portolan charts' origins. In contrast, the only recorded late mediaeval accounts regarding the origin of spatial data underlying portolan charts, not cited by Gaspar, claim that they were developed utilising sources from classical antiquity (see Sect. 6.3).
During the late 20th and early 21st centuries, three cartometric studies have been conducted by Scott A. Loomer (1987), Roel Nicolai (2014, 2024), and Tome Marelić (2024a, b, 2025a, b), which thoroughly scrutinise the geometry of portolan charts to better understand the origin of their spatial data, though they differ slightly in terms of the analysed historical sources and applied methodology.
6.1 The first in-depth cartometric analysis of portolan charts
Scott A. Loomer's doctoral dissertation (1987) is the first extensive and methodologically rigorous cartometric analysis of portolan chart geometry, in which he georeferenced each of the 26 portolan charts to nine different projections and a trilaterated network of a modern reference map. Prior to analysis, Loomer employed an eight-parameter projective two-dimensional transformation on the (invisible) circles of their wind roses to correct the camera lens perspective of their photo-reproductions and restore them to perfect circles, simultaneously compensating for the potential deformations of the parchment sheets over centuries. He determined that the average deformations were negligible, varying from 0.4 to 2.6 mm (Loomer, 1987, pp. 123, 213–216), subsequently computed the geometry of seven composite charts in accordance with different criteria (all, early, middle, late, Italian, Catalan, and Arab charts) with the weighted averages of the same 359 identical control points per chart (Loomer, 1987, pp. 132, 126–131, 210–213), and georeferenced those composites utilising a four-parameter Helmert similarity transformation.
Loomer cartometrically established that the best geometrical fit is achieved in comparison to the Mercator projection, with the second-best solution being the equidistant cylindrical projection φ0 = 40° (Loomer, 1987, pp. 133, 191), after which he divided their coverage into nine sea basins and georeferenced them individually, basin-by-basin, to the Mercator map. He discovered that the planimetric accuracy was greatest for the Western Mediterranean, Tyrrhenian, and Adriatic Sea basins, and poorest for the Black, and Ionian Sea basins, and that each basin exhibits its proprietary anticlockwise tilt and map scale (Loomer, 1987, p. 160). He computed the average tilt of coastlines on portolan charts as a whole of around −10°, with western regions tilted by about −6° and eastern regions about −10° (Loomer, 1987, pp. 163–164). The only paleomagnetic data accessible to him at that time were gathered by Jean Claude Tanguy on Mt. Etna (Tanguy, 1970), positing a 13° easterly declination for the year 1300, which led Loomer to deduce that there is “no indication that the rotation of the portolan charts is related to the magnetic declination present when each chart was drafted” (Loomer, 1987, p. 151).
The concluding remarks of his analysis are that portolan charts are composite charts whose sub-pieces “are based on loxodromic data plotted graphically using course bearings”; that over “almost two hundred years, the charts in the study exhibited very nearly the same degree of correlation to the standard of accuracy employed – the Mercator projection”; and that there is “alternative that the [anticlockwise] rotation [of coastlines] is the result of an overall compensation for the sphericity of the earth” (Loomer, 1987, pp. 166–168). The last remark was originally proposed by James E. Kelley Jr. who came to an idea that trilateral network between parallels of 36 and 45° that starts at Gibraltar and gradually bends northward as the longitude increases with parallels plotted as concentric arcs (akin to conic projections) might explain the geometry of portolan charts (Kelley, 1995, pp. 5–6); a concept that is ultimately extremely important for this article because it inspired its author in the search for a solution to this problem (see Sect. 7.4).
Loomer's research is constrained to a certain extent by three significant limitations: his decision to georeference chart composites with the inclusion of control points along the Atlantic coasts which, because of their substantially smaller map scale, shifted the LSE-positioned images of composites to the northwest and thus decreased their overall planimetric accuracy levels; his a priori adoption of historian Fernand Braudel's sea basin delineations (Braudel, 1972); and his exclusive use of a single equidistant cylindrical projection that preserves true scale at 40° latitude.
6.2 Cartometric rebuttal of late mediaeval origin hypothesis
Roel Nicolai's doctoral dissertation (2014), subsequently published in a book (Nicolai, 2016), in which he cartometrically analysed five portolan charts and numerical data from the Compasso de Navegare portolan from the late 13th century is another example of meticulous quantitative approach to the merit. The thesis provides a comprehensive historical overview of late mediaeval scientific and technological achievements related to navigation and cartography, and refutes the four fundamental principles of the mediaeval origin hypothesis: the existence of the “mathematical seaman” in the late Middle Ages; the possibility that averaging had improved accuracy of distances (and bearings); that portolan charts were constructed by plane charting technique, that is, by neglecting the Earth's surface curvature (as D'Avezac had suggested); and the possibility that any map projection solution derived from the georeferencing of the charts could be apparent or accidental (Nicolai, 2014, p. 350, note 599). One of the most important findings of this study is that his cartometric analysis of the numerical data on bearings and distances from the Compasso de Navegare portolan undoubtedly demonstrates that they were actually scaled off from an already existing portolan chart (Nicolai, 2014, pp. 347–348); a concept originally proposed by Kelley Jr. (Kelley, 1995, pp. 9–10) without empirical testing, that contrasts the mediaeval origin hypothesis which contends that the charts were constructed using portolani textual data. His concluding remarks are that “portolan charts are sophisticated, accurate charts, intentionally constructed on the Mercator or the equidistant cylindrical map projection; that the geodetic and cartographic origin of portolan charts does not lie in mediaeval Europe; and that the origin of the charts in Arabic-Islamic culture is highly unlikely” (Nicolai, 2014, p. 410). The biggest methodological distinctions between Nicolai's and Loomer's approaches to georeferencing portolan charts are that Nicolai used a six-parameter affine transformation and statistically determined the division of typical portolan chart coverage into sub-charts of formidable planimetric accuracy rather than using an a priori subbasin division.
A six-parameter two-dimensional affine transformation allows bidirectional shifts, as well as individual scaling and rotation of each axis of the georeferenced unit (Modenov and Parkhomenko, 1965). Although it is typically successful in rectifying map sheet deformations when the geodetic parameters of the old map or chart are precisely known, it also presents certain ambiguities when employed for assessing their yet-to-be-discovered map projection characteristics due to data-overfitting, as the transformation partially adjusts (i.e. deforms) the original geometry of the old map to align it more closely with the geometry of the reference map. Namely, if the discrepancies in their geometries are excessive, independent scaling may distort the old map or chart along one axis to the extent that its original geometry is substantially or entirely obliterated. In the examination of sub-charts from portolan charts, which were supposedly originally produced using geodetically defined methods and map projection principles, a notable elongation along the X-axis, for example, may indicate that either the relative longitudinal compression was pre-existing and that the charts were accurately replicated, or that the original maps were drawn completely accurately, but the reproductions became accidentally compressed longitude-wise during copying due to the late mediaeval cartographers' insufficient comprehension of the geodetic and cartographic principles underlying the original maps. Furthermore, although a two-dimensional affine transformation is responsive to differences between the equidistant cylindrical and the Mercator projection – given that the latter exhibits increasing spacing of parallels towards the poles – the independent linear scaling along the X and Y axes prevents it from detecting differences in planimetric accuracy values when iteratively georeferencing the same portolan chart to a reference plane in distinct equidistant cylindrical projections with varying standard parallels. It is because these projections maintain uniform spacing of parallels, and as the latitude of the true-to-scale parallels increases, it magnifies the longitudinal compression of their rectangular graticules. Consequently, the independent linear scaling of the X and Y axes yields equal magnitudes of axial residuals (of planimetric errors) when transforming the image from one rectangle to another, irrespective of their side ratios. In other words, regardless of the chosen equidistant cylindrical projection for georeferencing, an affine transformation will produce identical outcomes.
The boundaries of the sub-charts in Nicolai's study were computationally calibrated by iteratively applying statistical analysis to the georeferenced datasets and excluding outlier control points until their histograms closely approximated the theoretical curves of the standard normal error distribution (Nicolai, 2014, pp. 211–243). This method is particularly effective in filtering out points obtained from historically documented field surveys that conflict with the established geodetic and cartographic reference framework. However, in the analysis of control points on portolan charts, its use would be justifiable only if the copying of coastline contours from the original charts or maps had been executed with complete fidelity, which is unlikely to have occurred. Since the coastline contours on portolan charts originate from a single source – the human hand of a mediaeval draughtsman, which is subject to random, not systemic errors – the author contends they should not be treated the same way as points derived from systematic geodetic surveys, and that all identified identical (control) points on the portolan chart should be retained within the sample, or at the very least, both scenarios should be conducted concurrently. Otherwise, it is impossible to differentiate between the actual and filtered planimetric accuracy of manuscript charts and their individually georeferenced portions. For more information regarding the development of copying-techniques used to duplicate portolan charts, see Šima Krtalić (2022)'s article.
Nicolai's latest article examines five additional portolan charts, statistically assesses the extents of sub-charts from all ten analysed charts, and employs a five-parameter affine transformation that permits individual scaling of each axis while uniformly rotating both of them (Nicolai, 2024). A considerable amount of the paper is devoted to refuting the mediaeval origin perspectives and Gaspar's quantitative methodology and rationale. A notable highlight of the article is Nicolai's cartometric evidence indicating that the bearing and distance data derived from the Liber de existencia riveriarum, the earliest known portolan, possesses numerical accuracy comparable to that of the Compasso de navegare. The primary distinctions are that the Liber bearing data utilises a 16-point wind rose resolution, in contrast to the 32-point resolution of the Compasso and portolan charts, and that, unlike the Compasso and known portolan charts, the bearings from the Liber appear to be aligned with true geographic north, devoid of anticlockwise tilt. These findings prompted him to conclude that the Liber bearing data was derived from an earlier portolan chart featuring a 16-point wind rose and coastlines orientated towards geographic north (Nicolai, 2024, pp. 639–642).
6.3 Classical antiquity origin hypothesis supported by historical evidence
In recent years, Tome Marelić has conducted a comprehensive study of portolan charts, portolan atlases, and other historical documents relevant to the emergence of nautical cartography in the Mediterranean region, with results published so far in four articles (Marelić, 2024a, b, 2025a, b). It comprises the first-ever cartometric analysis of some portolan charts (the anonymous Cortona, Lucca, Avignon, and Rex Tholomeus charts, and Pietro Vesconte's chart from 1311); three portolan atlases (Pietro Vesconte's atlas from 1313, Andrea Bianco's atlas from 1436, and Battista Agnese's atlas from 1538); and Qutb al-Din al-Shirazi's matrix of 40 × 30 square cells from 1282, which features crudely shaped coastlines that closely resemble those rendered on the Pisane and Cortona portolan charts. The primary methodological distinctions between this study and those conducted by Loomer and Nicolai are as follows: he employed a four-parameter Helmert similarity two-dimensional transformation for georeferencing charts to a modern Mercator map, similar to Loomer; he executed his subsection division cartometrically akin to Nicolai while preserving all identical control points within the sample, as per Loomer; and subsequent to georeferencing, he de-projected the Euclidean portolan chart residuals into ellipsoidal geometry (akin to Nicolai, though he approximated the Earth as a sphere) and converted them into distances along the longitudinal and latitudinal arcs on the surface of the WGS84 reference ellipsoid of revolution (Marelić, 2025c, pp. 228–235). The research amalgamates a plethora of findings from the cartometric analyses and known historical records, all of which converge at the conclusion that portolan charts and atlases are, in fact, late mediaeval copies of maps or charts that were originally created in classical antiquity.
In general, the study establishes that four known so-called less sophisticated charts (Pisane, Cortona, Lucca, and Avignon) contain portions of coastlines that are profoundly similar to one another and also when compared to Pietro Vesconte's charts (from 1311 and 1313); a discovery implying that they were based on the same source and calls into question the “sophistication” of Vesconte's and later charts (Marelić, 2024a, pp. 142–145; Marelić, 2025b, p. 147). Moreover, it identifies that coastlines of portolan charts are likely made of at least eight coastal subsections that differ in scale and anticlockwise tilt. These subsections have extents that are not in accordance with the morphological subdivision of the Mediterranean Sea; their planimetric accuracy is, on average, twice as great as the renderings of the Mediterranean and Black Sea on portolan charts when treated as a single unit; and the subsectional accuracy of the composite of Vesconte's charts (made in 1311 and 1313), and those of the anonymous Carta Riccardiana (ca. 1300–1325) are the greatest within the sample that chronologically stretches between the late 13th and late 16th centuries (Marelić, 2024a, p. 154; Marelić, 2024b, pp. 605–606). If portolan charts were originally based on authentic and accurate freshly acquired navigational data, newer charts would be more accurate than older ones, but that is not the case. Therefore, these results suggest that those subsections are, in fact, artefacts of earlier-made originals whose copies were initially assembled in the late Middle Ages, and that later cartographers merely copied portolan charts as (already assembled) coherent units.
His analysis of portolan atlases, the first of its kind, originally establishes several important findings. Firstly, the sheets of atlases made by Vesconte in 1313 and Bianco in 1436 cannot be manually assembled into coherent composites when equalising the lengths of their linear scale bars (Marelić, 2025a, pp. 58–60, 67–69, 71), and there are significant local and regional differences between Vesconte's portolan atlas and his portolan chart (1311), as well as between Bianco's atlas and his smaller-scale portolan chart bound in the same atlas (Marelić, 2025a, pp. 62, 64). Secondly, generating a coherent composite image of either of the portolan atlases by georeferencing each sheet individually is not possible (Marelić, 2025a, pp. 61, 63, 66), and their geometry at subsectional level – that remained unchanged over three centuries – exhibits approximately 1.4 times greater planimetric accuracy than the average accuracy of their sheets and two times greater accuracy than their coherent manually pre-assembled composites (Marelić, 2025a, p. 72). Thirdly, the tilt of both the sheets and the subsections of portolan atlases chronologically shows an increasing deviation from the longitudinal distribution of magnetic declination from the period of their creation in such a way that their anticlockwise tilts remained approximately the same across nearly three centuries whereas the magnitude of easterly magnetic declination, derived from the CALS3k.4 paleomagnetic model (Korte and Constable, 2011), gradually decreased (Marelić, 2025a, p. 68). Fourthly, despite Andrea Bianco, an adept galley captain, appearing to comprehend advanced trigonometry – an uncommon skill in the 15th century (Pujades, 2007, p. 464) – numerous geometric discrepancies in his 1436 atlas cast doubt on the legitimacy of Toleta de Marteloio as a credible late mediaeval Western European computational tool for cartographers in the production of portolan charts and atlases (Marelić, 2025a, p. 74). To summarise, if portolan atlases were first created given newly acquired navigational data, they would exhibit greater internal coherence and improved alignment with the magnetic declination values of their time; however, this is not the case. Each portolan atlas is merely a differently “sliced” portolan chart image, with sheet extents that do not align with their subsectional divisions. This suggests that both portolan charts and atlases are likely reproductions of earlier originals assembled based on different late mediaeval rationale.
The explicit historical testimonies of classical antiquity origins
This study is the first one that amalgamates three historical records explicitly attributing the origin of portolan charts to classical antiquity. The first historical record is Qutb al-Din al-Shirazi's schematic made in 1282 for which he asserts that it represents a map that was drawn by “the sages of Greece (Yunan) and the ancient geometers” (Savadi and Campbell, 2023, pp. 200–207, 226; Marelić, 2024b, p. 613; Marelić, 2025b, pp. 148–153). The second historical record is the anonymous Rex Tholomeus portolan chart made in circa 1360 (Ruderman et al., 2023; Marelić, 2024b, p. 603) which contains the illustration of a male human figure holding compasses (dividers), next to whom is a paragraph reading that the “records below [the chart itself when orientated south-up] were made according to the works of Rex Tholomeus who measured the world through astrology [astronomy] in length and width and made world maps and cosmographies” (Marelić, 2024b, pp. 613–614). The third historical record is Cotrugli's De Navigatione book written in 1464, in which he states that
… Ptolemy [Ptholomeo] lived in the age of divine Antonino and wrote a marvellous work. He was a great astronomer and [field] surveyor, who put in order and divided units of measurements and proportions of the seas, skies and lands, surveyed everything with the celestial compass and created a world map according to which we [today] have drawn a navigational chart which teaches us to sail and does not allow us to commit errors. … yet we owe him a lot because we do not wander [across the sea] today. Moreover, what the sailors initially did according to chance and their judgment, we have now arranged according to winds and geographical measures (Cotrugli, 1464, pp. 60v–61r; Marelić, 2024b, pp. 613–614).
In addition, this study yields other important insights, including the first ever quantitative explanation that the length of the portolan mile of approximately 1.25 km is rooted in classical antiquity, derived from the square grids in al-Shirazi's records, and on the Pisane and Avignon charts (Marelić, 2025b, pp. 148–157); a subject that is explained in more detail in the Sect. 7.3.
Neither of the sophisticated cartometric analyses that identified sub-pieces of portolan charts, which exhibit slightly increasing tilts towards the east but do not correspond with the longitudinal distribution of magnetic declination in the late Middle Ages, offered a solution that is tangibly disconnected from the magnetic declination. The exception is Marelić's study which, initially inspired by Kelley's concept of a trilaterated network starting at Gibraltar, posits that it may result from a technique utilised by mediaeval cartographers. It suggests that they graphically integrated copies of regional maps in a cylindrical projection, based on Eratosthenes's measurements of the Earth, to reproduce their appearance in a conic projection, orientated such that the meridian intersecting the “beginning of the Mediterranean” (its westernmost point near Gibraltar) is plotted vertically (Marelić, 2024b, pp. 611–613). However, this hypothesis has not undergone empirical testing until this day.
Furthermore, all three studies identified that the sub-components of portolan charts were represented at differing scales, with the Atlantic coasts to the west and northwest depicted at a comparatively smaller scale, while the Aegean and Black Seas to the northeast were illustrated at a relatively larger scale; however, neither study offered a satisfactory explanation. In fact, apart from the assumption that the issue stemmed from late mediaeval cartographers' general ignorance of map projection mechanics, there were no conclusive efforts to address this problem.
Most important of all, the greatest common methodological constraint of all three studies is that the significant geometric agreement between portolan charts and modern maps in the Mercator projection prompted the assumption that the source maps utilised by late mediaeval copyist-cartographers as templates were likely originally created in the conformal cylindrical projection. In other words, the studies more or less explicitly propose that the conformal cylindrical projection may have been developed earlier in history, subsequently forgotten, and later unknowingly “resurrected” during the late Middle Ages, as the cartographers of that period were completely oblivious to its distinctive features.
But what if the Mercator projection is not the most plausible solution, and the facts are more aligned with a cartographically simpler alternative, consistent with earlier human history? The response to this inquiry captivated the author of this article, as – should the concept be substantiated – a positive outcome could substantially improve the understanding of the origin of the portolan charts from classical antiquity, necessitating a practical cartometric test of the hypothesis, exemplified using the anonymous Carta Riccardiana, likely created by Pietro Vesconte (see the upper part of Fig. 3) as a case study.
7.1 The benefit and the deception of the Mercator reference map
The author subsequently observed his previous analyses and began to question the order of cartometrically determined subsections in the western portions of portolan charts, specifically the Atlantic Ocean and the Alboran Sea, for two reasons. The first reason is that on some portolan charts, their North and South Atlantic coasts constitute a singular subsection, whereas on other charts, the area of Cape de São Vicente in Portugal has been designated as a breaking point delimiting their North Atlantic and West Mediterranean subsections (Marelić, 2024b, p. 605–606). The second reason is that all examined charts, regardless of whether their South Atlantic coasts form their North Atlantic or West Mediterranean subsections, demonstrate a relative clockwise rotation of the Alboran Sea, positioning the area of Gibraltar further north. The observations necessitated a revised cartometric analyses of the area to explore alternative solutions, and the western regions on the Carta Riccardiana were georeferenced to a map in the Mercator projection, employing a four-parameter Helmert similarity transformation. As previously, their axial Mercator-residuals (dX, dY in kilometres) were subsequently de-projected to derive their angular offsets (dλ, dφ in degrees) and ultimately translated into distances along the longitudinal and latitudinal arcs on the surface of the WGS84 reference ellipsoid (dLON, dLAT in kilometres) to achieve accurate planimetric values for subsections, represented as their axial root mean square errors (RMSE dLON and RMSE dLAT in kilometres, with the larger of the two used to indicate the planimetric accuracy of georeferenced units; for a comprehensive understanding of the methodology, see Marelić, 2025c, pp. 228–235).
The partially revised analysis yielded a separate South Atlantic subsection that meets the North Atlantic subsection along the west coast of Galicia, present-day Spain, and encompasses the entire Alboran Sea (Fig. 4). The Alboran Sea is, in fact, geometrically coherent with both the South Atlantic and the West Mediterranean subsection, the only difference is that the South Atlantic subsection has been mapped to a slightly smaller scale. In a similar manner, Nicolai analysed Dulcert's 1339 chart and assessed its rendering of the Alboran Sea as “enlarged and stretched, presumably to achieve a more satisfactory fit between the Atlantic South and western Mediterranean sub-charts,” considering it “rather an adaptation of the far western part of the western Mediterranean sub-chart than a separate sub-chart” (Nicolai, 2024, pp. 631–632).
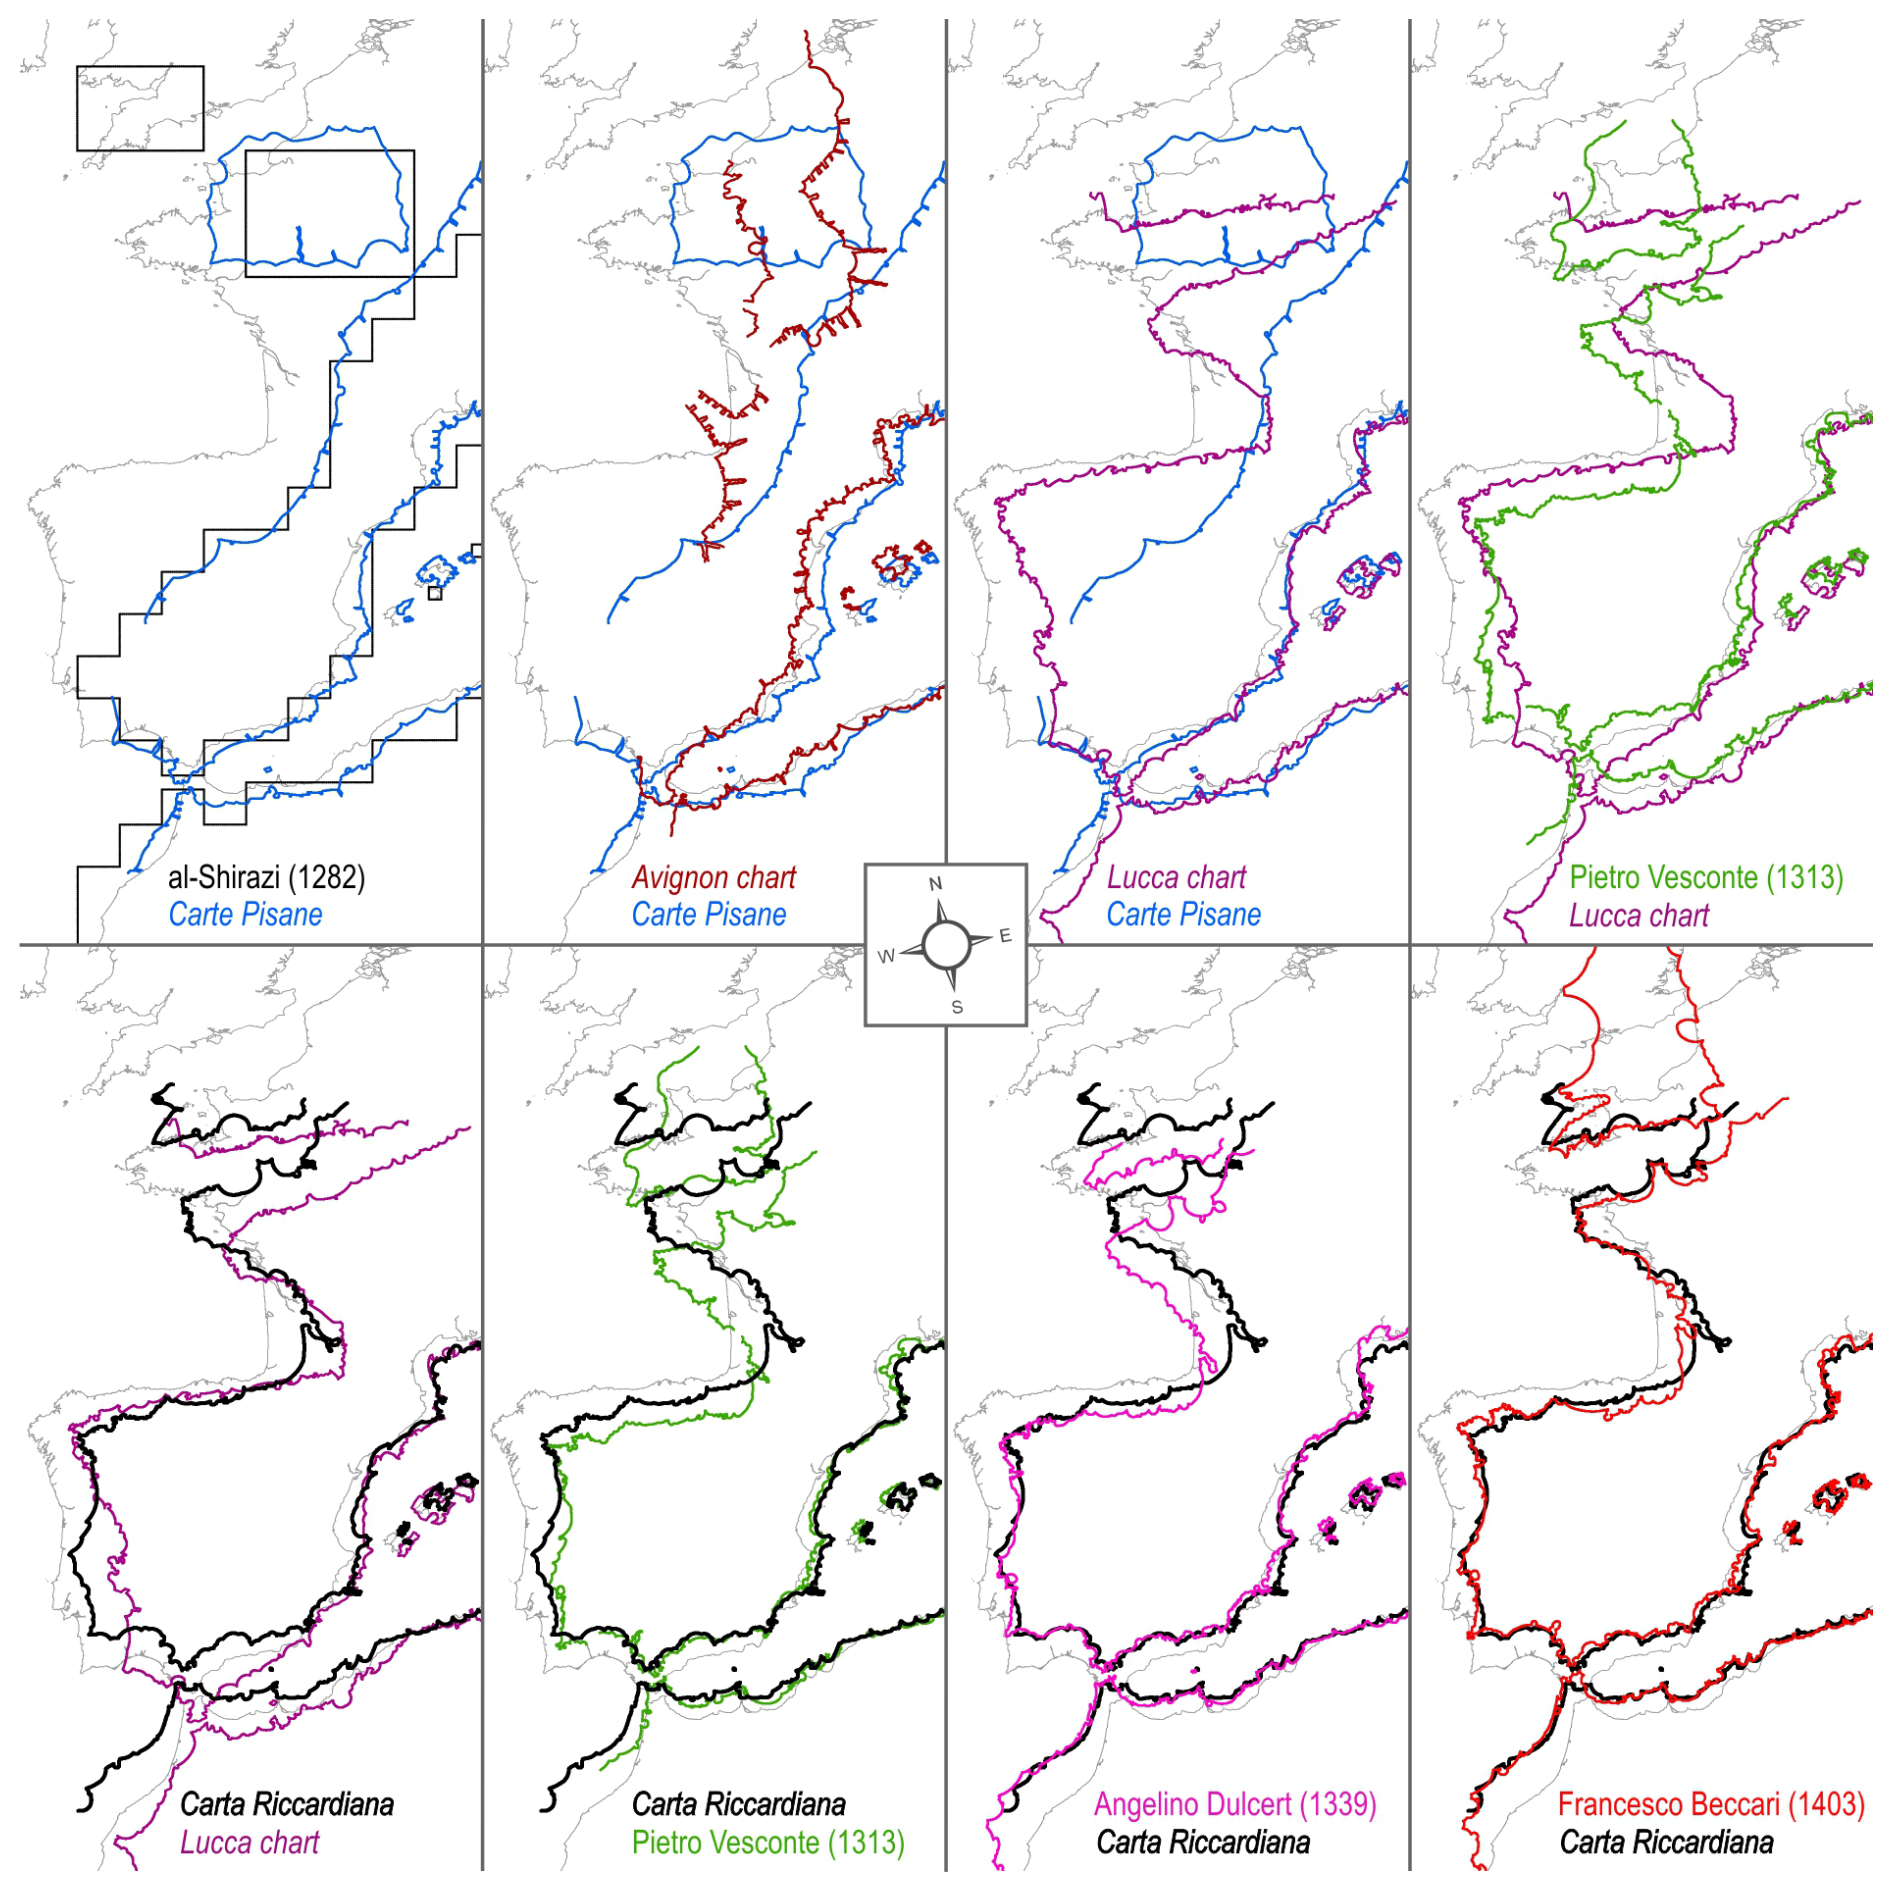
Figure 5The differences in the appearances of the North Atlantic and Alboran Sea coastlines evident in the vectorised renderings of selected portolan charts and al-Shirazi's schematic of a “Greek map,” all of which are georeferenced to a Mercator map across their Mediterranean and Black Sea areas and subsequently tilted −10°. Basemap shapefile source: http://www.marineregions.org (Claus et al., 2017).
The examination of the westernmost portions of early portolan charts and al-Shirazi's account of a “Greek map” (Fig. 5) indicates that the representation of the Alboran Sea experienced multiple alterations. For instance, the Carte Pisane and al-Shirazi's square-cell matrix seem to represent it relatively appropriately, although slightly enlarged in scale, whereas the anonymous creators of the Avignon and Lucca charts have orientated it notably more anticlockwise (with its exit at Gibraltar pointing more to the south), placing the inflection points near Cartagena in contemporary Spain to the north and near Oran in present-day Algeria to the south. In the subsequently produced units, particularly the Carta Riccardiana and the portolan charts of Pietro Vesconte from 1313, Angelino Dulcert from 1339, and Francesco Beccari from 1403, the depiction of the Alboran Sea appears to have been consistently orientated clockwise, with its exit at Gibraltar pointing more to the north across all four analysed charts (Fig. 5). Therefore, Nicolai's assertion that the Alboran Sea functions as the adaptation of the West Mediterranean has been confirmed as plausible.
Nicolai, using Dulcert's 1339 chart as an example, hypothesises the existence of a third Atlantic sub-part, encompassing the northern Iberian coasts of the Bay of Biscay, which he designates as the “Atlantic Mid [sub-chart]” (Nicolai, 2024, p. 631). Nonetheless, it is challenging to ascertain with certainty whether the Atlantic coasts on portolan charts are comprised of more than two components for various reasons. This region is noticeably smaller than the other proposed subdivisions and encompasses only a limited latitudinal range. This suggests a greater likelihood that it served as the transitional area for integrating two datasets, similar to the altered portrayal of the Alboran Sea, which has been adjusted to visually merge the South Atlantic and West Mediterranean subsections more harmoniously. Secondly, and more significantly, the chronological evolution of Atlantic coast representations on portolan charts (Fig. 5) demonstrates that their creators engaged in numerous trial-and-error efforts to portray them accurately, with even the latest-made examined units exhibiting only marginally successful conducts in terms of map scale. The Carte Pisane and al-Shirazi's schematic of a “Greek map” present the Atlantic coasts in an overly schematic and eastward skewed manner, while the Avignon chart portrays more detailed coastline contours, albeit with the overall representation of the Atlantic shifted further south. Next, the Lucca chart, which features Mediterranean coasts nearly identical to those on the Carte Pisane (Marelić, 2025b, pp. 147–149), represents the west and north coasts of the Iberian Peninsula with enhanced accuracy and appropriate map scale, in contrast to its coasts of Normandy and Britain, which are disproportionately compressed in latitude. The earliest accurate graphical representations of the Atlantic coasts are found on the Carta Riccardiana and the chart by Pietro Vesconte, regardless of which was created first. However, Vesconte's 1313 chart, which constitutes the western sheet of his portolan atlas and is more compatible in scale with his 1311 chart of the Central and East Mediterranean and the Black Sea than the other sheets of the atlas (Marelić, 2025a, pp. 58, 62–67), features a significantly smaller map scale of the region. Vesconte's extremely small-scale depiction of the Atlantic was later reproduced by Angelino Dulcert, while the more accurately scaled portrayal of the region, present on the Carta Riccardiana since the early 14th century, was initially duplicated by Francesco Beccari in 1403.
The urge to incorporate a more accurate portrayal of the Atlantic coasts, as opposed to its overly schematic outlines displayed on the Carte Pisane, was likely induced by the increasing frequency of voyages undertaken by Genoese and Venetian trade fleets to England and back, with the first Genoese ships arriving in 1277 and the Venetians not reaching England by ship until 1317 (Ruddock, 1944, p. 194). However, this does not inherently infer that late mediaeval Italian navigators possessed the ability to accurately chart the metrics of their voyages along the European Atlantic coasts. On his 1403 portolan chart, Beccari inscribed that he corrected the map scale of the Atlantic due to sailors' general dissatisfaction with the existing charts (Campbell, 1987, pp. 427–428). Nonetheless, Fig. 5 explicitly shows that the Atlantic coasts had a nearly identical appearance and relative map scale a century earlier, as illustrated in the Carta Riccardiana, suggesting that neither Beccari nor the thousands of navigators before him were genuinely capable of plotting the correct map scale of the Atlantic.
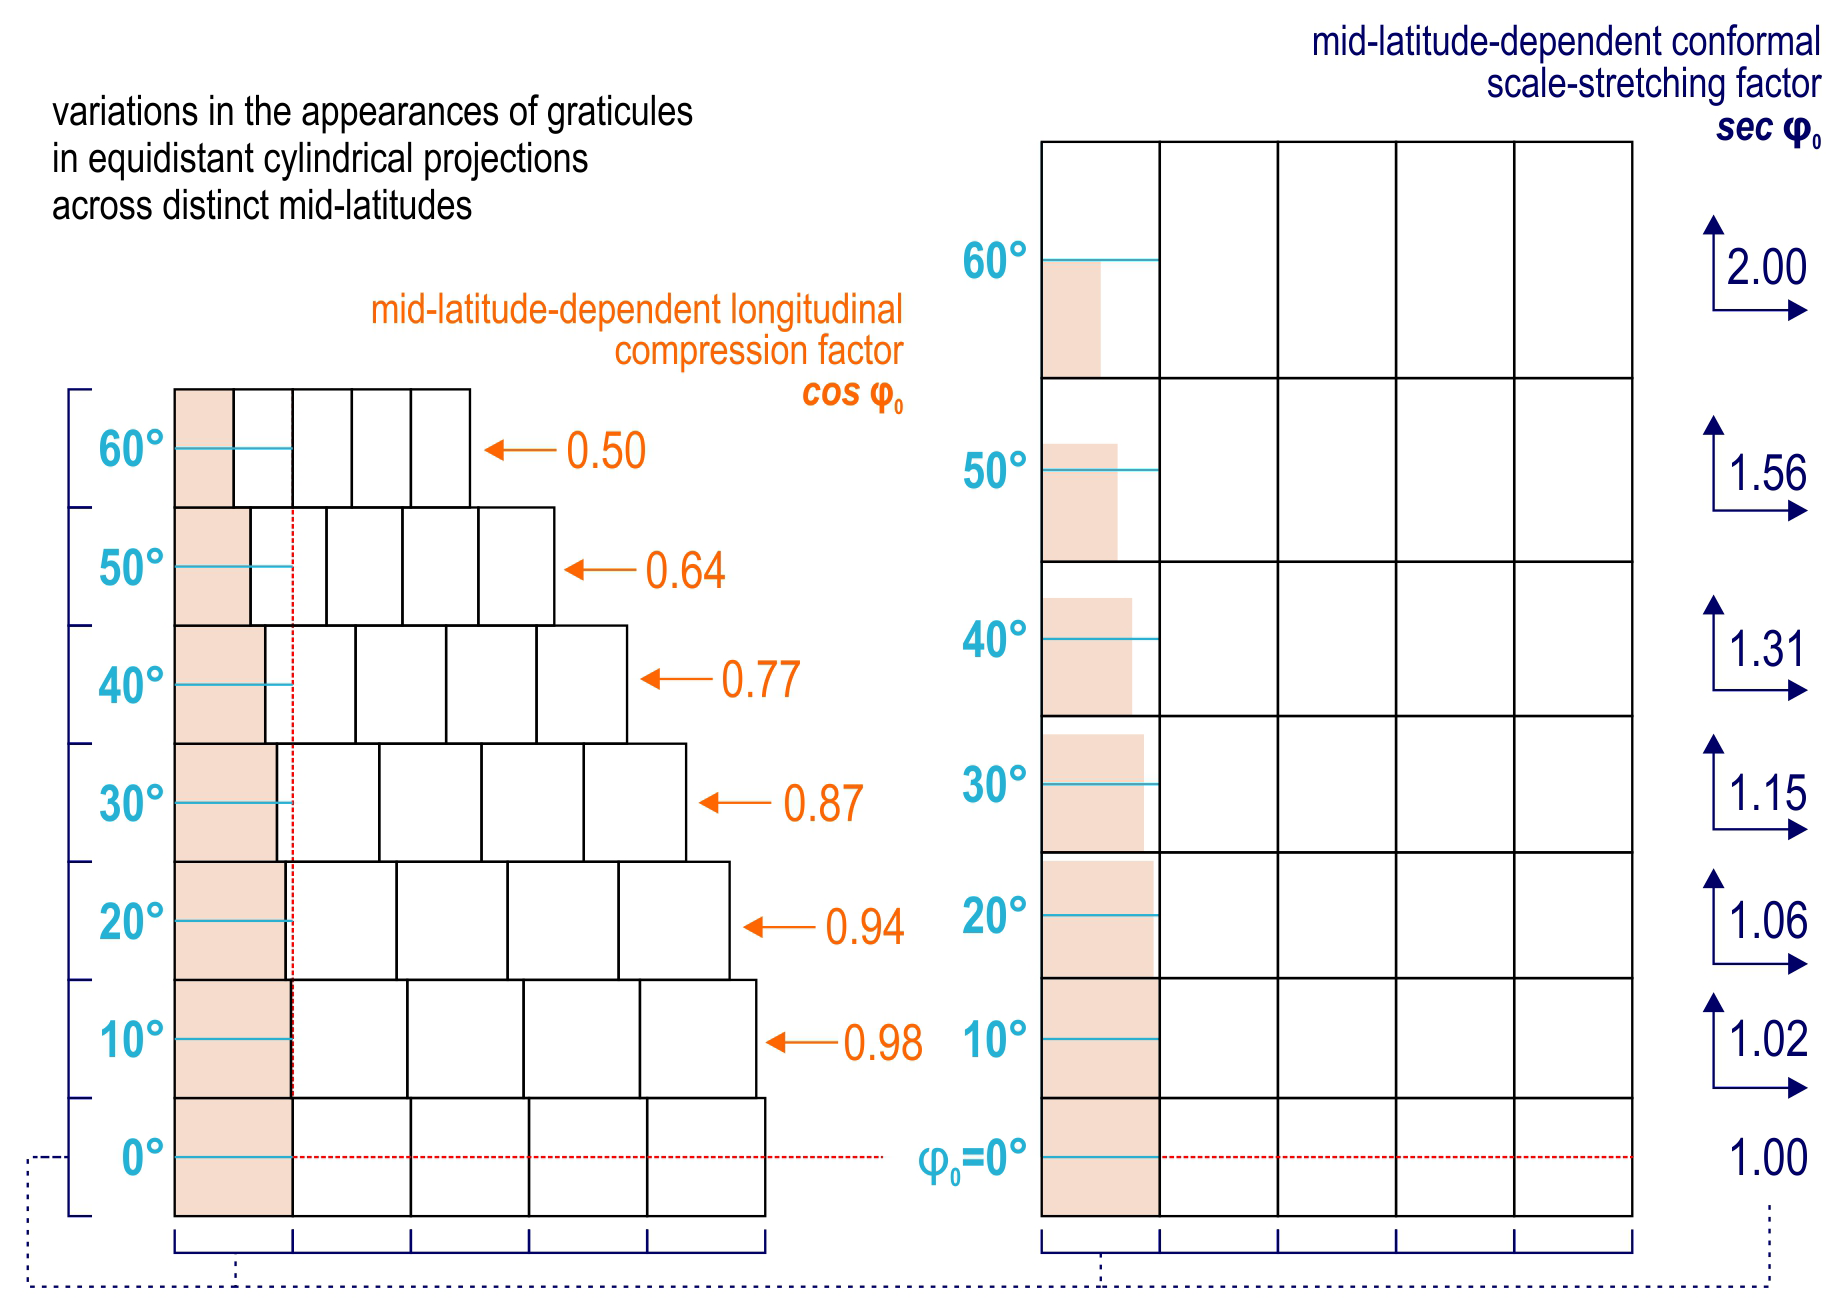
Figure 6A diagram demonstrating how a mosaic of equidistant cylindrical projections of adjacent latitude bands produces a Mercator-like geometry when conformally stretched by the secant of their respective mid-latitudes (sec φ0).
The fundamental conundrum arising from these findings, which previous cartometric studies failed to resolve, is the reason for the Atlantic's representation at a consistently diminished scale. But what if the western regions were not subjected to scale reduction on the original maps, and the perceived scale reduction is, at least in part, a result of deception arising from the use of Mercator projection as a plane of reference? In the initial stages of this study, the author began to question whether the Mercator map is genuinely the optimal solution, and whether a superior fit might be attained through distinct equidistant cylindrical projections tailored to the proprietary mid-latitude of each subsection (pre-determined in comparison to the Mercator projection). It is because the Mercator projection can be perceived as a seamless field of countless infinitesimally narrow bands of equidistant cylindrical projections, each initially compressed longitudinally by a proprietary factor cos φ0, followed by a conformal stretching using a proprietary factor sec φ0. Ultimately, the equidistant cylindrical band at φ0 = 89.9° (nearly at the pole) is longitudinally compressed by a factor of 0.0017 (resulting in a width of merely 0.17 % of the band at the equator) and subsequently conformally stretched by a factor of 572.9, which explains why the Mercator map is typically truncated at lower latitudes. A rudimentary illustration of this concept, featuring only seven latitude bands (each encompassing 10° of latitude), is given in Fig. 6.
7.2 A better geometrical fit to the projection of Marinus of Tyre (first century CE) on a subsectional level
Although the planimetric accuracy of the Mediterranean and Black Seas of the Carta Riccardiana in comparison to the Mercator map of 28.4 km (RMSE dLAT) is noticeably greater than in comparison to the equidistant cylindrical map φ0 = 36° of 34.7 km (RMSE dLAT) when treated as a single unit (Fig. 7), individual georeferencing of its subsections to equidistant cylindrical projections with true-to-scale parallels derived from their proprietary mid-latitudes reveals slightly better overall geometric agreement (Table 1) with the exceptions of the Adriatic and the Black and Azov subsections. A concurrent georeferencing of the Black and Azov subsection to the equidistant cylindrical projection φ0 = 36° (not included in the table) produced RMSE dLON and RMSE dLAT values of 13.02 and 12.74 km, respectively, slightly exceeding those obtained with the Mercator projection. However, the outcomes in comparison to the equidistant cylindrical projection φ0 = 44° exhibit greater internal consistency, as evidenced by their nearly identical RMSE values (see Table 1). Consequently, the author decided to adopt the rationale that it more effectively illustrates the geometry of the original map.
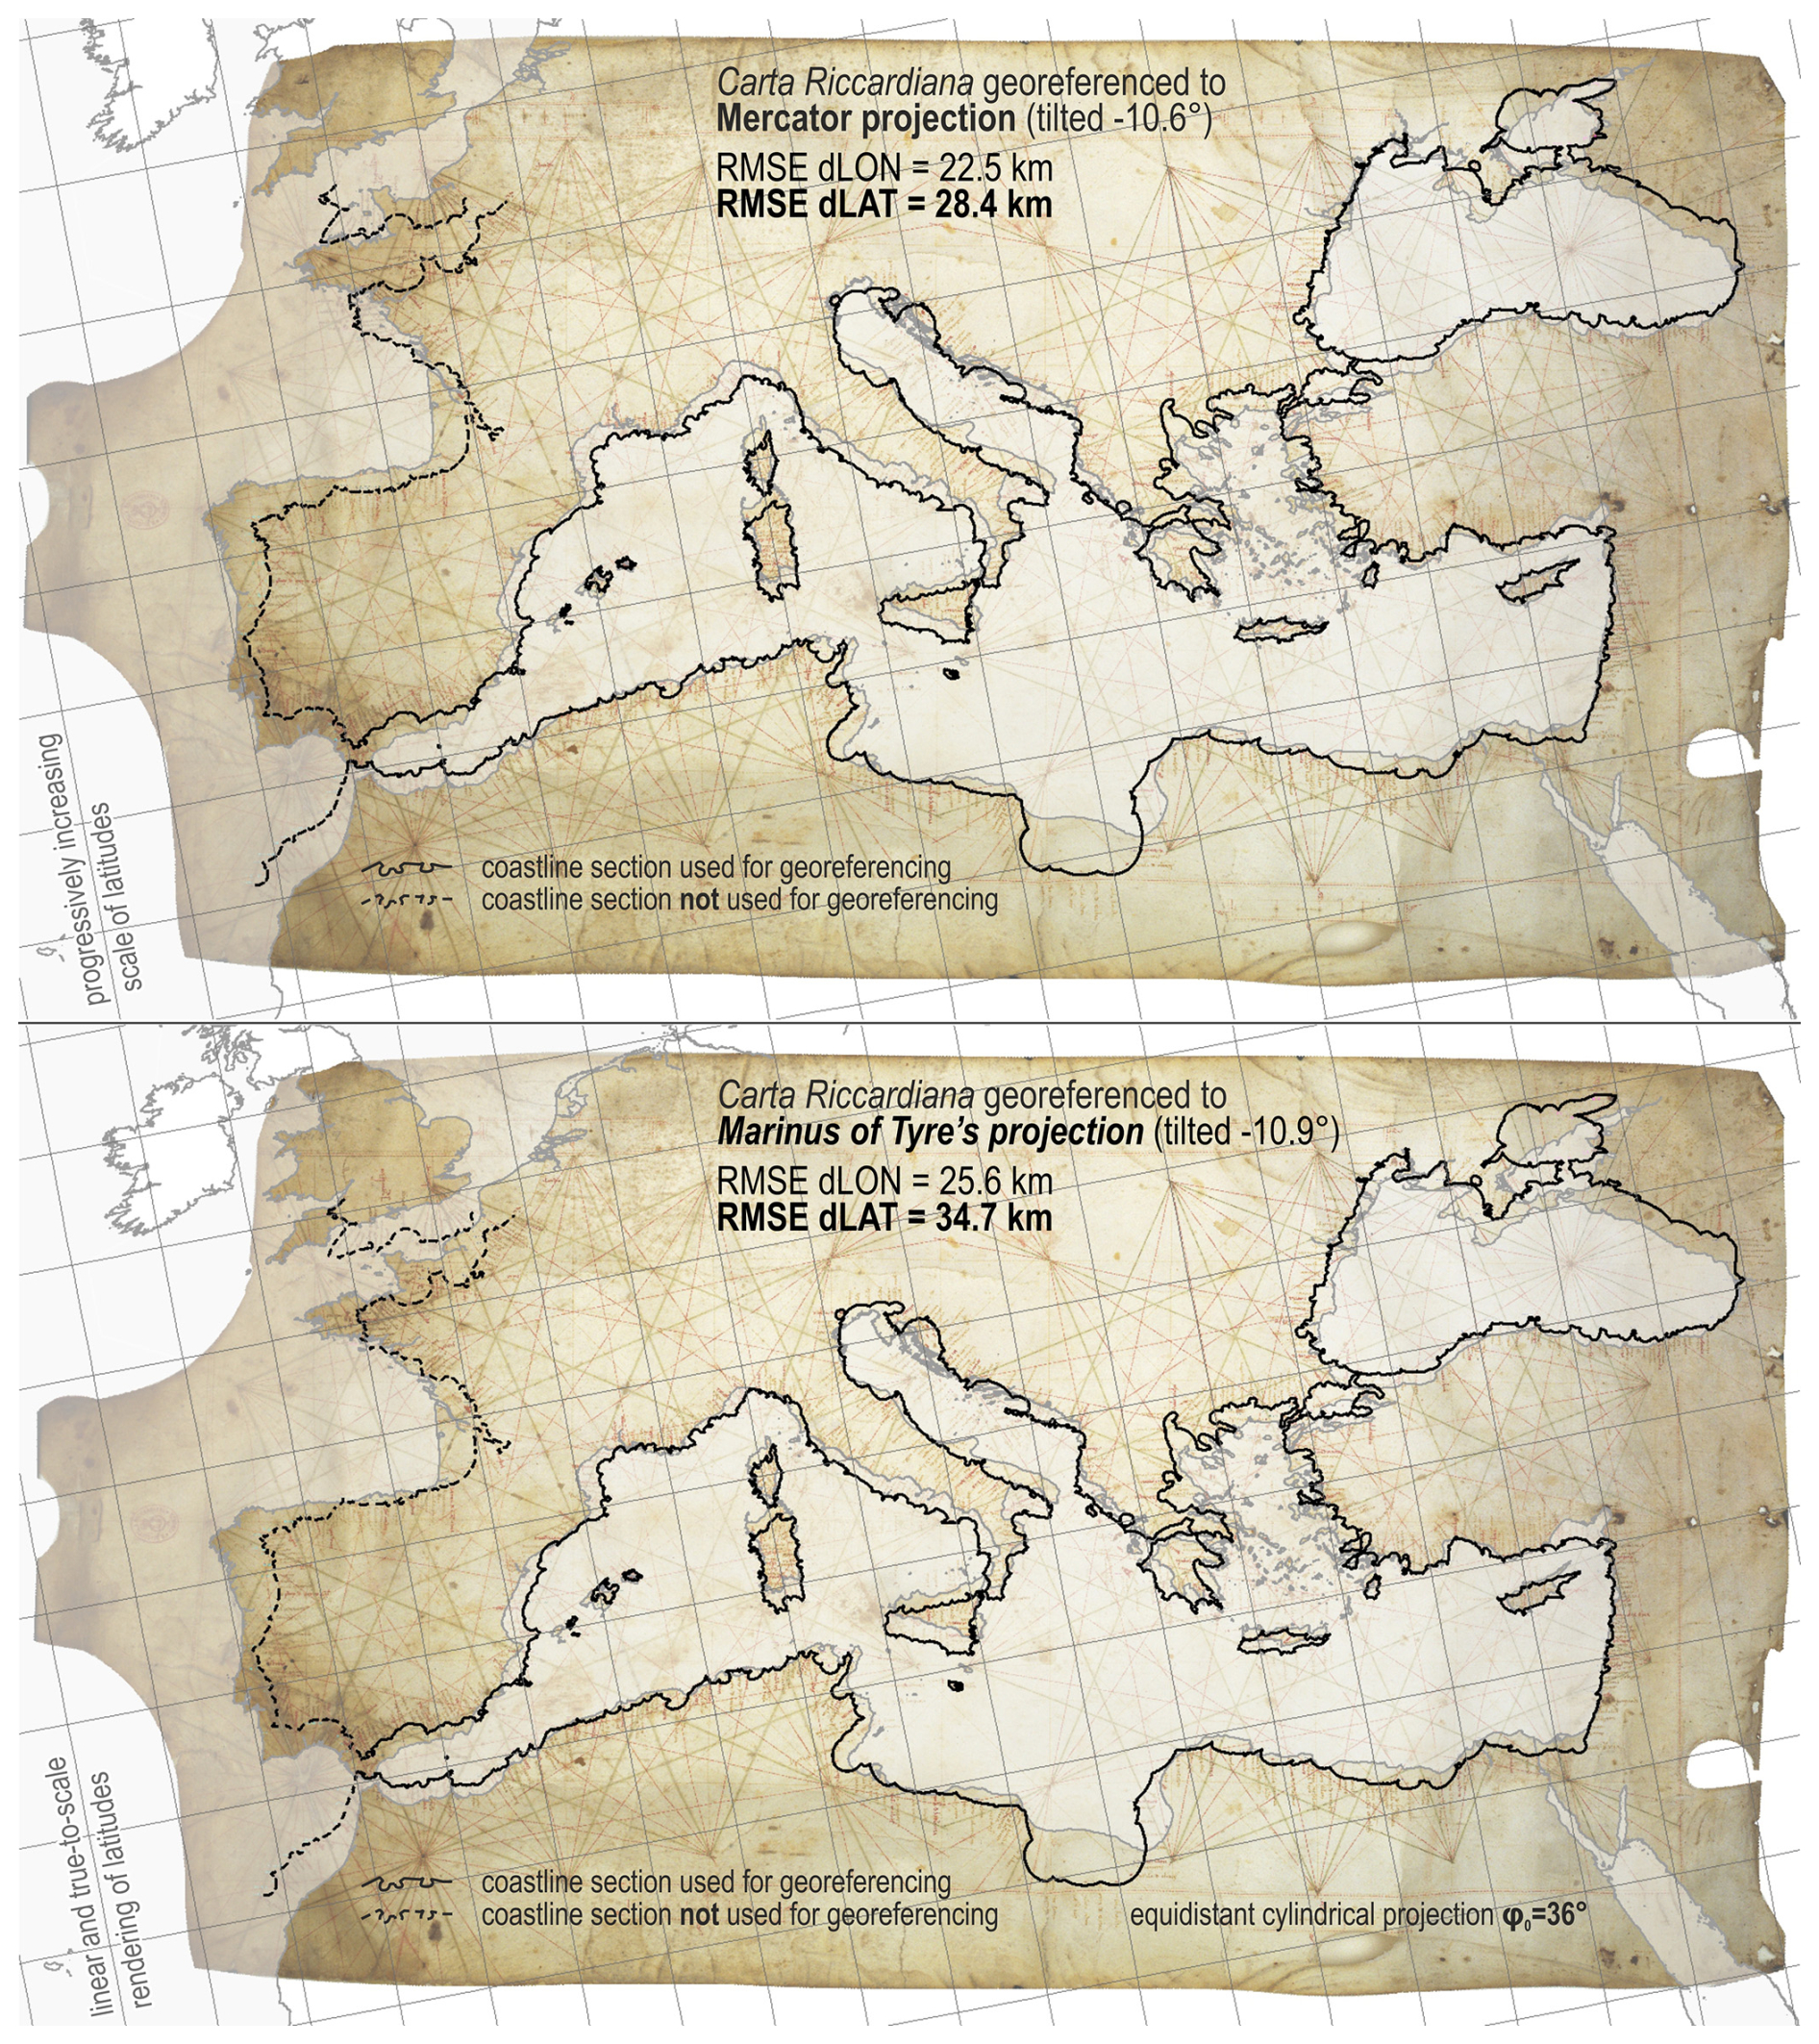
Figure 7Rectified digitised images of the anonymous Carta Riccardiana portolan chart (ca. 1300–1325) georeferenced to a modern map in the Mercator projection (the upper part) and to a map in Marinus of Tyre's projection (the lower part), with their proprietary axial RMSE accuracy levels. The greater of the two values, representing the chart's planimetric accuracy, is put in bold. Chart source: Biblioteca Riccardiana, Florence, call no.: Ricc. 3827. Basemap shapefile source: http://www.marineregions.org (Claus et al., 2017).
Table 1The RMSE planimetric accuracy (in bold) of nine cartometrically determined subsections of the Carta Riccardiana in comparison to a modern map in the Mercator projection, and in the distinct equidistant cylindrical projections. Smaller RMSE values per projection indicate greater planimetric accuracy of a georeferenced unit and vice versa.
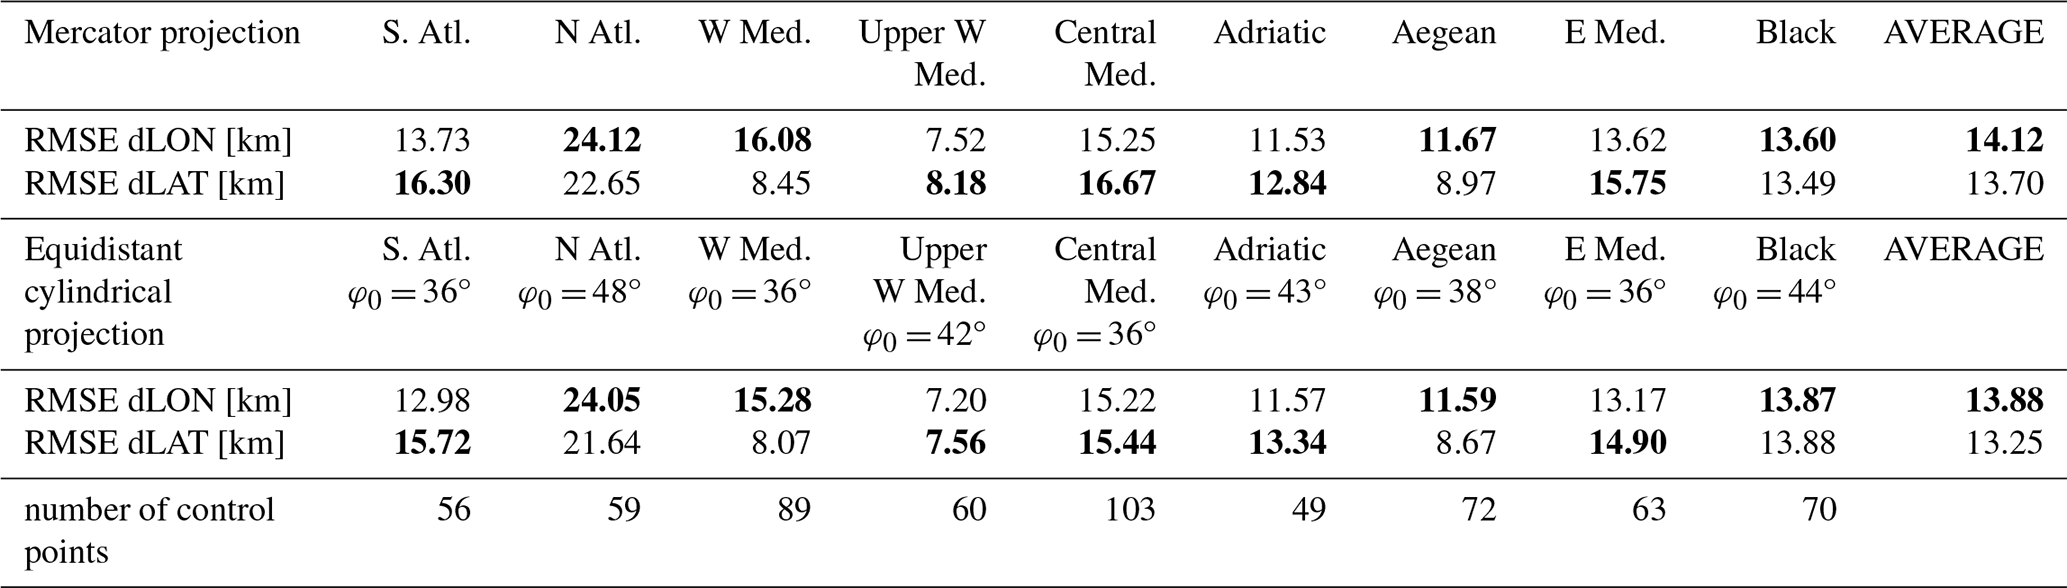
These results suggest that the subsections of the Carta Riccardiana are rendered more simplistically latitude-wise; that is, that their geometry is, in most instances, not slightly compressed towards the equator and slightly stretched towards the north pole. Simultaneously, they refute the anachronistic hypothesis that conformal cylindrical projection or something akin to it existed previous to the early modern period.
They also represent an embryonic stage of the author's conjecture that portolan charts may be mosaics of regional maps or charts whose geometries were established in classical antiquity and attributed to Marinus of Tyre from the first century CE (Keuning, 1955; Snyder, 1993), which were graphically manipulated by late mediaeval copyist-cartographers to create a coherent image that partially resembles the portrayal of the oikoumene on another renowned classical antiquity map, more specifically the one in equidistant conic projection, initially proposed by Claudius Ptolemy in the first and second centuries CE (Snyder, 1978; Berggren and Jones, 2000). This hypothesised outcome necessitates specific scaling and rotation of the regional maps, as the graticules of their equidistant cylindrical projections would exhibit different appearances, and, in contrast to the overall map in the conic projection, they do not display the convergence of the meridians.
To empirically evaluate the hypothesis, a modern reference map was divided into segments in accordance with the subsection extents of the Carta Riccardiana; each of the nine segments was projected according to its optimal equidistant cylindrical map projection (see the lower half of Table 1). Subsequently, four segments that portray the regions along the north coasts of the Mediterranean, inclusive of the Black and Azov Sea segment, were conformally enlarged, and the whole assembly was consecutively tilted in accordance with their LSE-computed rotations. Ultimately, the coastline renderings of the Carta Riccardiana were concurrently compared to the geometry of the modern Mercator map and that of the proposed late mediaeval assemblage, with the latter demonstrating a superior fit. The subsequent sections of this article provide a detailed explanation of each methodological step of the empirical testing, contextualised within the scientific and technological frameworks of classical antiquity and the late Middle Ages.
7.3 Graphical scale-adjustments of distinctive rectangularly gridded sheets
In his overview of the navigational practices during the late Middle Ages, Nicolai contends that it is difficult to reconstruct how distances travelled by sailboats were measured due to the absence of preserved records on the subject, noting that the earliest documented observations of ship speed and distances sailed occurred only in the 16th and 17th centuries, employing methods known as the Dutchman's log and the English log (Nicolai, 2014, pp. 130–131). Furthermore, he asserts that even if highly optimistic assumptions about achievable navigation accuracy and data-processing capabilities were made, the actual accuracy of sailing traverses – whose distances and bearings could allegedly have been acquired and used to create the charts – significantly lags behind the accuracy demonstrated by the portolan charts, and that they cannot have been constructed using plane charting technique (Nicolai, 2014, pp. 380–383), which proponents of the late mediaeval origin hypothesis claim was systematically employed by mediaeval sailors to compile the spatial data for portolan charts. Therefore, it appears implausible that European cartographers of the late Middle Ages had access to genuine shipborne observations of distances between coastal sites, and even if they did, they certainly lacked the knowledge of how to accurately project distances from the Earth's spherical surface onto the flat geometry of charts, as tangibly demonstrated by the metric components they integrated into their cartographic products. The coastlines depicted in al-Shirazi's “Greek map” and the Carte Pisane do not align with those on the plate carrée projection featuring a graticule made of squares (Marelić, 2025b, p. 153) and their quadrilateral grids are not longitudinally compressed by a factor of 0.8 (or 4 : 5; the ratio of the circumference of the φ = 36° parallel to that of the equator), suggesting that al-Shirazi and the anonymous author of the Carte Pisane were erroneously convinced that distances on the charts were accurately represented in all directions. In fact, a detailed examination of the scale bars on portolan charts strongly indicates that those copyist-cartographers shared a common conviction, as evidenced by the diverse alignments of the scale bars they rendered. The creators of the Pisane, Cortona, and Avignon charts represented scale bars as encircled; Pietro Vesconte depicted a cross-shaped scale bar on his 1311 chart; while Gratiosus Benincasa arranged scale bars diagonally, bevelling all four corners of his 1466 chart. These examples collectively demonstrate that the distances on portolan charts were mistakenly perceived by their authors as omnidirectionally accurately preserved across the entire chart field, even in the mid-15th century (see Fig. 2).
The author's previous cartometric analysis of al-Shirazi's 40 × 30 matrix of a “Greek map” and the Pisane and Avignon charts – the only known artefacts of that kind containing square grids – showed that the lengths of their squares (after artefacts were georeferenced to a Mercator map φ0 = 36°) constitute approximately 125 km along the parallel φ = 36°, corresponding to 100 portolan miles; and that the square grid of al-Shirazi's “Greek map” begins near the Canary Islands (Marelić, 2025b, pp. 148–153). The archipelago was considered the westernmost limit of the known world (oikoumene) in classical antiquity, while the latitude φ = 36°, which is about mid-latitude of the Mediterranean, is known to be used by Marinus of Tyre and Claudius Ptolemy as true-to-scale parallel for constructing equidistant cylindrical and conic maps (Snyder, 1993, pp. 5–7, 10–11; Berggren and Jones, 2000, pp. 14, 31–37). Moreover, the squares' side lengths of 125 km equate to a two-degree longitudinal arc along the parallel φ = 36° based on Claudius Ptolemy's erroneous estimation of the Earth's circumference of 180 000 stadia (approximately 29 000 km), which is roughly 1.4 times smaller than the accurate measurement of 252 000 stadia, or 40 000 km, previously calculated by Eratosthenes in the third century BCE (Dilke, 1985; Russo, 2004, p. 273; Marelić, 2025b, pp. 152–153). In summary, 50 portolan miles, the standard large interval (spatium) on portolan chart scale bars, corresponds to the length of a 1° arc along the parallel φ = 36°, based on Ptolemy's erroneous estimation of the Earth's dimensions, strongly indicating that the earliest portolan chart copyist-cartographers had access to classical antiquity sources.
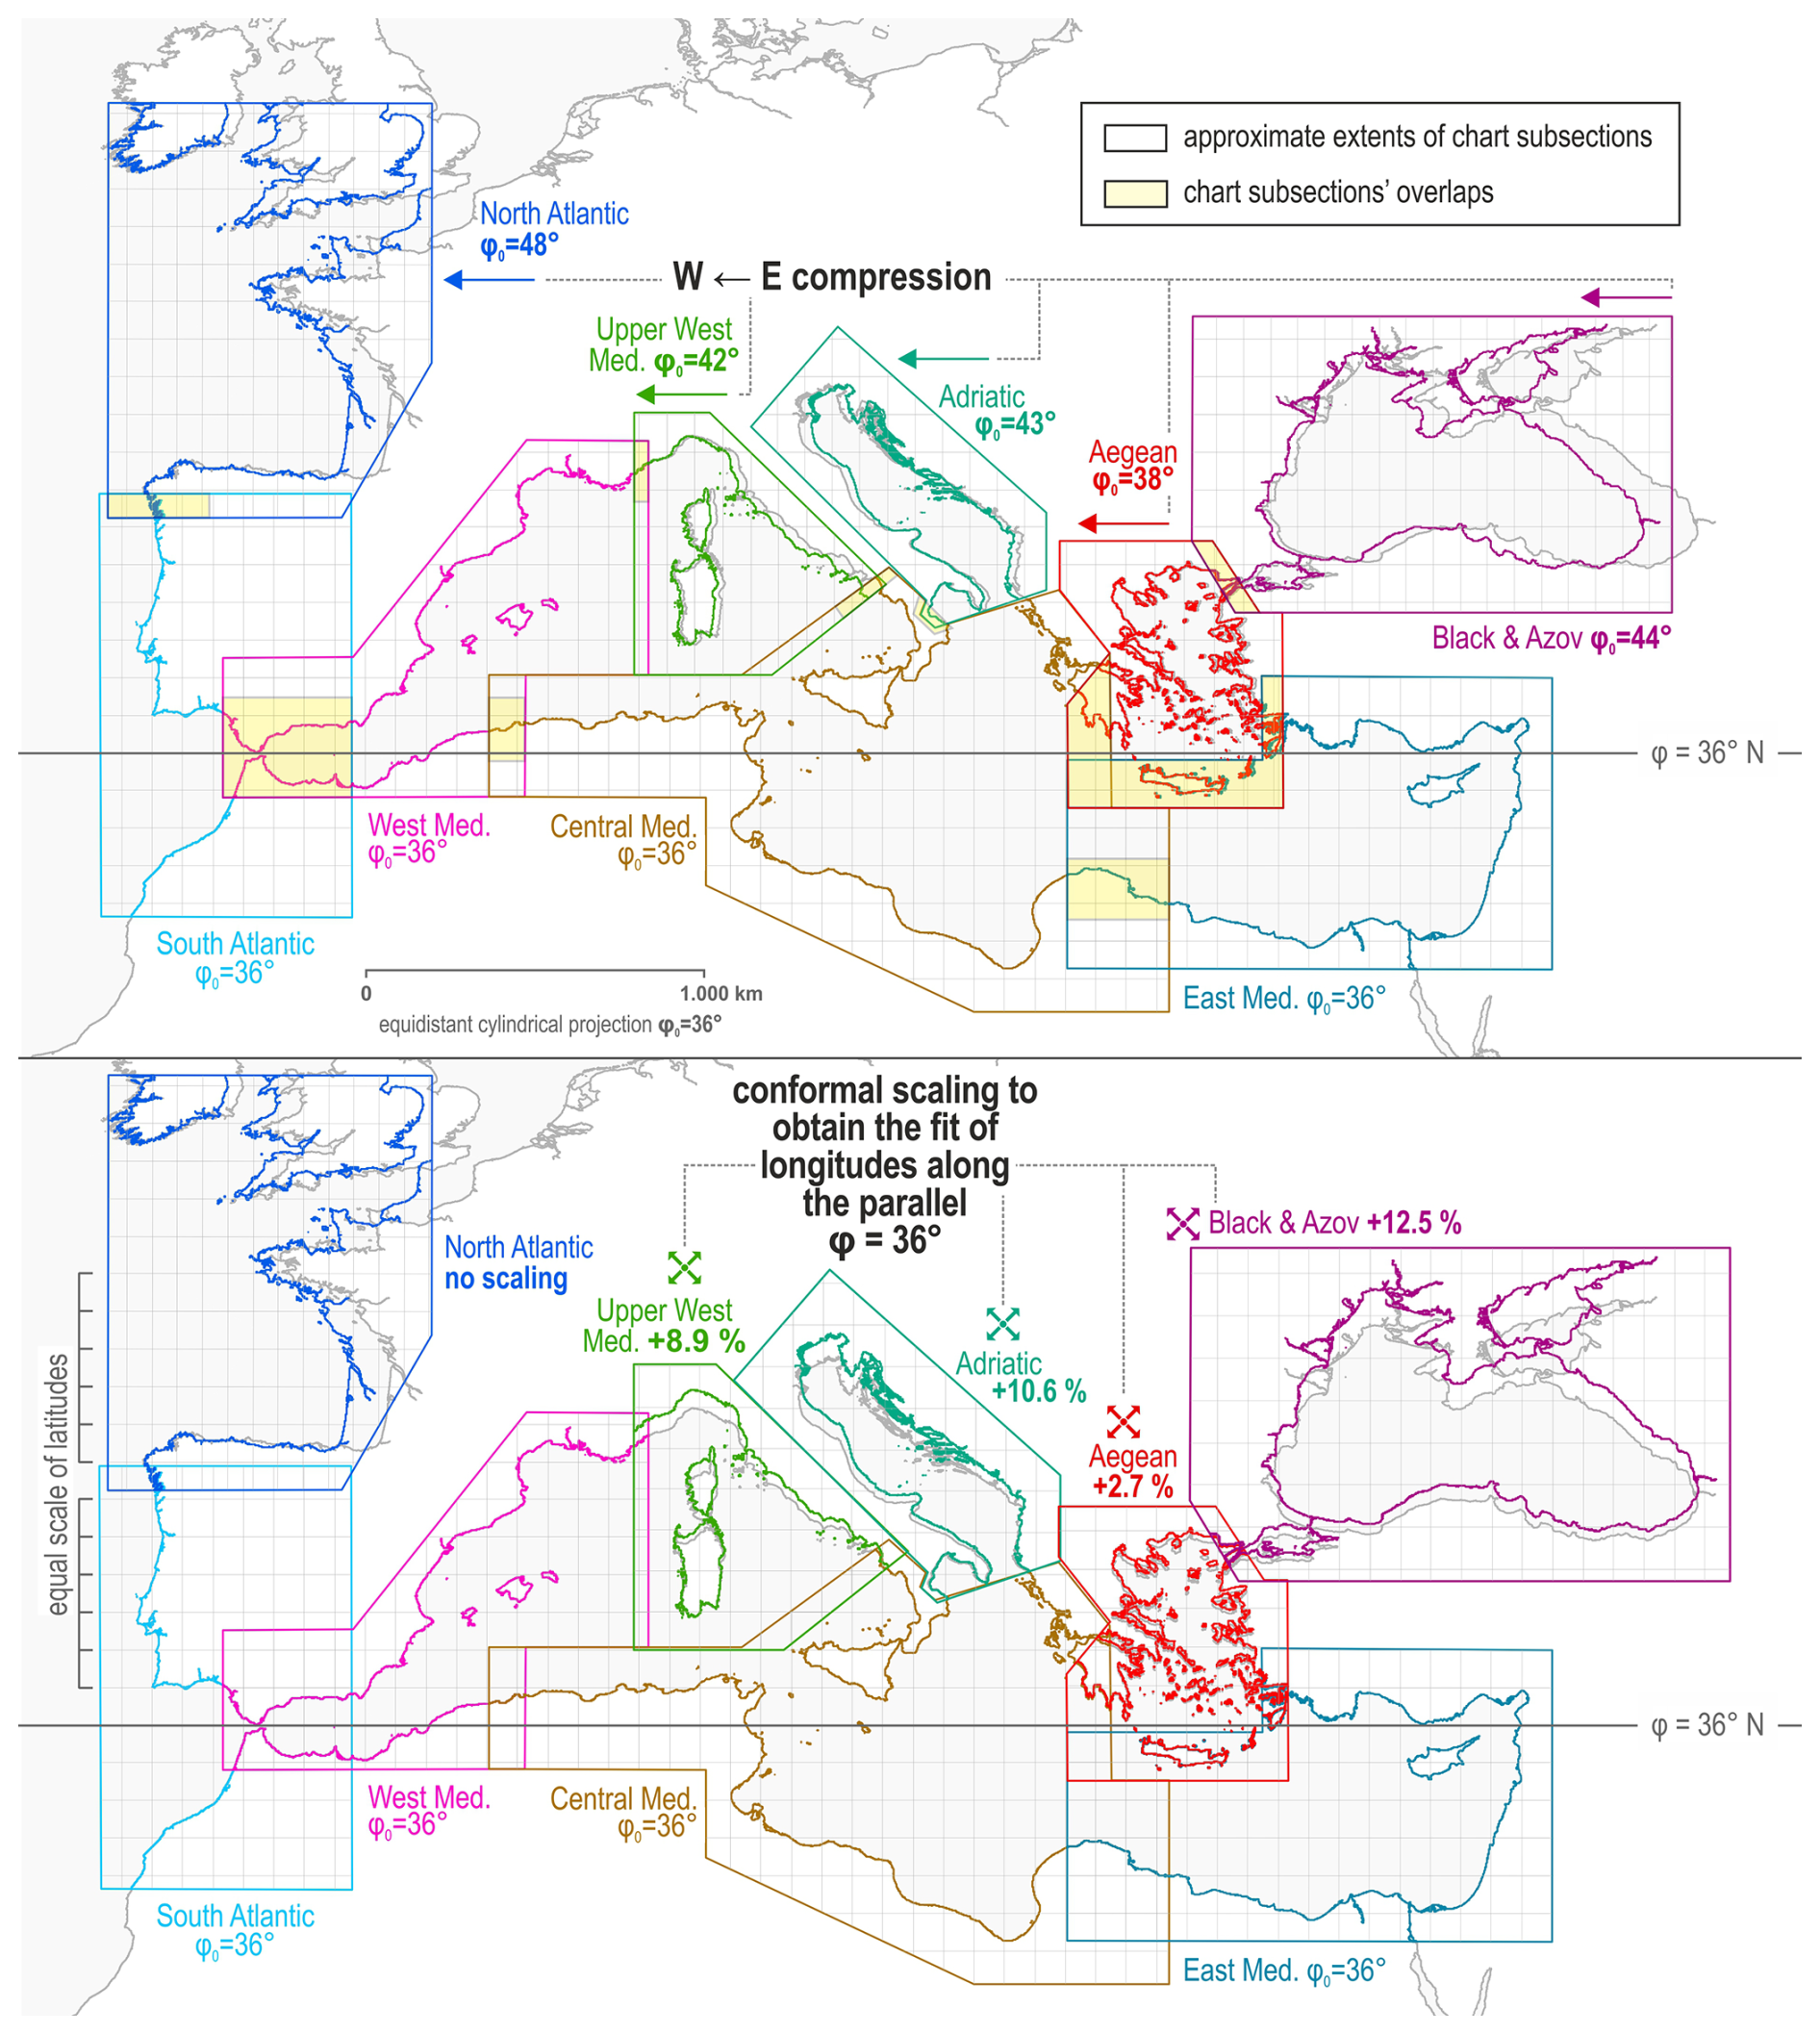
Figure 8The model illustrating the hypothesised original maps from classical antiquity in distinct equidistant cylindrical projections used to construct portolan charts, highlighting the variations in their graticules (the upper part) and how late mediaeval copyist-cartographers could have straightforwardly visually merged them based on their graticules (the lower part). Basemap shapefile source: http://www.marineregions.org (Claus et al., 2017).
If mediaeval Italian cartographers from the Liguria region obtained a collection of maps or charts from classical antiquity, created in distinct equidistant cylindrical projections based on their mid-latitudes, they might have endeavoured to graphically amalgamate them by equalising the segments of their graticules. This hypothesis was empirically evaluated in this study utilising regional coverage of modern reference maps of the area (Fig. 8). The South Atlantic, West Mediterranean, Central Mediterranean, and East Mediterranean subsections of the Carta Riccardiana exhibit a slightly better alignment with the equidistant cylindrical projection φ0 = 36°, which has been established to be significant in classical antiquity and, indirectly, for late mediaeval cartographers. Thus, it is plausible that these four sheets from the ancient map collection have remained geometrically unaltered. However, the set of regional maps to their north – the Upper West Mediterranean, Adriatic, Aegean, and Black and Azov segments – exhibit various longitudinal compressions in comparison with them (see the upper part of Fig. 8), and the most straightforward method to graphically equalise the graticules of the upper row of maps with those of the southern row is to conformally enlarge them until their longitudinal intervals visually match in length (see the lower part of Fig. 8). The territorial coverage on portolan charts for the Mediterranean and Black Sea is predominantly horizontal, whereas the North Atlantic connects to the South Atlantic in a vertical orientation. If the original map of the South Atlantic utilised the equidistant cylindrical projection φ0 = 36° and the North Atlantic map employed the same projection with φ0 = 48°, it follows that their latitude intervals are identical when both maps are made to equal scale. Furthermore, assuming the cartographer lacked prior knowledge of geodesy – as was the case in late mediaeval Europe – it is plausible to suggest that the North Atlantic map was simply positioned directly above the South Atlantic map without conformal scaling, unlike the maps of the northern regions of the Mediterranean and the Black and Azov Seas (see the lower part of Fig. 8). There are several reasons that support this hypothesis.
Firstly, the ratios of the lengths of the mid-parallel on the map and the Earth's great circle could be ascertained in classical antiquity by sequentially employing the trigonometric chord function on a great circle recognised since at least the time of Hipparchus in the second century BCE (Newton, 1979, p. 12) and the Pythagorean theorem, which has been known since the sixth century BCE, as the sine and cosine functions were not yet discovered during that period. For additional details regarding the translation of the chord function into the contemporary cosine function, see Fig. A1.
Table 2The LSE-computed differences in scales of the Carta Riccardiana subsections after georeferencing them individually to the modern map in the Mercator projection and to the modern map in their best-fit equidistant cylindrical projection (before and after the conformal stretching of the Upper West Mediterranean, Adriatic, Aegean, and Black and Azov subsections). Differences in map scale are expressed relative to the map scale of its Central Mediterranean subsection, displayed as 100 %.
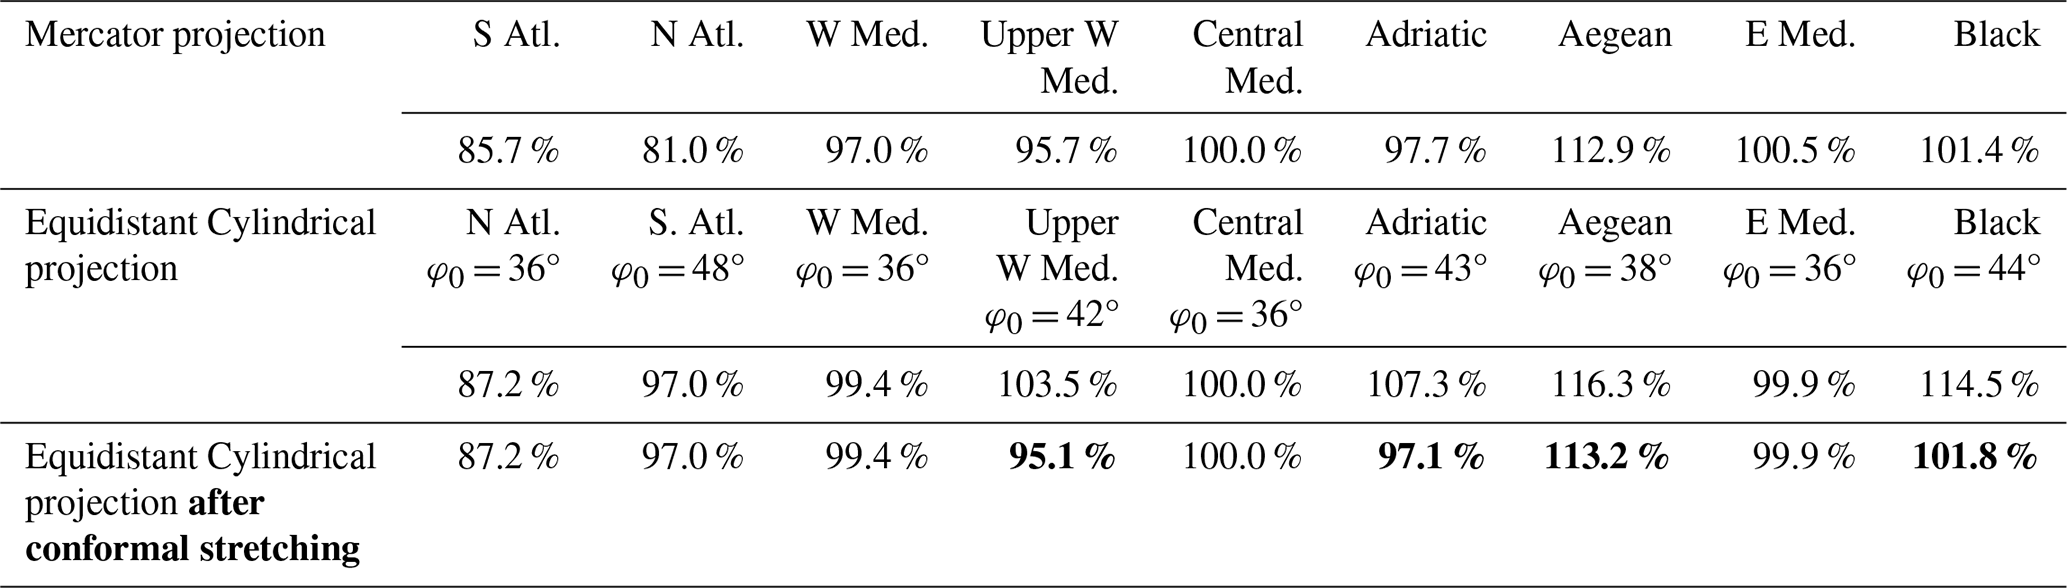
Secondly, it enables an unprecedented explanation for the simultaneous existence of the typical portolan chart portrayal of the Atlantic coasts at a seemingly reduced scale and the northern regions of the Mediterranean at an enlarged scale. Table 2 shows that the relative differences in the scales of the subsections of the Carta Riccardiana, following their least-squares-estimation-computed best fit, are nearly identical when georeferenced to the Mercator map and to their geometrically optimal equidistant cylindrical projections after being conformally stretched by the appropriate magnitude (see the lower part of Fig. 8). In other words, the hypothesis simultaneously considers the established historical timeline of cartographic projection discoveries and tangibly demonstrates how such a graphically manipulated mosaic of regional representations of the Mediterranean and Black Sea can produce the deceptive impression of an underlying conformal cylindrical (Mercator) projection. Moreover, the apparent scale difference of the North Atlantic subsection in comparison to the Central Mediterranean becomes 81 % (or −19 %) in comparison to the Mercator map, which is also a deceptive impression conditioned by its progressive expansion of distances towards the poles (see the upper part of Fig. 7). In the case of georeferencing the subsections of the Carta Riccardiana to their best-fit equidistant cylindrical projections with linear and true-to-scale renderings of latitudes, the relative scale of the North Atlantic subsection drops to just −3 % (97 %). The LSE-computed relative map scales of the South Atlantic and Aegean subsections of 87.2 % (−12.8 %) and 113.2 % (+13.2 %), respectively, refute the proposed model at its current stage as their values were anticipated to be closer to 100 %. However, late mediaeval copyist-cartographers assembled portolan charts based on visual assessment and basic instruments such as rulers and compasses, copied them utilising rather rudimentary techniques such as stencils, pricking and pouncing, and carbon transfer (Krtalić, 2022), indicating that the drafting process was significantly conditioned by its manuscript freehand nature and susceptibility to random errors. Consequently, these figures may stem from errors made while attempting to replicate a cartographic projection with a markedly different geometry, or from straightforward practical reasons, as suggested in Sect. 7.4 and 7.5.
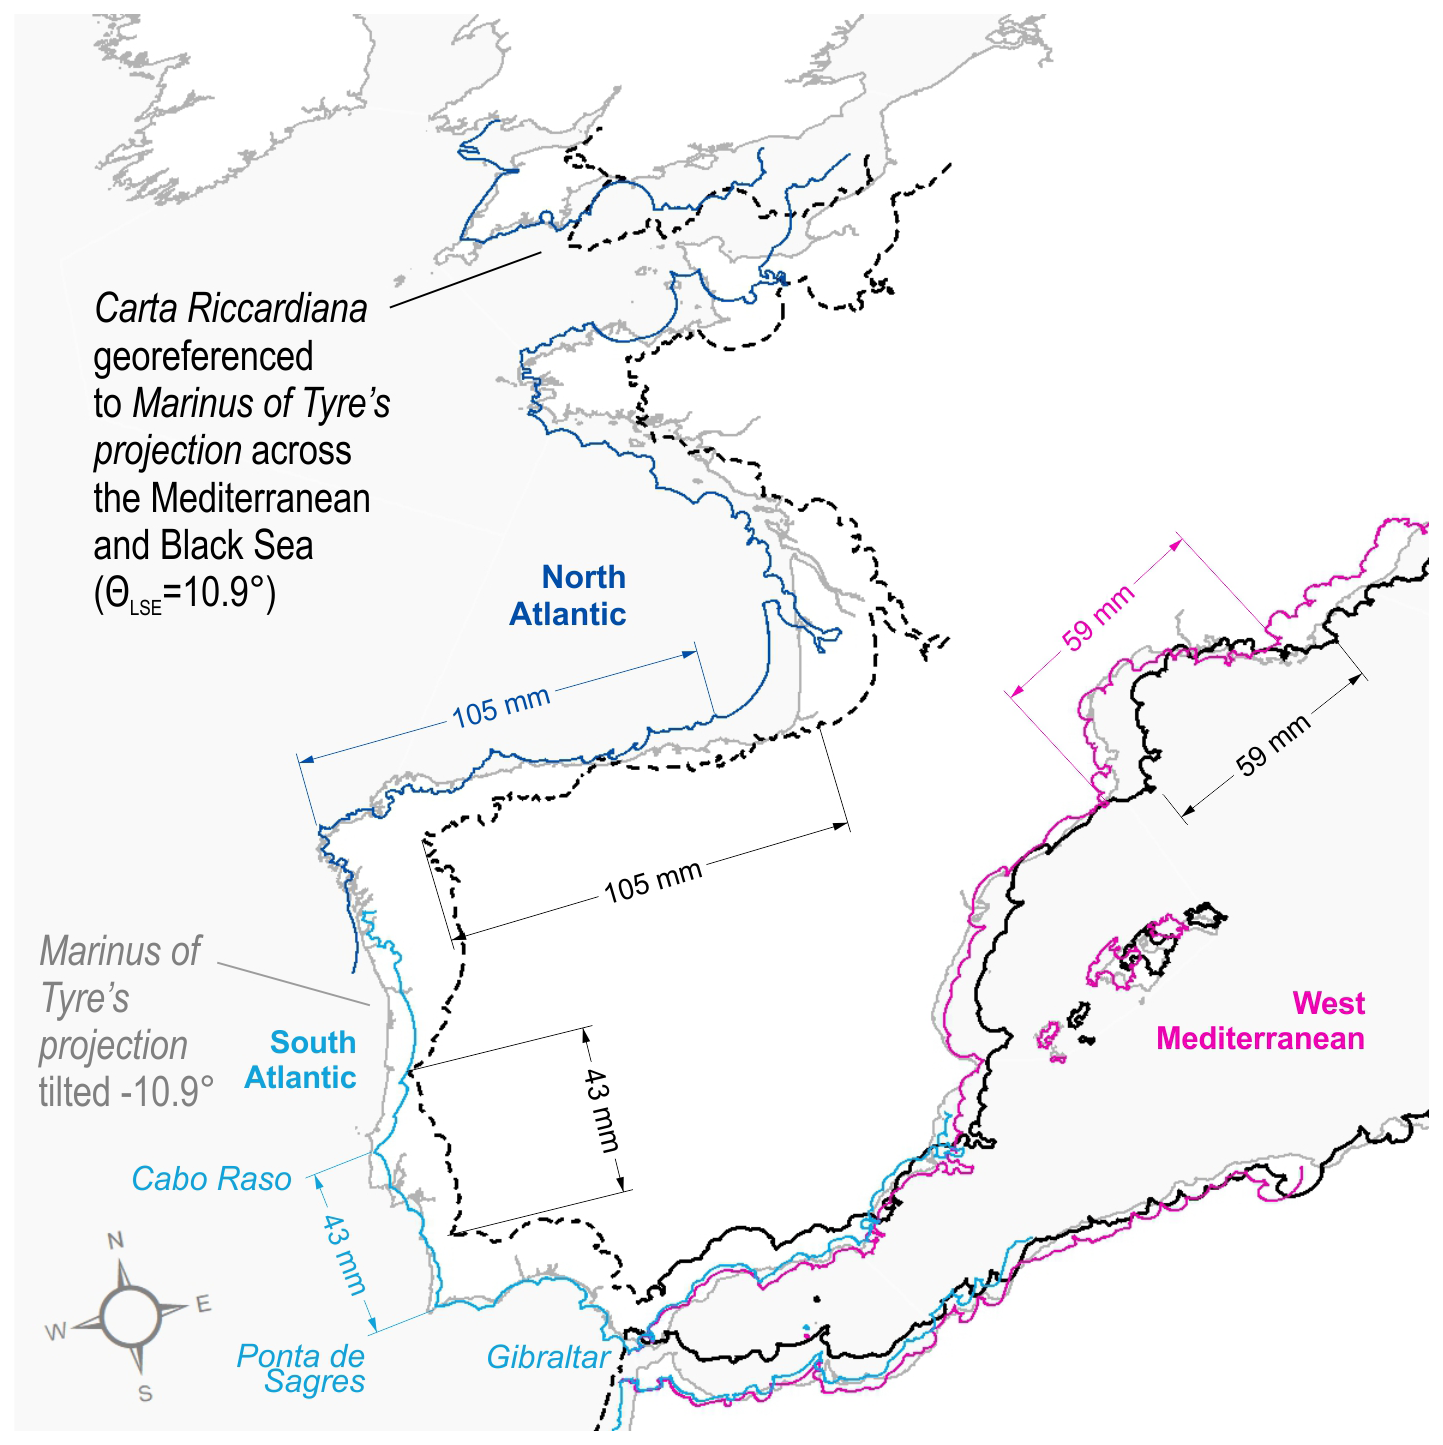
Figure 9The western part of the anonymous Carta Riccardiana georeferenced to Marinus of Tyre's projection across its Mediterranean and Black Sea areas and rotated −10.9° to rectify the overall anticlockwise tilt of its coastlines, having subsections that are manually (graphically) adjusted to the basemap without scaling. The lengths are expressed with the respect to the physical dimensions of the Carta Riccardiana. Basemap shapefile source: http://www.marineregions.org (Claus et al., 2017).
The close-up of the western portion of the Carta Riccardiana, georeferenced to a map in Marinus of Tyre's projection and rotated −10.9° to rectify its overall anticlockwise tilt (Fig. 9), illustrates that, despite the North Atlantic coasts being tilted only −5.9° (+5.0° relative to the overall chart tilt; see Fig. 10), they exhibit a near-identical alignment and scale to the basemap. This indicates that the North Atlantic subsection has not undergone any scale reduction and that its placement on the chart (black dashed line) can be attained by merely shifting it east (in fact east-southeast) from its appropriate position on the Marinus of Tyre's map (dark blue line). The figure further shows that the distance between Cabo Raso and Ponta de Sagres aligns closely with their measurements on a modern map in Marinus of Tyre's projection, as does the adjacent coastline extending southeast from Ponta de Sagres to Gibraltar and across the Alboran Sea, suggesting that these areas were perhaps not subjected to intentional scale reduction by the late mediaeval copyist-cartographer. However, this figure does not explain the reasoning for the (east-south)eastward shift of the North Atlantic and its magnitude, as well as different treatment of the South Atlantic subsection (light blue line) regarding displacement direction and tilt. The solution to this issue is presented in the following section of the article, which thoroughly examines the anticlockwise tilts of the Carta Riccardiana subsections in the next stage of the proposed empirical model.
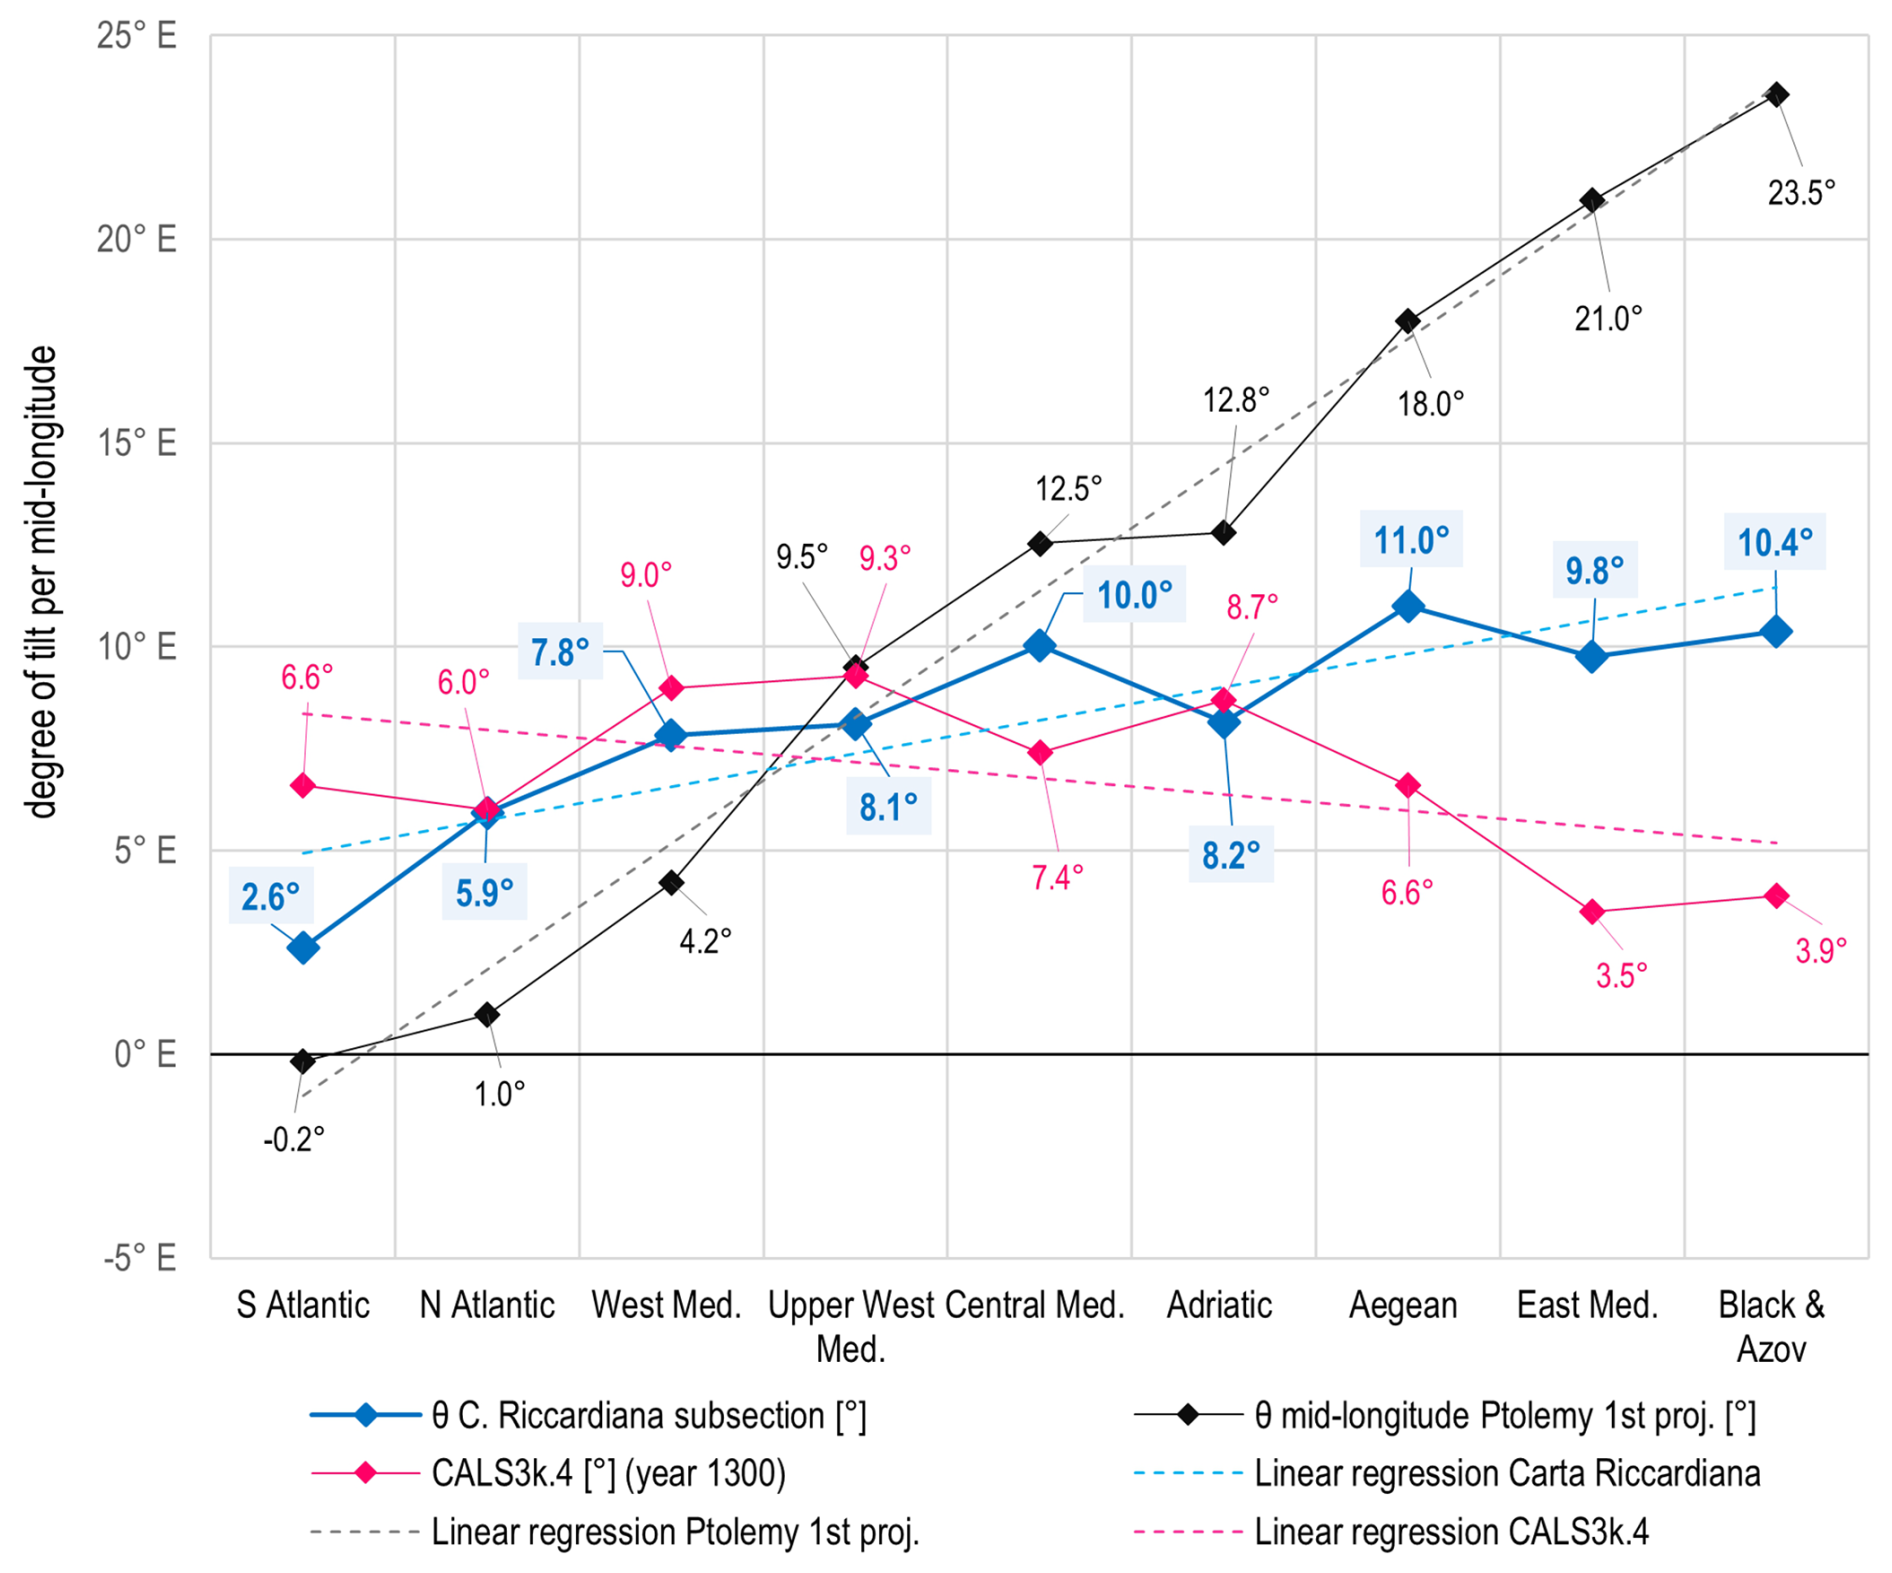
Figure 10The anticlockwise tilts of nine cartometrically determined subsections of the Carta Riccardiana in comparison to their best-fit equidistant cylindrical projection; easterly magnetic declination values for the year 1300 according to the CALS3k.4 paleomagnetic model; and the anticlockwise tilts of meridians on the modern approximation of Ptolemy's first projection centred near Gibraltar (λCM = 6° W), computed for the mid-longitudes of those subsections. CALS3k.4 data source: GEOMAGIA50.v3.2, Archeomagnetic and Volcanic Query Form: https://geomagia.gfz-potsdam.de/geomagiav3/AAquery.php (last access: March 2023).
7.4 Arranging rectangularly gridded sheets to partially mimic the conically gridded overall image
As previously stated repeatedly, the anticlockwise tilts of portolan chart subsections are not consistent with the longitudinal distribution of magnetic declination from the period of their creation, as per the CALS3k.4 paleomagnetic model (compare blue and magenta markers and segments connecting them in Fig. 10), strongly suggesting that the conventional portrayal of coastlines on these charts is unrelated to the use of a magnetic compass during sailboat voyages in those regions. If that were the case, the anticlockwise tilts of their far eastern subsections would display diminished tilts, and the typical portolan chart image of the Mediterranean would be less tilted overall, as evidenced by the regression line of the paleomagnetic model.
The second stage of the empirical model examines the potential alternative rationale utilised by late mediaeval copyist-cartographers to adjust their reproductions of (partially scaled) original maps in cylindrical projections, thereby achieving a coherent cartographic product of a different appearance. Given that two contemporaneous sources attribute the creation of the original maps to Ptolemy (see Sect. 6.3) and considering that 50 portolan miles equate to 1° along the parallel φ = 36° according to his erroneous estimation of the Earth's circumference (see Sect. 7.3), it is plausible that certain classical antiquity sources, whether solely maps or maps accompanied by textual records, attributed to Ptolemy were acquired by late mediaeval Italians and subsequently influenced the creation of the final product. Assuming that late mediaeval copyist-cartographers did not see the entire coverage on a single map in the equidistant cylindrical projection, or at least did not regard it as an optimal representation – following Ptolemy's critique of this projection for inadequately depicting larger areas due to its failure to illustrate the convergence of meridians and thus the Earth's sphericity (Berggren and Jones, 2000, p. 34) – it is plausible to assume that they utilised a small-scale earlier-made map of the oikoumene in Ptolemy's first projection as a graphical template.
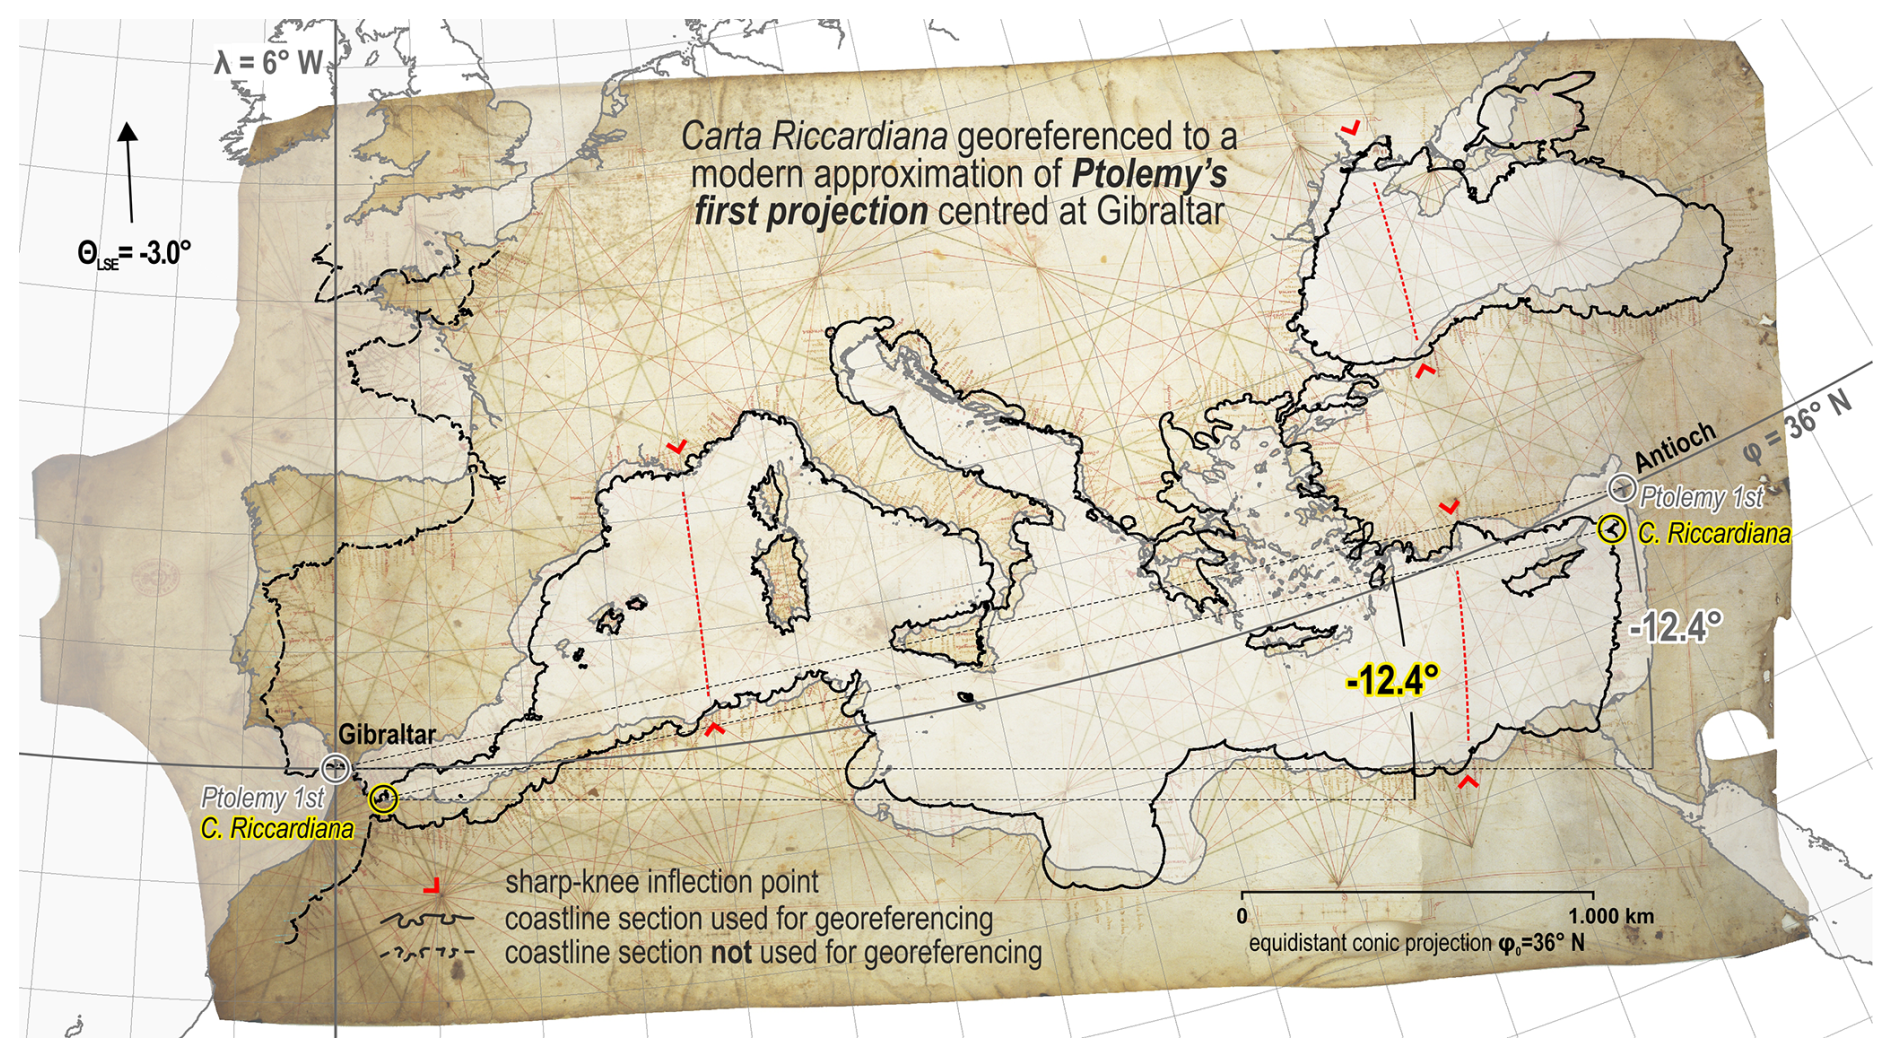
Figure 11The digitised image of the anonymous Carta Riccardiana portolan chart (ca. 1300–1325) georeferenced to a map in the modern approximation of Ptolemy's first projection centred at Gibraltar. While its westernmost and easternmost quarters graphically break off from the basemap, about half of its longitudinal extent at the centre show a relatively good fit in terms of orientation. Chart source: Biblioteca Riccardiana, Ricc. 3827. Basemap shapefile source: http://www.marineregions.org (Claus et al., 2017).
In contrast to the overall LSE-computed rotation of (+)10.9° in comparison to Marinus of Tyre's map (see the lower part of Fig. 7), the georeferencing of the Carta Riccardiana to a modern approximation of Ptolemy's first projection – adjusted so that its vertically plotted central meridian (CM) is positioned near Gibraltar (λCM = 6° W) – across the Mediterranean and Black Sea regions yields an overall rotation of −3.0° (Fig. 11) and seemingly inadequate agreement of coastline contours. However, roughly half of its longitudinal extent at the centre exhibits a relatively good fit in terms of orientation, whereas the westernmost and easternmost quarters graphically break off (see the regions west of the western and east of the eastern sharp-knee inflection points and the connecting lines in Fig. 11). Furthermore, the angle between the line connecting Gibraltar and Antioch (the endpoints in the Mediterranean Sea along the parallel φ = 36°) is −12.4° on both the reference map and the georeferenced image of the Carta Riccardiana, differing by only −1.5° from its overall LSE-computed rotation when compared to Marinus of Tyre's map (see the lower part of Fig. 7). This indicates that on the rectified Carta Riccardiana (subsequently rotated +3.0°), the Gibraltar–Antioch line is tilted −9.4°, diverging by only (+)1.5° from its optimal alignment to Marinus of Tyre's map, and the overall results strengthen the hypothesis that late mediaeval copyist-cartographers employed a map based on Ptolemy's first projection as a reference model.
The black markers linked by straight segments in Fig. 10 illustrate the progressive increase in anticlockwise meridian tilt with eastward longitude on a modern approximation of Ptolemy's first projection centred at Gibraltar (λCM = 6° W), derived using formula [rad] (Snyder, 1978, p. 374). In contrast to the CALS3k.4 model, its regression line ascends, simultaneously producing comparable solutions in the mid-longitude regions (the Upper West Mediterranean and Central Mediterranean subsections) of the Carta Riccardiana (compare grey and magenta dashed lines in Fig. 10). According to this assembly logic, it is clear that its final product would be significantly distorted in comparison to the cylindrical projection and does not visually align with the conical equidistant projection (see the upper part of Fig. 12).
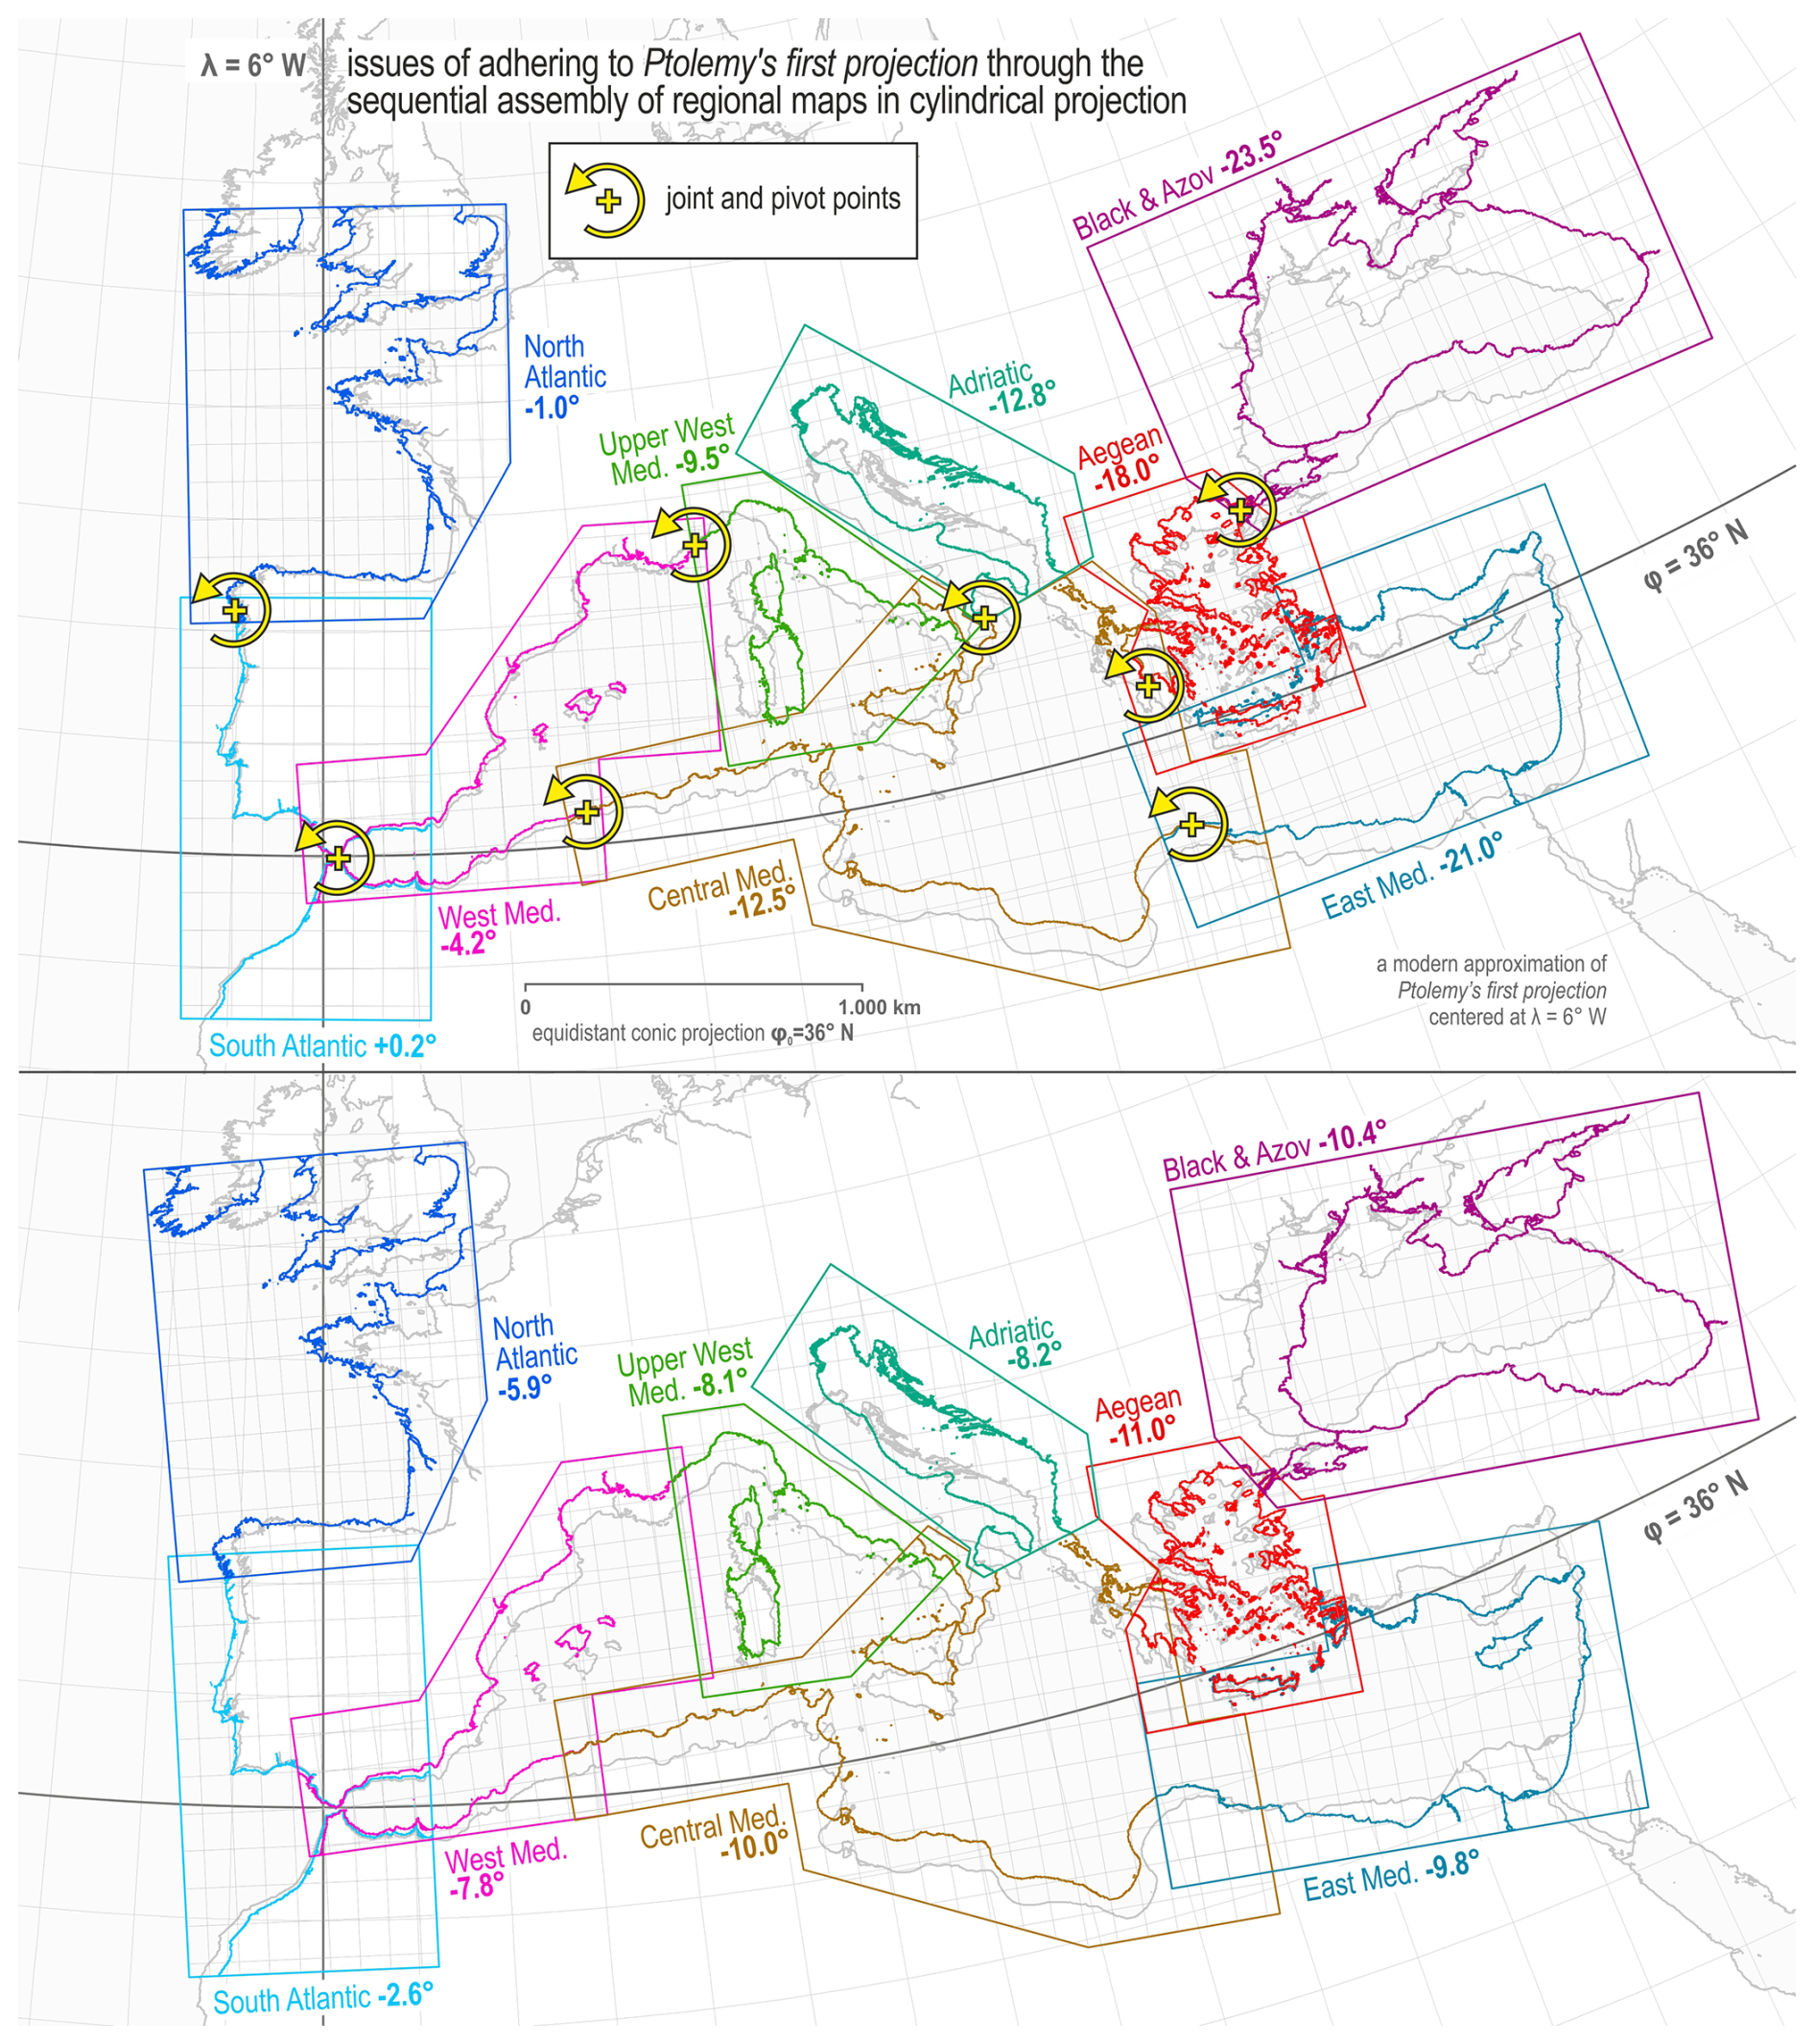
Figure 12The model illustrating the hypothesised original maps from classical antiquity being tilted in accordance with the modern approximation of Ptolemy's first projection (the upper part) and in accordance with the cartometrically determined LSE-computed tilts of the Carta Riccardiana subsections in comparison to their best-fit equidistant cylindrical projections (the lower part). Basemap shapefile source: http://www.marineregions.org (Claus et al., 2017).
The only correct method to transform the cartographic display from one map projection to another involves initially de-projecting the Euclidean coordinates from the first projection using the inverse equations into spherical or ellipsoidal coordinates, followed by re-projecting them into the new projection using the appropriate equations. Late mediaeval copyist-cartographers, completely lacking understanding of these concepts, likely devised a straightforward graphical hybrid-solution: an image that aimed to preserve the individual geometry of the original regional maps while partially aligning their mosaic with Ptolemy's recommended cartographic representation of the area (see the lower part of Fig. 12). This assemblage, formed by pivoting the regional maps in cylindrical projections based on LSE-computed tilts of the Carta Riccardiana subsections, results in an overall tilt that is approximately half as steep compared to the meridian images in Ptolemy's first projection centred at Gibraltar. Such a configuration is nearly the midpoint between it and the overall image in Marinus of Tyre's projection (see Fig. B1) which vertically plots all the meridians (as indicated by the regression line roughly situated between the modern approximation of Ptolemy's first projection and the horizontal zero-tilt line of Marinus's map projection in Fig. 10).
This stage of the empirical model also addresses the tilts of its South Atlantic and North Atlantic subsections, which remained unresolved in the previous stage. Specifically, when the Carta Riccardiana is georeferenced to a modern map in Marinus of Tyre's projection and rotated −10.9° to rectify its overall anticlockwise tilt, and subsequently overlaid with the modern approximation of Ptolemy's first projection centred at λ = 6° W, utilising Gibraltar as the contact point for both maps (see Fig. 13), its South Atlantic subsection aligns almost identically in tilt with its coasts on the map in Ptolemy's first projection, whereas its North Atlantic subsection exhibits only a slightly smaller degree of tilt. In other words, it provides a comprehensive rationale for the tilt of its Atlantic coasts, completely detached from the concept of magnetic declination, and persuasively argues that late mediaeval copyist-cartographer employed Ptolemy's first projection as a template for the assembly of its regional subsections.
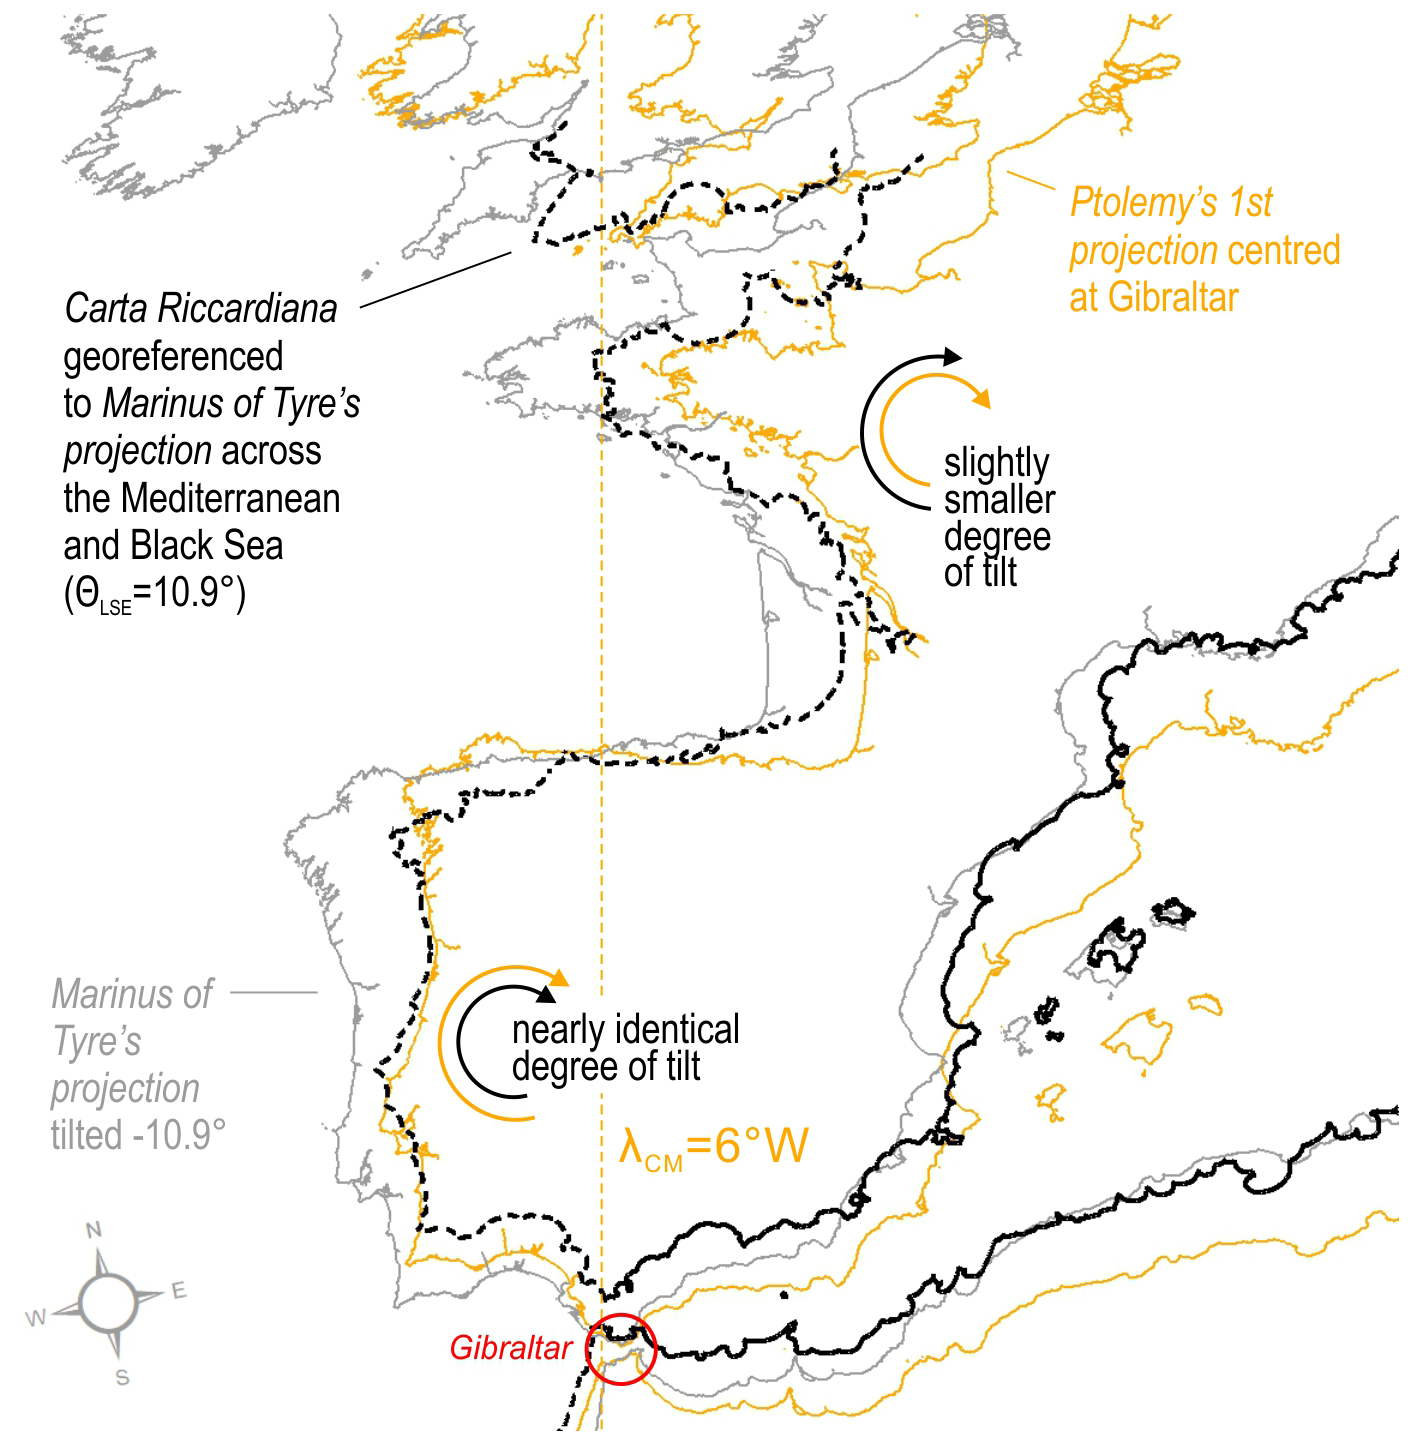
Figure 13The western part of the anonymous Carta Riccardiana georeferenced to Marinus of Tyre's projection across its Mediterranean and Black Sea areas and rotated −10.9° to rectify the overall anticlockwise tilt of its coastlines, overlaid with the modern approximation of Ptolemy's first projection centred at Gibraltar, with Gibraltar selected as the contact point for both basemaps. Basemap shapefile source: http://www.marineregions.org (Claus et al., 2017).
7.5 The plausibility of the proposed model and other remarks
In the final stage, the proposed model was initially superimposed onto the vectorised coastline of the Carta Riccardiana, having been georeferenced to the Mercator projection with an overall tilt of −10.6° (see the upper part of Fig. 14). The overlay image demonstrates that the Atlantic coasts of the Carta Riccardiana align more closely with the proposed model, thereby corroborating the initial hypothesis regarding the late mediaeval Italian copyist-cartographers' rationale (most likely Pietro Vesconte's in this case) to compile their reproductions of the original maps in distinct equidistant cylindrical projections for those regions, but similar conclusions cannot be drawn for the remainder of its coverage. However, when those segments are marginally shifted, and the Aegean Sea subsection is enlarged by 15 %, the final configuration aligns with the coastlines of the Carta Riccardiana with remarkable congruence (see the lower part of Fig. 14), thereby substantiating the proposed mechanics of the classical antiquity origin hypothesis to a significant extent. To fully comprehend the relatively minuscule magnitudes of those shifts in reality, one must consider that the Gibraltar–Antioch line of the Carta Riccardiana measures 686.3 mm; therefore, a 10 mm shift in one direction represents only 1.4 % of its (tilted) longitudinal extent across the Mediterranean. Since the model has been assembled using segments of a modern map (treated as error-free), the findings also tangibly illustrate the remarkable planimetric accuracy of the coastline contours on the supposed maps from classical antiquity which late mediaeval copyist-cartographers likely utilised to create a composite known as a portolan chart, in this case the Carta Riccardiana.
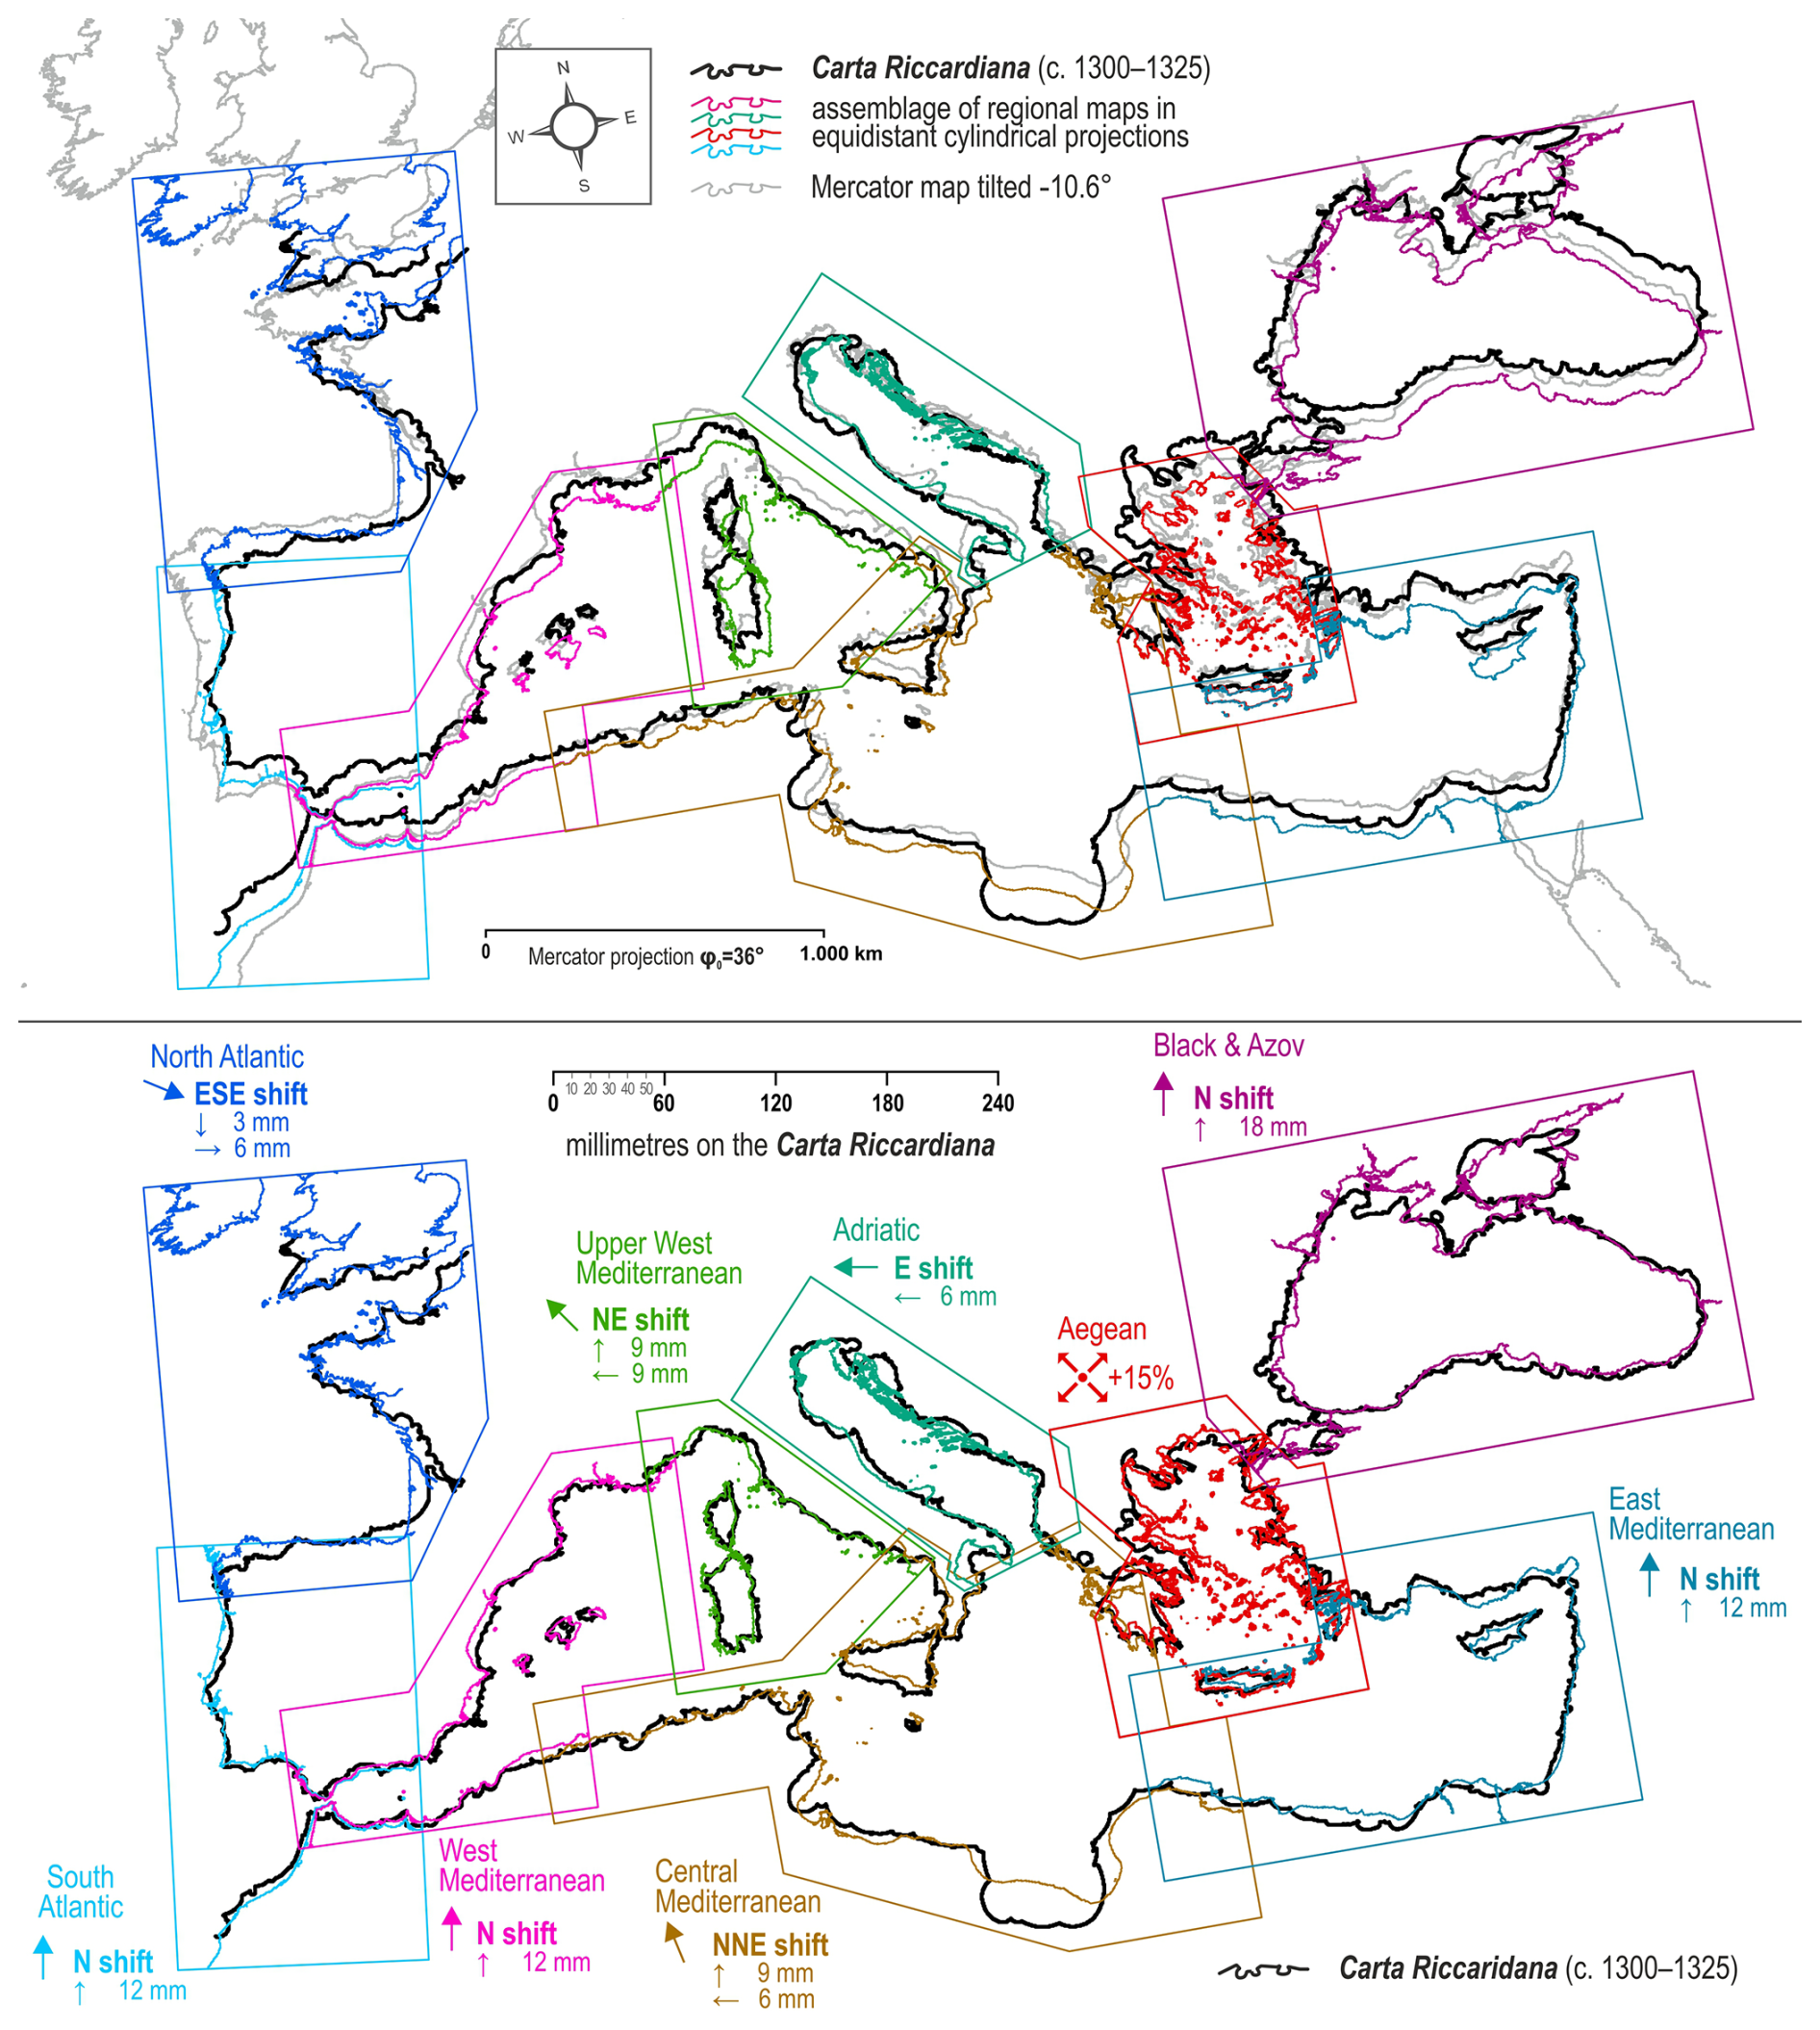
Figure 14The overlay of coastlines on the Carta Riccardiana with the modern Mercator map and the hypothesised assemblage of regional maps in distinct equidistant cylindrical projections (the upper part) and its overlay with an assemblage that has been slightly adjusted in terms of scale and shift (the lower part). The magnitudes of shifts are expressed with the respect to the physical dimensions of the Carta Riccardiana. Basemap shapefile source: http://www.marineregions.org (Claus et al., 2017).
These findings also suggest that the 4° tilt of the western wind rose and its surrounding area in relation to the eastern wind rose and its vicinity on the Cortona chart (Marelić, 2024a, pp. 148, 152) may not be an error attributed to an inept cartographer replicating the map. Instead, this 4° convergence may serve as a direct cartographic evidence that Italian late mediaeval copyist-cartographers adjusted the map sheets in Marinus of Tyre's projection, utilising the representation of the overall area on Ptolemy's first projection as a graphical template. Furthermore, the initial stage of the model (see Sect. 7.3) may potentially exemplify the geometry of the proposed precursor version of the typical portolan chart that has been orientated to the geographic north and supplemented by a 16-point wind rose, which, according to Nicolai (2024), was likely employed to derive bearing and distance data for the compilation of the Liber de existencia riveriarum portolan in the early 13th century.
Given that the model incorporates regional equidistant cylindrical projections with graticules, where longitudinal intervals were employed for scale adjustments in the Mediterranean and latitudinal intervals for the Atlantic, it is plausible to deduce that the original maps from classical antiquity also contained graticules and were likely not exclusively nautical charts but could have fulfilled both geographical and navigational purposes. If late mediaeval Italian copyist-cartographers aimed to transform those graticule-equipped source maps into nautical charts for practical reasons or by mandate, it is logical to infer that replicating the graticules was redundant. Instead, it appeared beneficial to incorporate navigational instruments, such as wind roses and linear scale bars, facilitating the direct conversion of chart metrics into predictions of courses and distances to be traversed.
However, it appears that the compilation of the composites presented certain challenges for the copyist-cartographers, primarily in their efforts to seamlessly blend their reproductions of adjacent regional maps. In the western portion, a graphical conflict is evident in the northern region of the Iberian Peninsula, where the North Atlantic and South Atlantic segments meet, and it appears that Pietro Vesconte opted to subtly compress the Galician coasts and to bevel the head of the Bay of Biscay to facilitate a smoother graphical transition. Moreover, portrayals of the Aegean Sea on portolan charts include numerous islands, usually accompanied by their respective toponyms inscribed in proximity. The significant increase of approximately 15 % in the map scale of the Aegean segment was likely motivated by practical considerations to incorporate toponyms, thereby compromising the accurate depiction of distances in a consistent map scale, whether deliberately or inadvertently. However, the authors of the Pisane and Lucca charts rendered their Aegean Sea subsections in a considerably more appropriate map scale (Marelić, 2024a, p. 149; Marelić, 2025b, p. 148), thereby indicating that its enlargement – as evident on the Cortona chart, the Carta Riccardiana, and some other charts and atlases made by Pietro Vesconte and later copyist-cartographers (Marelić, 2024a, pp. 150, 154; Marelić, 2024b, p. 607) – was introduced shortly after and became a standard subjected to numerous mostly unaltered replications. Similarly, the numerous islands and their names represented in the maritime section of the chart may elucidate the greater prominence of the Quarner Gulf in the Adriatic Sea on the Carta Riccardiana. An analogue yet contrary conclusion can be drawn regarding the traditional portolan chart representation of the Gulf of Taranto in southeastern Italy, which was likely considerably diminished to prioritise the toponyms of mainland ports, resulting in the amplification of the promontories of Calabria and Apulia to the expense of the Gulf of Taranto. Both local deviations occur in the Adriatic segment and may have indirectly contributed to its marginally improved accuracy relative to the Mercator projection, which progressively expands the image of the charted regions towards the poles.
The main shortcoming of the proposed model is its assumption that the originals of the maps utilised to create portolan charts – whose projections were invented in classical antiquity – exhibited comparable planimetric accuracy in both longitudinal and latitudinal directions, a notion that contradicts the substantial longitudinal inaccuracies in the extant copies of Claudius Ptolemy's geographical treatise, many of which underwent considerable redactions during the late Middle Ages and the early Renaissance. This issue stems from the division of relatively accurately measured distances by his mistakenly perceived smaller circumference of the Earth's great circle, resulting in exaggerated longitude values (Tupikova, 2014; Marelić, 2025b). Furthermore, the original maps from Ptolemy's Geographia book are not preserved and seem to have been created by an engineer (mechanikos) named Agathodaimon from Alexandria, who was employed as an expert to translate geographical data into visual representations (Mittenhuber, 2010, p. 109). Ptolemy reports that the records of Marinus of Tyre, who made “many publications of the revision of the geographical map … [and] consulted the maps of his predecessors” were the prime source of his geographical data, and he criticised much of Marinus's methodology regarding its merit. Marinus's records are either lost or yet to be discovered, and the 10th-century Persian scholar al-Masudi claimed to have analysed his geographical treatise, concluding that its maps substantially outperformed those of Ptolemy (Nordenskiöld, 1897, p. 10; Berggren and Jones, 2000, pp. 23, 25, 48). Consequently, it remains indeterminate how accurate the maps of Marinus and Ptolemy were, and, crucially, the extent of Claudius Ptolemy's overall authority, particularly in light of Robert R. Newton's work The crime of Claudius Ptolemy (Newton, 1977). In it, Newton extensively and meticulously exposes Ptolemy's subpar accuracy of astronomical observations presented in his work Almagest (Syntaxis Mathematica in Latin), which were inferior to those documented by Hipparchus centuries prior, a fact that French mathematician, astronomer, and geodesist Jean Baptiste Joseph Delambre pointed out already in the early 19th century. Considering the aforementioned factors, along with the scarcity of historical records from classical antiquity – such as the absence of less sophisticated versions of the complex Antikythera mechanism and the lack of documentation regarding the creation and use of analogous devices – it is conceivable that the principles of equidistant conic projection were recognised prior to Ptolemy; that an individual or individuals before, concurrently, or after him created maps with improved longitudinal accuracy using Eratosthenes's calculations of the Earth's great circle; or even that Claudius Ptolemy later authored a revised and corrected edition of the original Geographia, accompanied by more accurate maps, which may have subsequently been destroyed or lost. The standard coverage of portolan charts corresponds with the territorial extent of the Roman Empire under Trajan in the late first and early second centuries CE, suggesting the possibility of an organised systematic field survey, potentially covert, as proposed by Helmut Minow (Minow, 1998). Future discoveries of cartographic artefacts from that period or further authentic written records may provide a more thorough comprehension of the origins of portolan charts, thereby diminishing reliance on numerical reconstructions.
Comprehensive cartometric analyses of portolan charts, including the author's prior publications, have yielded substantial evidence indicating that the spatial data underlying them are not the result of a collective and systematic compilation of navigational observations from the late Middle Ages, but are instead likely composites derived from earlier originals. This study integrates cartometric analyses with established historical data and represents the inaugural clear and straightforward proposal regarding the mechanism through which late mediaeval Italian copyist-cartographers could have assembled this composite. The proposed model explicitly addresses the disparities in the scales of representation (seemingly diminished scale of the Atlantic coasts versus an augmented scale of the northern portions of the Mediterranean Sea and the Black Sea) and illustrates that the typical anticlockwise tilt of the coastlines on these charts is not attributable to magnetic declination.
This research not only offers a rigorous and detailed rebuttal of the hypothesis regarding mediaeval data sources for the creation of portolan charts but also, exemplified by the Carta Riccardiana, establishes that the subsections of portolan charts were not derived from the old maps originally made in the Mercator or some Mercator-like projection. Instead, they exhibit superior planimetric accuracy compared to equidistant cylindrical projections calibrated to their mid-latitudes, a concept originating from classical antiquity and attributed to Marinus of Tyre. A model was developed that considers the late mediaeval cartographers' lack of understanding the differences between the spherical geometry of the Earth's surface and the Euclidean geometry of map projections. It posits that they graphically amalgamated their reproductions of ancient originals to create a relatively seamless composite, utilising a map in equidistant conic projection, attributed to Claudius Ptolemy, as a reference model.
The model tangibly demonstrates that if regional maps with high planimetric accuracy, based on the projection of Marinus of Tyre and depicting the northern Mediterranean, are conformally scaled by longitude (to visually align them with those representing the southern zone with the standard parallel φ0 = 36°), while the North Atlantic map remains unaltered in terms of scale, a composite image that plausibly aligns with the coastal contours of the Carta Riccardiana in terms of scale is produced. Moreover, if one incrementally rotates the segments of this composite starting from Gibraltar by approximately half the magnitude of the meridian inclination in Ptolemy's first projection centred at Gibraltar and subsequently only marginally shifts those segments, the resultant configuration closely mirrors the geometry of the Carta Riccardiana, presumably crafted by Pietro Vesconte.
The square grids in al-Shirazi's schematic of a “Greek map” and the Pisane and Avignon charts, and the diverse alignments of linear scale bars rendered on portolan charts all suggest that late mediaeval cartographers and navigators were seemingly unaware of the fact that, because of the sphericity of the Earth, the distance traversed N–S corresponds to uniform intervals of latitude globally, whereas the same distance traversed W–E encompasses an increasing number of degrees of longitude as one approaches the poles. Consequently, it appears highly unlikely that they possessed the genuine capacity to create a mosaic of underlying images (the subsections of portolan charts) that conditionally depict this phenomenon on a flat map surface, akin to plotting meridians as parallel lines where longitudinal distances are preserved exclusively along their proprietary mid-latitudes. If that were the case, the northern areas of the Mediterranean and the Black and Azov Seas would be portrayed at a reduced map scale, as opposed to the enlarged scale that has been consistently employed. Moreover, except for the Cortona chart, the wind roses on portolan charts have been consistently orientated towards the uniform (north) direction, despite the actual discrepancies in the anticlockwise tilts of their subsections, thereby rendering them less effective for navigation in specific areas. This indicates that late mediaeval copyist-cartographers and navigators were compelled to rely entirely on the source maps they obtained and graphically assembled, as their scientific and technological limitations hindered their ability to create a more accurate and internally coherent cartographic representation of the charted regions.
Given that the proposed model has plausibly validated the author's hypothesis regarding the classical antiquity origin of spatial data underlying portolan charts – corroborated by three historical sources from the late Middle Ages – further inquiry into their origins should be pursued not only in mediaeval archival records but also in classical antiquity sources, or justifiably broaden the investigation in that direction.
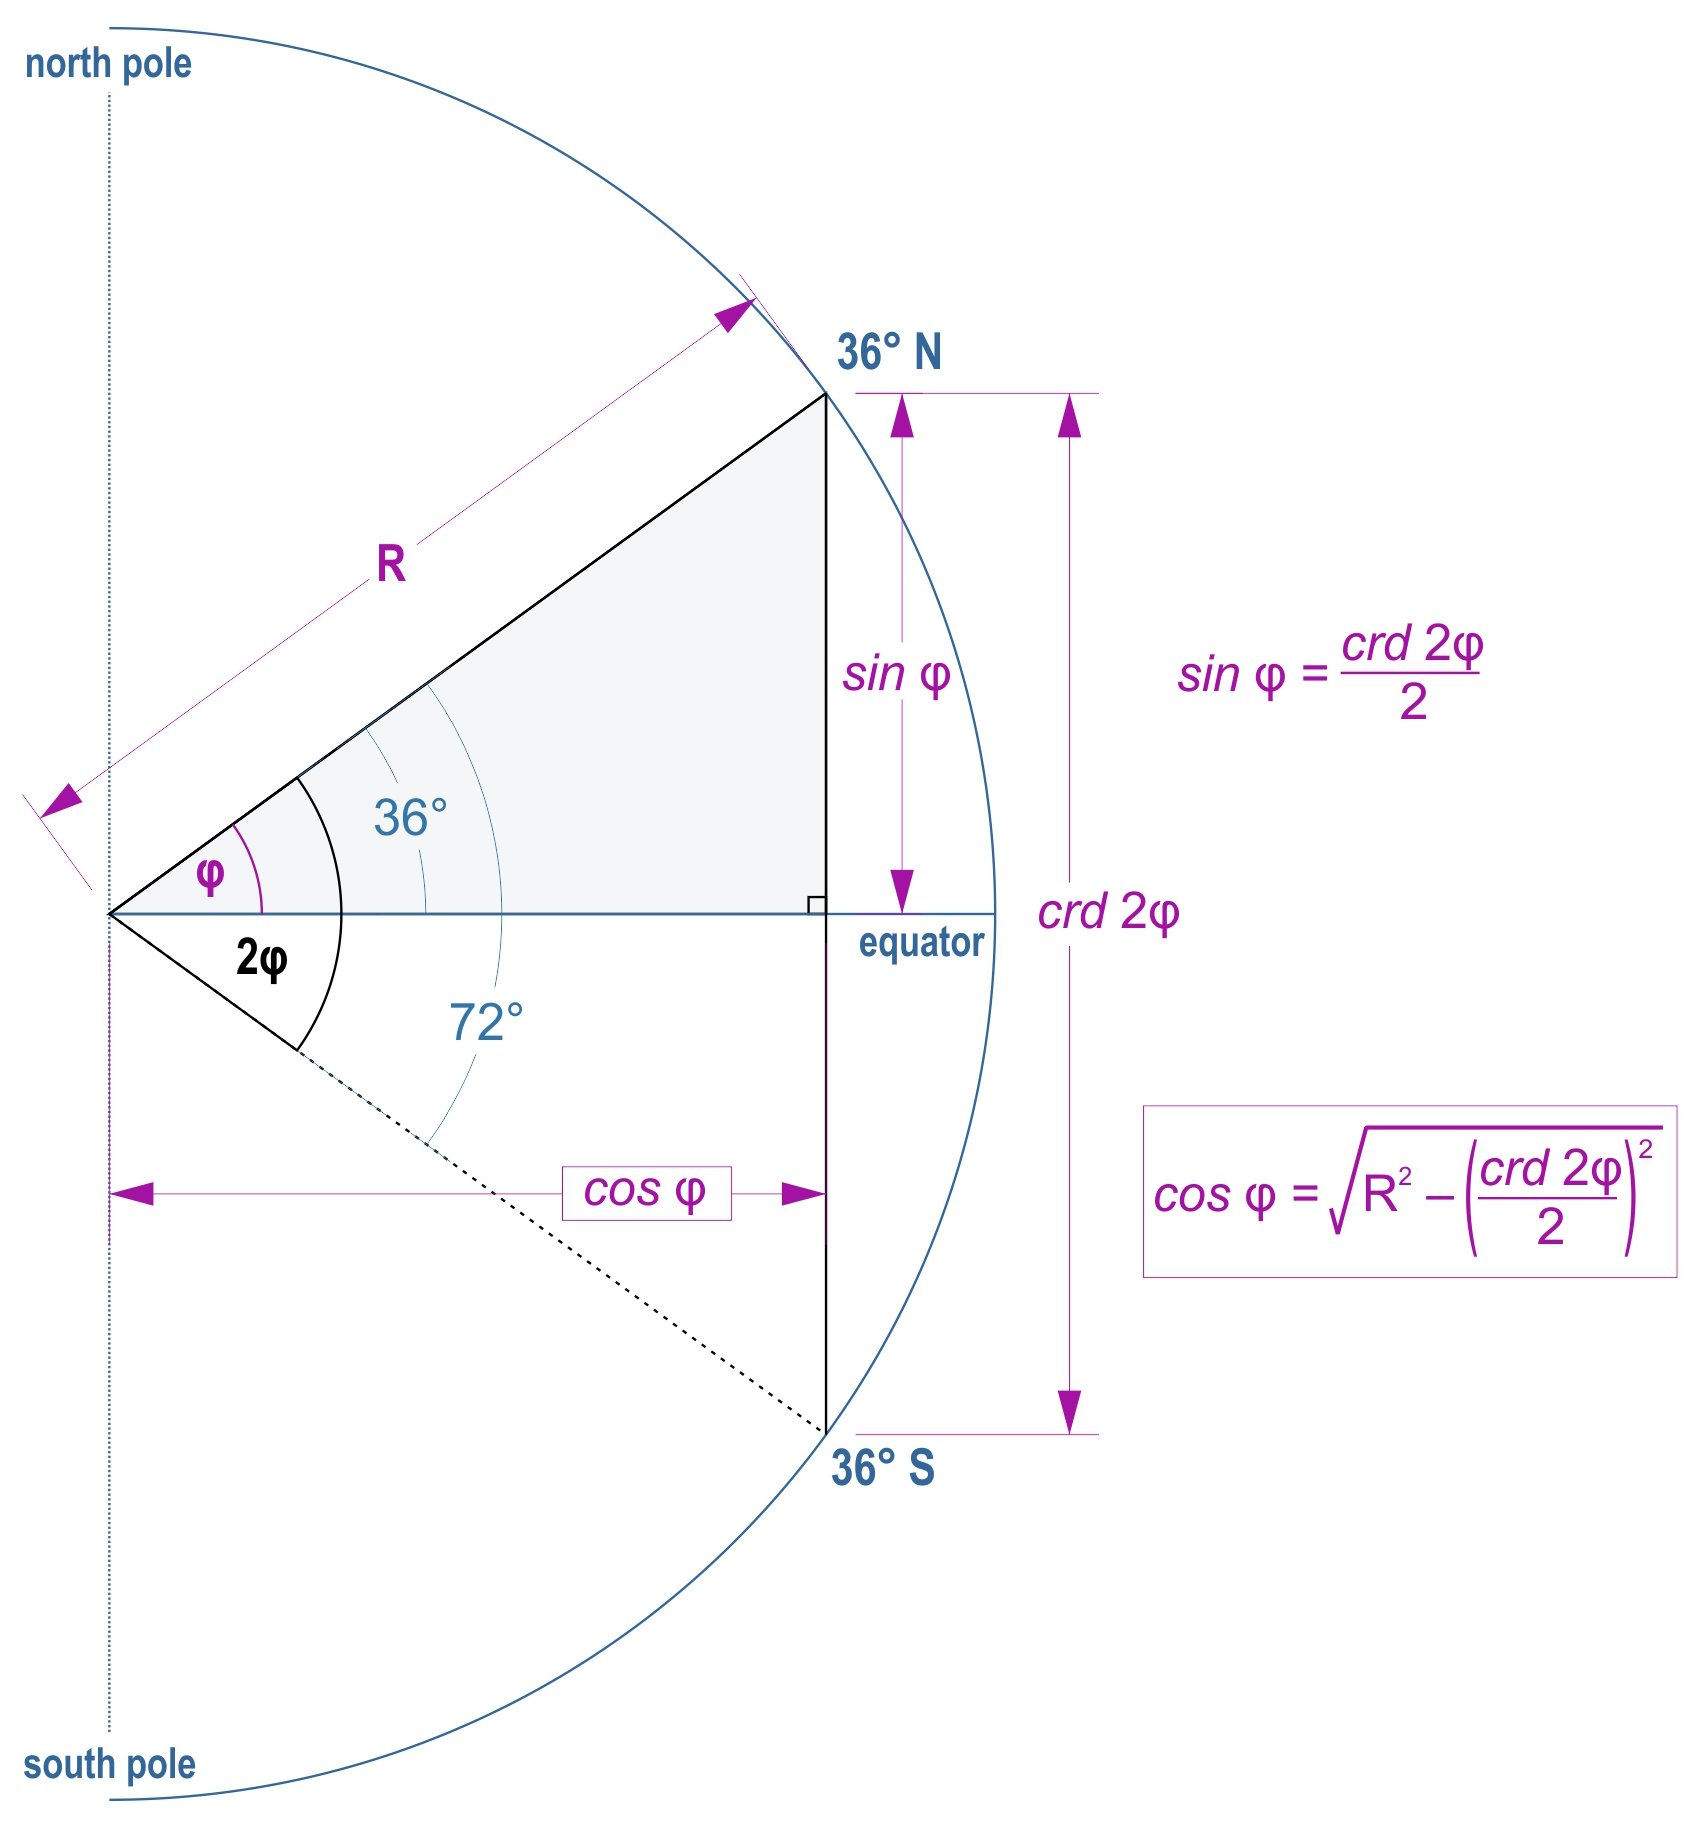
Figure A1The principle of deriving the cosine function of mid-latitude (cos φ) from the established chord function of double mid-latitude (crd 2φ).
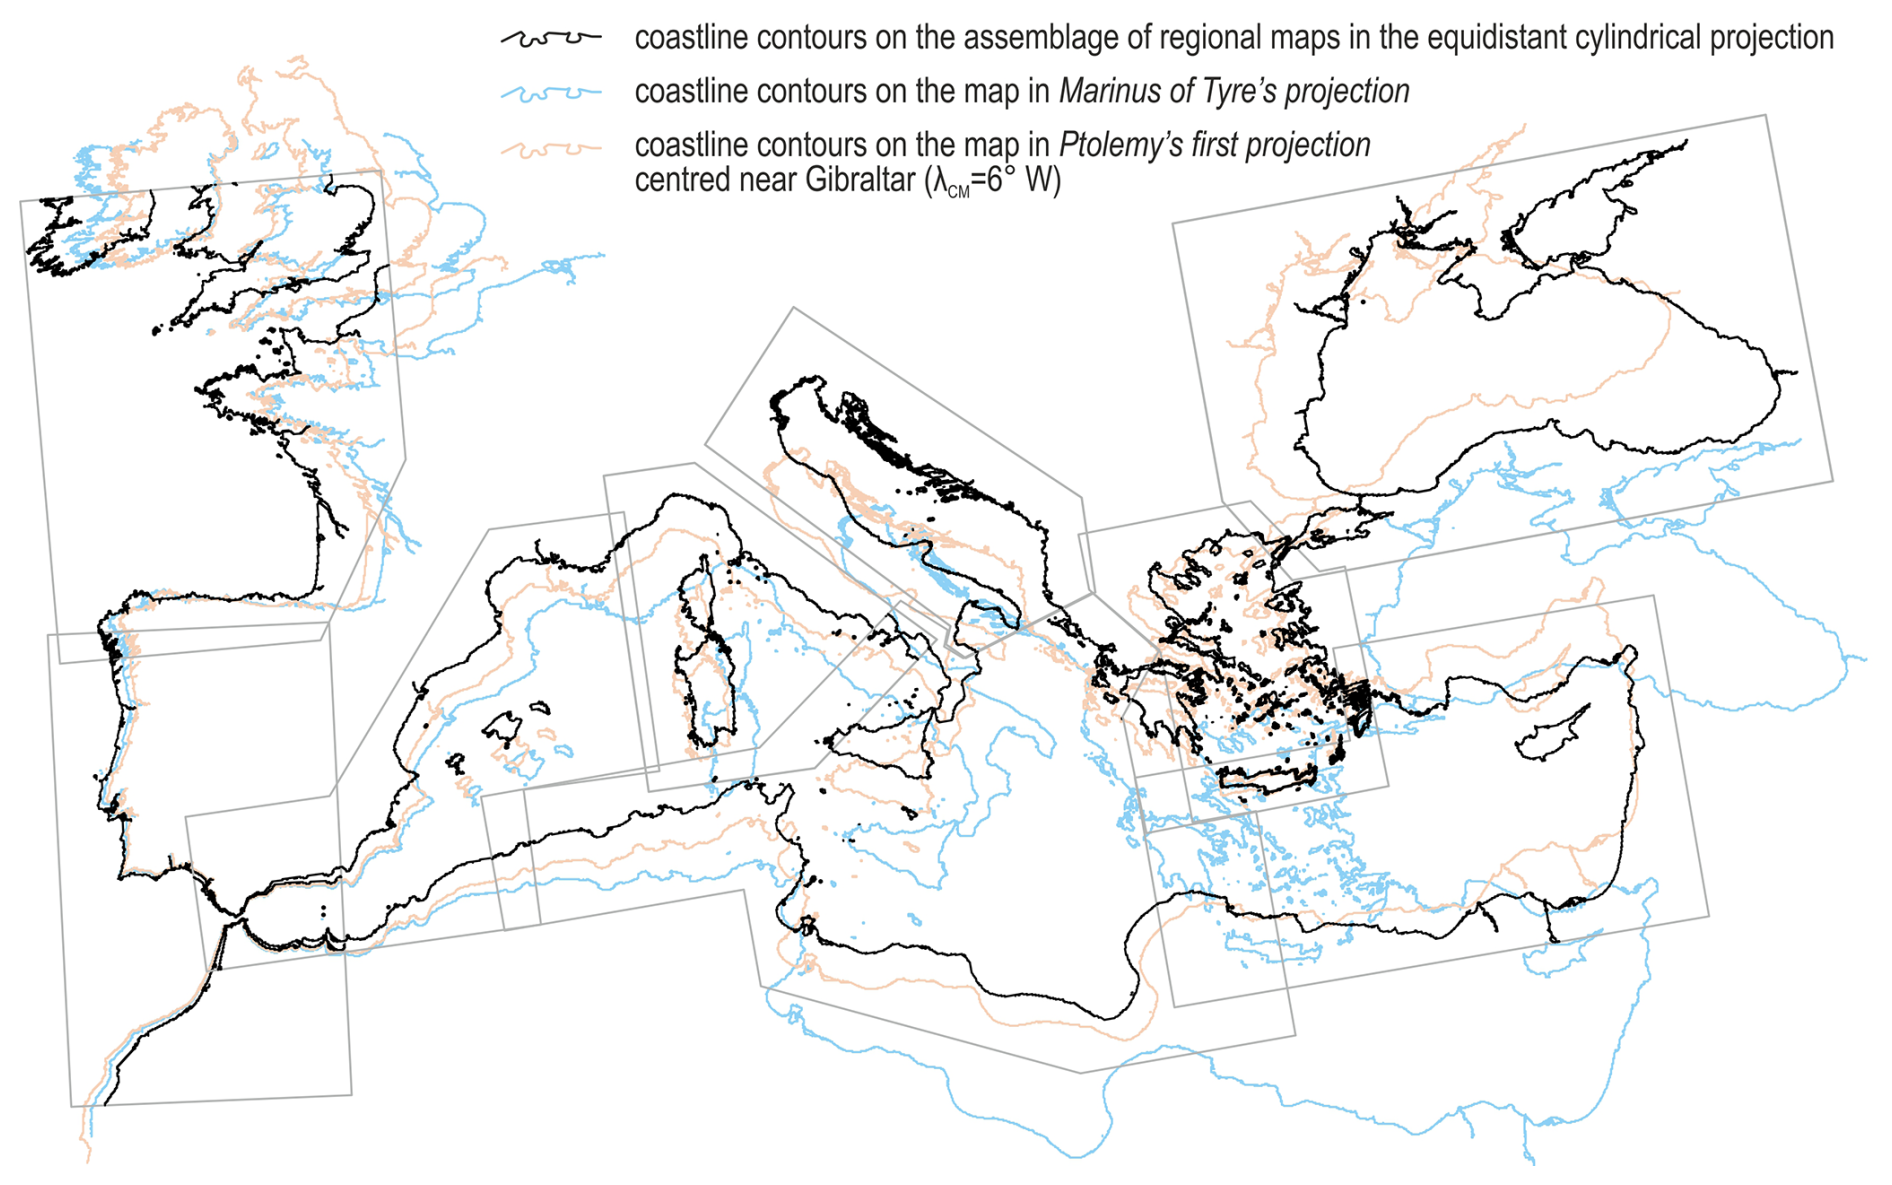
Figure B1The proposed assemblage of nine regional maps in distinct equidistant cylindrical projections that are partially scaled and mildly tilted by going from west to east as a graphical hybrid between the Marinus of Tyre's projection (equidistant cylindrical projection φ0 = 36°) and Ptolemy's first projection (equidistant conic projection φ0 = 36° N) centred near Gibraltar (λCM = 6° W). All three units are rendered to the same scale along the parallel φ0 = 36° N and aligned with geographic north. Basemap shapefile source: http://www.marineregions.org (Claus et al., 2017).
Commercial software with no publicly accessible code was used for every stage of this research, including chart georeferencing, error computations, and graphical editing of figures. QGIS, LibreOffice Calc, and Inkscape can be employed as freeware alternatives.
The anonymous Carta Riccardiana portolan chart (ca. 1300–1325) is property of the Riccardian Library (Biblioteca Riccardiana) in Florence, Italy, call number: Ricc. 3827. The digital reproduction of the chart was acquired via email (b-ricc.riproduzioni@cultura.gov.it) for research purposes on 22 December 2023. An online, non-downloadable high resolution display of the chart is available at: http://teca.riccardiana.firenze.sbn.it/index.php/it/?view=show&myId=a3bf51d6-2a93-4428-8fab-232ac0e11fef&search=carta%20nautica (last access: 5 November 2025).
The author has declared that there are no competing interests.
Publisher's note: Copernicus Publications remains neutral with regard to jurisdictional claims made in the text, published maps, institutional affiliations, or any other geographical representation in this paper. The authors bear the ultimate responsibility for providing appropriate place names. Views expressed in the text are those of the authors and do not necessarily reflect the views of the publisher.
The author would like to thank the reviewers for valuable comments and suggestions, as well as the handling editor Johannes Ihde for believing that shedding light on the past is a challenging effort, and that diverse perspectives and scholarly debates are essential to driving our understanding forward.
This paper was edited by Johannes Ihde and reviewed by Roel Nicolai and one anonymous referee.
Ahmad, S. M.: Cartography of al-Sharif al-Idrisi, in: The History of Cartography, Volume 2, Book 1 – Cartography in the Traditional Islamic and South Asian Societies, edited by: Harley, J. B. and Woodward D., University of Chicago Press, Chicago, 156–174, ISBN 0-226-31635-1, 1998.
Beazley, C. R.: The first true maps, Nature, 71, 159–161, https://doi.org/10.1038/071159a0, 1904.
Berggren, J. L. and Jones, A.: Ptolemy's Geography: An Annotated Translation of the Theoretical Chapters, Princeton University Press, Princeton and Oxford, ISBN 0-691-01042-0, 2000.
Braudel, F.: The Mediterranean and the Mediterranean world in the age of Philip II (trans. Reynolds, S.), Harper & Row, ISBN 978-0520203082, 1972.
Campbell, T.: Portolan Charts from the Late Thirteenth Century to 1500, in: The History of Cartography, Volume 1 – Cartography in Prehistoric, Ancient, and Medieval Europe and the Mediterranean, edited by: Harley, J. B. and Woodward D., University of Chicago Press, Chicago, 371–463, ISBN 0-226-31633-5, 1987.
Claus, S., De Hauwere, N., Vanhoorne, B., Souza Dias, F., Oset García, P., Schepers, L., Hernandez, F., and Mees, J.: Flanders Marine Institute, http://www.marineregions.org (last access: 7 December 2025), 2017.
Clos-Arceduc, A.: L'Énigme des Portulans: Étude sur la Projection et le Mode de Construction des Cartes à Rumbs du XIVe et XVe Siècle. Bulletin du Comité des Travaux Historiques et Scientifiques: Section de Géographie, Tome LXIX – Année, 1956, 215–231, 1956.
Cotrugli, B.: De Navigatione, Naples, archived in Yale University, Beinecke rare book and manuscript library, Call No.: MS 557, https://collections.library.yale.edu/catalog/2005406 (last access: 23 December 2025), 1464.
D'Avezac, A.: Coup d'œil historique sur la projection des cartes de géographie, Imprimerie de E. Martinet, Paris, ISBN 978-1120445261, 1863.
Dilke, O. A. W.: Greek and Roman Maps, Cornell University Press, Ithaca, New York, ISBN 978-0801858970, 1985.
Fiorini, M.: Le Projezioni delle carte geografiche, Bologna, ISBN 978-5872456254, 1881.
Fischer, T.: Sammlung mittelalterlicher Welt-und Seekarten italienischen Ursprungs und aus italienischen Bibliotheken und Archiven, Ferdinand Ongania, Venezia, ISBN 978-5872456254, 1886.
Gaspar, J. A.: The myth of the square chart, e-Perimetron, 2, 66–79, 2007.
Gaspar, J. A.: Dead reckoning and magnetic declination: Unveiling the mystery of portolan charts, e-Perimetron, 3, 191–203, 2008.
Gaspar, J. A.: From the Portolan Chart of the Mediterranean to the Latitude Chart of the Atlantic: Cartometric Analysis and Modelling, Doctoral dissertation, Universidade Nova de Lisboa, Lisbon, https://www.academia.edu/340024/From_the_Portolan_Chart_of_the_Mediterranean_to_the_Latitude_Chart_of_the_Atlantic_Cartometric_Analysis_and_Modelling_PhD_dissertation_ (last access: 22 November 2025), 2010.
Gaspar, J. A.: The origin of nautical cartography: certitudes, doubts, and perplexities, International Journal of Cartography, 11, 63–92, https://doi.org/10.1080/23729333.2023.2240902, 2023.
Gautier Dalché, P.: Carte marine et portulan au XIIe siècle: Le “Liber de existencia riveriarum at forma maris nostri mediterranei” (Pise, circa 1200), Collection de l'École française de Rome, Rome, ISBN 2-7283-0335-5, 1995.
Kelley Jr., J. E.: Perspectives on the Origins and Uses of Portolan Charts, Cartographica, 3, 1–16, https://doi.org/10.3138/Q636-7034-W336-4328, 1995.
Keuning, J.: The history of geographical map projections until 1600, Imago Mundi, 12, 1–24, https://doi.org/10.1080/03085695508592085, 1955.
Korte, M. and Constable, C.: Continuous Geomagnetic Field Models for the Past 7 Millennia II:CALS7K, Geochem. Geophy. Geosy., 6, 1–18, https://doi.org/10.1029/2004GC000801, 2005.
Korte, M. and Constable, C.: Improving Geomagnetic Field Reconstructions for 0–3 ka, Phys. Earth Planet. In., 188, 247–59, https://doi.org/10.1016/j.pepi.2011.06.017, 2011.
Kretschmer, K.: Die italienischen Portolane des Mittelalters, Ein Beitrag zur Geschichte der Kartographie und Nautik, Veröffentlichen des Instituts für Meereskunde und des geographischen Instituts an der Universität, Berlin, WorldCat OCLC no. 9016051, https://search.worldcat.org/title/9016051 (last access: 30 October 2025), 1909.
Krtalić, Š.: Anchoring the image of the sea: Copying coastlines on manuscript nautical charts from the late Middle Ages and the early modern period, Imago Mundi, 74, 1–30, https://doi.org/10.1080/03085694.2022.2042121, 2022.
Lane, F. C.: The Economic Meaning of the Invention of the Compass, Am. Hist. Rev., 68, 605–617, https://doi.org/10.1086/ahr/68.3.605, 1963.
Loomer, S. A.: A cartometric analysis of portolan charts: A search for methodology, Doctoral dissertation, University of Wisconsin-Madison, OCLC no. 17161406, https://search.worldcat.org/title/17161406 (last access: 25 November 2025), 1987.
Marelić, T.: Traces of the Common Origin of Carte Pisane, Cortona Chart and Pietro Vesconte's charts, KN, Journal of Cartography and Geographic Information, 74, 137–156, https://doi.org/10.1007/s42489-023-00154-6, 2024a.
Marelić, T.: Copying-lineages of portolan chart metrics and implications of their pre-medieval origin, International Journal of Cartography, 11, 595–620, https://doi.org/10.1080/23729333.2024.2349974, 2024b.
Marelić, T.: Mosaics Within Mosaics: The Geometry of Portolan Atlases that Contradicts the Medieval Origin Hypothesis, KN, Journal of Cartography and Geographic Information, 75, 57–78, https://doi.org/10.1007/s42489-024-00176-8, 2025a.
Marelić, T.: Are Portolan Charts and Portolan Mile Geometrically Rooted in Classical Antiquity? A Cartometric Analysis of al-Shirazi's “Greek Map” and the Pisane, Lucca, Avignon, and Cortona Charts, Cartographica, 59, 143–160, https://doi.org/10.3138/cart-2024-0029, 2025b.
Marelić, T.: Cartometric Analyses: Methodological Issues and Their Significance for the History of Cartography and Historical Studies in General, in: Early Modern Nautical Charts of the Adriatic Sea, edited by: Faričić, J. and Marelić, T., Palgrave Macmillan, Singapore, 223–248 https://doi.org/10.1007/978-981-96-8046-7_9, 2025c.
Minow, H.: Rätsel der mittelalterlichen Seekarten, Deutsches Schiffahrtsarchiv, 21, 411–428, 1998.
Mittenhuber, F.: The Tradition of Texts and Maps in Ptolemy's Geography, in: Ptolemy in Perspective, Archimedes, vol. 23, edited by: Jones, A., Springer, Dordrecht, 95–119, ISBN 978-90-481-2787-0, 2010.
Modenov, P. S. and Parkhomenko, A. S.: Geometric Transformations, translated by: Slater, M. B. P., Academic Press, New York, London, ISBN 978-1483251264, 1965.
Monmonier, M.: Rhumb Lines and Map Wars: A Social History of the Mercator Projection, The University of Chicago Press, Chicago, London, ISBN 0-226-53431-6, 2004.
Newton, R. R.: The crime of Claudius Ptolemy, Johns Hopkins University Press, Baltimore, ISBN 0-8018-1990-3, 1977.
Newton, R. R.: The strange case of Claudius Ptolemy, Johns Hopkins APL Technical Digest, 16, 11–21, 1979.
Nicolai, R.: A critical review of the hypothesis of a medieval origin for portolan charts, Doctoral dissertation, Universiteit Utrecht, Utrecht, https://dspace.library.uu.nl/handle/1874/291367 (last access: 25 November 2025), 2014.
Nicolai, R.: The enigma of the origin of portolan charts: a geodetic analysis of the hypothesis of a medieval origin, History of Science and Medicine Library, vol. 52, Brill, Leiden, ISBN 978-9004282971, 2016.
Nicolai, R.: The origin problem of nautical cartography: the importance of evidence and method, International Journal of Cartography, 11, 621–645, https://doi.org/10.1080/23729333.2024.2352822, 2024.
Nordenskiöld, A. E.: Periplus: An Essay on the Early History of Charts and Sailing-Directions, translation: Bather, F. A., Norstedt, P. A., and Söner, Stockholm, ISBN 978-1578984541, 1897.
Pujades, R. J.: Les Cartes Portolanes: la Representació Medievald'una Mar Solcada, Institut Cartogràfic de Catalunya, Barcelona, ISBN 978-8497854146, 2007.
Pujades, R. J.: Els mapamundis baixmedievals: del naixement del mapamundi híbrid a l'ocàs del mapamundi portolà/Late Medieval World Maps: From the Birth of the Hybrid to the Demise of the Portolan Mappamundi, Generalitat de Catalunya, Barcelona, ISBN 978-84-19326-89-8, 2023.
Revelli, P.: Cristoforo Colombo e la scuola cartografica genovese, Consiglio Nazionale delle Ricerche, Genoa, 1937.
Ruddock, A. A.: Italian Trading Fleets in Medieval England, Historical Revision No. CVI, 192–202, https://doi.org/10.1111/j.1468-229X.1944.tb02002.x, 1944.
Ruderman, B., Clausen, A., and Allport, H.: The Rex Tholomeus portolan chart of 1360, Barry Lawrence Ruderman Antique Maps Inc., https://commons.wikimedia.org/wiki/File:Rex_Tholomeus_portolan_chart.jpg (last access: 21 December 2023), 2023.
Russo, L.: The Forgotten Revolution: How Science Was Born in 300 BC and Why It Had to Be Reborn, translated by: Levy, S. Springer-Verlag, Berlin, Heidelberg, ISBN 978-3540203964, 2004.
Savadi, F. and Campbell, T.: Qutb al-Dīn al-Shīrāzī's textual map of the Mediterranean Sea (1282) and its evident source in a portolan chart, Imago Mundi, 75, 199–231, https://doi.org/10.1080/03085694.2023.2275418, 2023.
Smith, P. J.: Petrus Peregrinus' Epistola: The Beginnings of Experimental Studies of Magnetism in Europe, Earth-Sci. Rev., 6, A11–A18, https://doi.org/10.1016/0012-8252(70)90006-1, 1970.
Snyder, J. P.: Equidistant Conic Map Projections, Ann. Assoc. Am. Geogr., 68, 373–383, https://doi.org/10.1111/j.1467-8306.1978.tb01201.x, 1978.
Snyder, J. P.: Flattening the Earth: Two Thousand Years of Map Projections, The University of Chicago Press, Chicago, London, ISBN 0-226-76746-9, 1993.
Snyder, J. P. and Voxland, P. M.: An album of map projections, U.S. Geological Survey (USGS) Professional Paper 1453, USGS Federal Center, Denver, ISBN 978-0160033681, 1989.
Steger, E.: Ueber italienische Seekarten des Mittelalters, Doctoral dissertation, Göttingen, 1896.
Stevenson, E. L.: Portolan Charts: Their Origin and Characteristics with a Descriptive List of Those Belonging to The Hispanic Society of America, The Knickerbocker Press, New York, ISBN 978-1017451344, 1911.
Tanguy, J. C.: An archaeomagnetic study of Mount Etna: the magnetic direction recorded in lava flows subsequent to the Twelfth Century, Archaeometry, 12, 115–128, https://doi.org/10.1111/j.1475-4754.1970.tb00014.x, 1970.
Taylor, E. G. R.: The oldest Mediterranean pilot, J. Navigation, 4, 81–85, https://doi.org/10.1017/S0373463300048785, 1951a.
Taylor, E. G. R.: Early charts and the origin of the compass rose, J. Navigation, 4, 351–356, https://doi.org/10.1017/S0373463300034214, 1951b.
Taylor, E. G. R.: The haven-finding art: a history of navigation from Odysseus to Captain Cook, Abelard-Schuman Limited, ISBN 978-0370013473, 1957.
Tibbets, G. R.: The Beginnings of a Cartographic Tradition, in: The History of Cartography, Volume 2, Book 1 – Cartography in the Traditional Islamic and South Asian Societies, edited by: Harley, J. B. and Woodward, D., University of Chicago Press, Chicago, 90–107, ISBN 0-226-31635-1, 1998a.
Tibbets, G. R.: Later Cartographic Developments, in: The History of Cartography, Volume 2, Book 1 – Cartography in the Traditional Islamic and South Asian Societies, edited by: Harley, J. B. and Woodward, D., University of Chicago Press, Chicago, 137–155, ISBN 0-226-31635-1, 1998b.
Tobler, W.: Medieval distortions: The projections of ancient maps, Annual of the Association of American Cartographers, 56, 351–361, https://doi.org/10.1111/j.1467-8306.1966.tb00562.x, 1966.
Tobler, W.: Numerical approaches to map projections, in: Studies in theoretical cartography, edited by: Kretschmer, E., Franz Deuticke, 51–64, ISBN 978-3700544272, 1977.
Tupikova, I.: Ptolemy's Circumference of the Earth, Preprint 464, Max Planck Institute for the History of Science, 2014.
Uhden, R.: Die antiken grundlagen der mittelalterlichen Seekarten, Imago Mundi, 1, 1–19, https://doi.org/10.1080/03085693508591806, 1935.
Wagner, H.: The Origin of the Mediaeval Italian Nautical Charts, Report of the Sixth International Geographical Congress London, Royal Geographical Society, 695–705, 1896, reprinted in: Acta Cartographica, 5, 476–485, 1969.
Winter, H.: The true position of Hermann Wagner in the controversy of the compass chart, Imago Mundi, 5, 21–26, https://doi.org/10.1080/03085694808591900, 1948.
Winter, H.: The Origin of the Sea Chart, Imago Mundi, 13, 39–44, https://doi.org/10.1080/03085695608592124, 1956.
Woodward, D.: Medieval Mappaemundi, in: The History of Cartography, Volume 1 – Cartography in Prehistoric, Ancient and Medieval Europe and the Mediterranean, edited by: Harley, J. B. and Woodward, D., University of Chicago Press, Chicago, 286–370, ISBN 0-226-31633-5, 1987.
- Abstract
- Differences in scholarly perspectives regarding the origin of spatial data underlying portolan charts
- Outlining the findings, scope, and framework of this research
- The arrival of the magnetic compass in the Mediterranean and its development
- Initial scholarly insights into geometry and origin of portolan charts
- The adoption and spread of computer technology in cartometric studies of portolan charts
- Extensive cartometric studies of portolan chart geometry and the origin of their spatial data
- How Pietro Vesconte might have assembled the Carta Riccardiana using sources from classical antiquity
- Conclusions: summarising the classical antiquity origin of spatial data underlying portolan charts
- Appendix A
- Appendix B
- Code availability
- Data availability
- Competing interests
- Disclaimer
- Acknowledgements
- Review statement
- References
Please read the editorial note first before accessing the article.
- Article
(26743 KB) - Full-text XML
- Abstract
- Differences in scholarly perspectives regarding the origin of spatial data underlying portolan charts
- Outlining the findings, scope, and framework of this research
- The arrival of the magnetic compass in the Mediterranean and its development
- Initial scholarly insights into geometry and origin of portolan charts
- The adoption and spread of computer technology in cartometric studies of portolan charts
- Extensive cartometric studies of portolan chart geometry and the origin of their spatial data
- How Pietro Vesconte might have assembled the Carta Riccardiana using sources from classical antiquity
- Conclusions: summarising the classical antiquity origin of spatial data underlying portolan charts
- Appendix A
- Appendix B
- Code availability
- Data availability
- Competing interests
- Disclaimer
- Acknowledgements
- Review statement
- References