the Creative Commons Attribution 4.0 License.
the Creative Commons Attribution 4.0 License.
Historical evolution of the geomagnetic declination at the Royal Observatory of Madrid
Jose Manuel Tordesillas
Francisco Javier Pavón-Carrasco
Alberto Nuñez
Ana Belén Anquela
The agonic line, which represents geomagnetic declinations of 0°, recently crossed the Royal Observatory of Madrid (ROM) in December 2021, causing a shift in declination values from west to east. This event constitutes a notable milestone for this significant observatory, where the first geomagnetic observation series commenced around 1855 in Spain. In this work, taking advantage of the occurrence of this event, a detailed study has been conducted to investigate the historical evolution of the magnetic declination at the ROM to decipher prior occurrences of the agonic line crossing this place. Despite the ROM having hosted the first series of geomagnetic measurements in Spain, the present lack of geomagnetic measurements in this observatory makes it necessary to extend the declination measurements to other observatories distributed throughout the Iberian Peninsula to better define the passage of the agonic line since 1855 up to the present. For epochs prior to 1855, a bibliographic search for declination measurements conducted in the Iberian Peninsula has been carried out, complemented by historical data from the HISTMAG database. As a result, a time-continuous curve of geomagnetic declination is generated from 1590 to 2022 at the ROM coordinates. The declination curve reveals that the agonic line also crossed the ROM 400 years ago (around 1600), passing from western to eastern declination values.
- Article
(7327 KB) - Full-text XML
-
Supplement
(1736 KB) - BibTeX
- EndNote
At the end of 2021, the agonic line (magnetic-declination line with 0° values) crossed the Royal Observatory of Madrid (ROM), changing the declination on this place from western values to eastern values. According to the Geomagnetic Reference Model for the Iberian Peninsula and Balearic Islands (also named the Geomagnetic Iberian Model, Puente-Borque et al., 2023; more information is in Sect. S1 of the Supplement), this event occurred on 12 September 2021 (see Fig. 1). The interest in this event, considering the facts that the ROM does not have a long tradition in geomagnetism and that it was never equipped with variometers for continuous recording, comes from the fact that the first regular declination observations in Spain were made in this place.
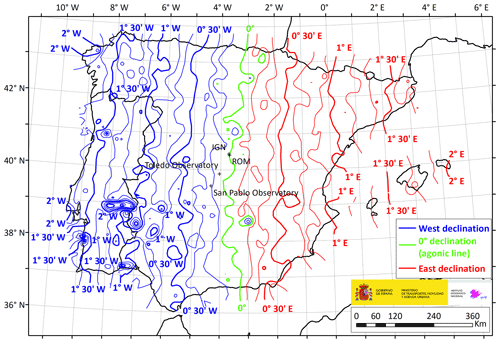
Figure 1Declination map of the Iberian Peninsula for 12 September 2021 according to the Geomagnetic Reference Model for the Iberian Peninsula and Balearic Islands.
The event was monitored by Instituto Geográfico Nacional (IGN), showing, in near-real time, the declination deduced for the Royal Observatory of Madrid between 2021 and 2023 (see Sect. S2). To get the real-time declination at the ROM, we transfer the declination data observed at San Pablo de los Montes Observatory (SPT), the closest Spanish observatory (110 km away from the ROM). The spatial transference of the declination data from the SPT site to the ROM coordinates was carried out using the spatial gradient provided by the Geomagnetic Iberian Model. Original daily mean declination data from SPT and the data transferred to the ROM are plotted in Fig. 2a for the period 1 January 2021 to 1 January 2023. The transferred data indicate that the agonic line crossed the ROM around 6 December 2021. Note that the difference between the date given in Fig. 1 (12 September 2021) and its equivalent in Fig. 2a (6 December 2021) is due to the magnetic anomalies beneath both the ROM and STP observatories (the so-called anomaly biases) that slightly perturb the declination values given by the main geomagnetic field.
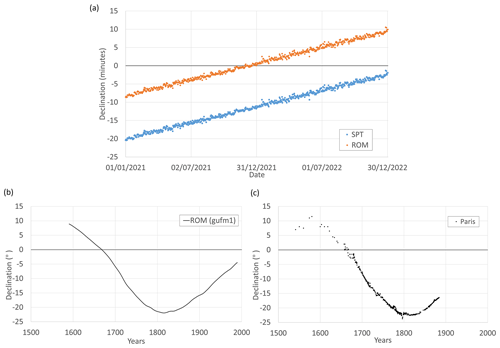
Figure 2(a) Daily mean declination data recorded at SPT observatory and the transferred declination data at the ROM observatory. Declination data are transferred from SPT to the ROM using the spatial-declination gradient derived from the Geomagnetic Iberian Model. (b) Annual mean declination values at the ROM estimated from the gufm1 model. (c) Historical records of declination in Paris.
Here, we also focus our analysis on previous crossings of the agonic line at the ROM during the historical period covered by instrumental geomagnetic data, i.e. the last 4 centuries. At first glance and according to the historical geomagnetic reconstruction of gufm1 based on a complete compilation of historical observations, mainly conducted by means of naval shipping (Jackson et al., 2000), it seems that the last time that this event occurred was around 1668 (Fig. 2b). This epoch is in agreement with the declination data recorded in other French geomagnetic observatories (Alexandrescu el al., 1996; Mandea and Le Mouël, 2016) close to Spain (Fig. 2c). This previous crossing by the agonic line was characterised by an eastward drift; i.e. the declination changed from eastern to western values.
In summary, the goal of this work is to highlight the historical significance of the Royal Observatory of Madrid, which served as the first site for geomagnetic measurements in Spain. Additionally, we have compiled a comprehensive dataset of Spanish geomagnetic declinations derived from a variety of sources and spanning the last 4 centuries. Furthermore, we transferred all the declination data to the ROM coordinates to develop a time-continuous declination curve that allows for a determination of the epochs at which the agonic line crossed the ROM observatory during the last centuries.
In 1785, King Carlos III of Spain decided to establish an astronomical observatory in Madrid and commissioned its design to the renowned architect Juan de Villanueva (Tinoco, 1951). Its construction began around 1790 near the Buen Retiro Palace. Concurrently, experts were recruited to work at the observatory, and a collection of instruments was acquired. However, just as the works were completed, the Napoleonic invasion of Spain in 1808 led to the destruction of documentation and instrumentation, resulting in significant damage to the observatory building, which was abandoned for years. Reconstruction began in 1846, including the training of new staff and the acquisition of new instruments. By 1851, the Royal Observatory of Madrid was operational (Fig. 3 shows a picture of the observatory taken in 1853).

Figure 3The Royal Observatory of Madrid in 1853 (source: Biblioteca Nacional de España, http://bdh.bne.es/bnesearch/detalle/bdh0000027343, last access: 23 October 2024).
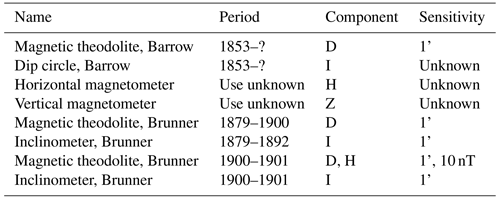
In addition to the astronomical section, the new observatory incorporated a meteorological division, acquiring the first geomagnetic instruments in 1853 (Real Observatorio de Madrid, 1867): (a) two magnetometers to measure the horizontal and vertical forces, with their corresponding telescopes; (b) one Barrow theodolite to determine the magnetic declination; (c) one Barrow dip circle; and (d) two magnetised bars with their armours (see Table 1). These instruments were operated by Mr. Rico Sinobas, who was responsible of the meteorological observations, performing the first series of geomagnetic declination and inclination measurements in the month of September of 1855. This constituted the first continuous time series of geomagnetic observations made in a location of the Iberian Peninsula (Rico Sinobas, 1856; see also Tables S1 and S2 and Figs. S1 and S2).
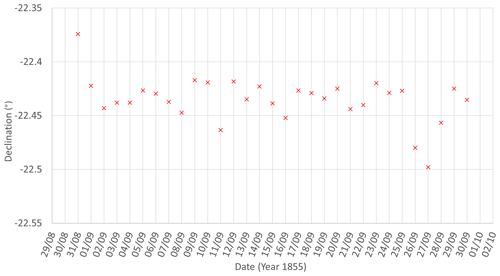
The declination series of observations were adjusted to the recommendations of relevant contemporary magnetic observatories, referring to the times given by the observatory of Göttingen (Germany) and measuring during the hours of maximum and minimum variation. Two daily declination measurements were observed at 02:30 and at 20:00 (it seems that the time recorded here is the astronomical time, and it is necessary to add 12 h to get the Universal Time). Meanwhile, inclination measurements (only seven inclination measurements were observed during the month) are consigned to be made at 09:00 (in the morning) or at 15:00 (in the afternoon). We have digitised the magnetic-declination data obtained by Rico Sinobas, and the daily mean values are plotted in Fig. 4.
To evaluate the Sinobas declination data, we have compared them with the declination given by the historical geomagnetic model gufm1 for the same period and coordinates. The gufm1 model provides a value of 20°19′ W about 2° of difference compared to the Sinobas series. This difference could be due to the anomaly bias that characterised the crustal field beneath the ROM (this anomaly bias is not considered in the gufm1 model, which only provides the main geomagnetic field). However, a difference of 2° is too large to be considered to be of crustal origin. In fact, this issue was already highlighted by De Prado (1858) after reviewing the declination values obtained by Lamont during his campaign in Spain to create an European magnetic chart (Lamont, 1858). The value measured by Lamont for Madrid on 1 July 1857 was 20°12′ W, which closely aligns with the gumf1 model predictions. As a possible explanation, it was supposed that the measurements made by Rico Sinobas were influenced by the large masses of iron used in the construction of the observatory building. Although this constant local influence seems not to affect the recorded time variability in declinations (with a maximum difference of about 13.5′ between the maximum and minimum values), this set of data is not useful for the purpose of our analysis.
Regarding the rest of the geomagnetic instruments at the ROM, no measurements made with the magnetometers of H and Z have been found. These instruments are missing, with exception of the Barrow theodolite (see Fig. 5a) that is still preserved and exhibited at the ROM and detailed in Instituto Geográfico Nacional (2012).
In 1878, a Brunner theodolite and a Brunner inclinometer were acquired (Fig. 5b, c). These instruments were installed as far as possible from any potential sources of disturbance that could distort the measurements. After 1 year, in 1879, regular observations of magnetic declination and inclination began at the ROM (Real Observatorio de Madrid, 1890). The inclinometer broke down in 1892. In 1900, a new collection of magnetic instruments was acquired, consisting of a Brunner theodolite and a Brunner inclinometer (Fig. 5d) manufactured by the company Salmoiraghi, Milano (Batlló, 2005; Instituto Geográfico Nacional, 2012). These details of these instruments are summarised in Table 1, and most of them can be visited in the ROM's exhibition hall of historical instruments.
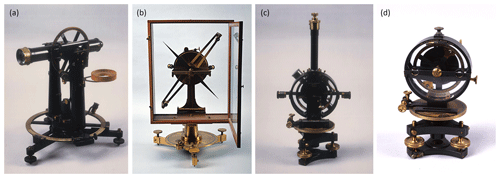
Figure 5Magnetic instruments used in the Royal Observatory of Madrid (source: IGN archive, ©Instituto Geográfico Nacional, CC-BY 4.0 ign.es): (a) magnetic theodolite, Barrow (1853); (b) inclinometer, Brunner (1879); (c) magnetic theodolite, Brunner (1900); (d) inclinometer Brunner (1900).
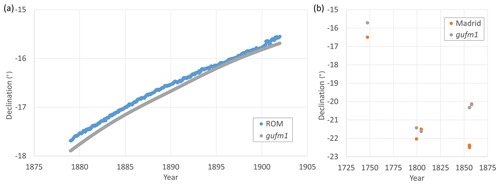
The ROM geomagnetic observations were carried out between 1879 and 1901, published in the historical yearbooks from 1890 to 1904, and they were interrupted from 1902 due to the increase in electrical installations near the observatory (Instituto Geográfico y Catastral, 1933). Declination measurements were made every day at 08:00 and 13:30 (local time), close to the maximum and minimum daily values of this element, but the yearbooks published by the ROM only provide values averaged every 10 d. Pro et al. (2018) digitised these declination data and compared them with the gufm1 model, providing a good agreement between data and the model, with better stability over the years and increasing differences from 1897 (see Fig. 6a).
The series measured by Rico Sinobas during September 1855 and other previous declination values for the city of Madrid that were noted by him (Rico Sinobas, 1856) are also shown in Fig. 6b (the full dataset recompiled by Rico Sinobas is given in Fig. S3). We have also estimated the declination values for these epochs using the gufm1 model (see Fig. 6b). Results show discrepancies between the Spanish declination measurements and the model predictions that increase for epochs before 1880. After 1904, the ROM was integrated into the IGN, and no further magnetic measurements were conducted at this location.
As can be seen in Fig. 6, the amount of declination data available for the coordinates of the ROM is very scarce, and it is impossible to define a declination curve using only these data covering the last centuries. In the following section, we present other sources of data that will help to solve this problem.
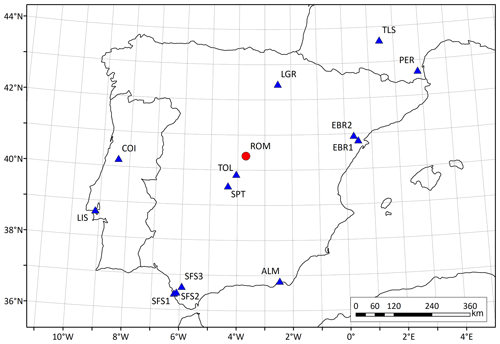
The Royal Observatory of Madrid was the first observatory in Spain to take regular measurements of the magnetic field as part of the meteorological observations. Unfortunately, it was not a specific geomagnetic observatory with continuous recording of the magnetic field. However, in Spain, a network of geomagnetic observatories has been in operation since the late 19th century, with their numbers having steadily grown throughout the 20th century (see their locations in Fig. 7). Many of these observatories continue to function to this day. Here, we provide a brief summary of their history.
3.1 San Fernando Observatory (SFS)
The Spanish navy installed this geomagnetic observatory as a part of the Astronomical Observatory of San Fernando (San Fernando, Cádiz). In addition to those at the ROM, regular geomagnetic observations were started in 1879 (see Fig. 8a) but with more facilities: one independent pavilion constructed without magnetic elements, isolated and buried, where the magnetometers were installed (Azpiazu and Gil, 1919).
The observatory was equipped with a set of magnetographs (Adie) that continuously recorded the variations of the geomagnetic field. In addition, a magnetometer (Elliot Scientific) and an inclinometer (Dover) were available to make absolute measurements. The recorded data from the SFS observatory have been published without interruption in the observatory's yearbooks from 1891 until now.
In the decade of the 1970s, the railway electrification of the Cádiz–Sevilla line caused significant interferences in the geomagnetic records. For that reason, the geomagnetic observatory was moved to a new location 8 km northeast of the original location, in Puerto Real (Cádiz). It was operative from 1978 until 2004 (Real Instituto y Observatorio de la Armada en San Fernando, 2021). However, after detecting new interferences in the geomagnetic records, it was moved to a new location with more stable geomagnetic conditions. The new SFS observatory is located in Cortijo Garrapilos, Jerez (Cádiz), and it has been operative since 2005. This observatory has been a member of INTERMAGNET since 2005 under the IAGA code SFS.
3.2 Ebro Observatory (EBR)
Ebro Observatory was founded in 1904 by the Society of Jesus with the aim of studying the Sun–Earth relations. It was located in the town of Roquetes (Tarragona) (Batlló, 2005). The Ebro observatory began to record periodic measurements of the geomagnetic field in 1905, although the publication of regular results started in 1910 (Observatorio del Ebro, 1910). As noted by Azpiazu and Gil (1919), Ebro Observatory had an excellent location, away from possible disturbances originating from electric currents, iron masses and geological formations. This observatory had two pavilions specifically built to carry out geomagnetic measurements. The first one was dedicated to taking absolute measurements with a Dover unifilar magnetometer, a Schulze dip inductor and a Plath galvanometer. The second pavilion was properly buried and isolated, and it was dedicated to the study of geomagnetic variations. It was equipped with Mascart variometers for the photographic recording of magnetic elements.
Ebro Observatory published annual bulletins between 1910 and 1937, when the Spanish Civil stopped its activity. After a break of 6 years, it started to work again in 1943, but annual bulletins were not published until 1995. Since 2002, Ebro Observatory has been a member of INTERMAGNET with the IAGA code EBR. Due to electromagnetic interferences produced in the records because of the city growth, the variometric station was transferred in 2001 to Horta de Sant Joan, 20 km away from the observatory. Since 2012, the measurements have been conducted with reference to a new main pillar built at Horta de Sant Joan (Observatorio del Ebro, 2013).
3.3 IGN observatories
In 1912, the IGN started the work for the generation of the Spanish geomagnetic map, which was finally published for the epoch 1924.0 (Instituto Geográfico y Catastral, 1927). The measurements of the geomagnetic field carried out along the Iberian Peninsula were conducted in reference to Ebro Observatory. This observatory was characterised by fairly good-quality data but a very eccentric location within the Iberian Peninsula, being located in the northeastern corner of the Iberian Peninsula. This circumstance was a problem when it came to considering this observatory as the reference observatory for the national geomagnetic cartography. Due to this fact, the IGN decided to install its own geomagnetic observatory in the centre of the Iberian Peninsula. This new geomagnetic observatory was initially projected in the city of Alcalá de Henares, but it was finally built in the city of Toledo (Azpiazu and Gil, 1919). This marked the beginning of the expansion of geomagnetic observatories by IGN, a journey that persisted throughout the 20th century.
After the celebration of the International Geophysical Year (IGY, 1 July 1957 to 31 December 1958), the IGN reached an agreement with the International Union of Geodesy and Geophysics (IUGG) to increase the density of geomagnetic observatories in Spain. Then, new permanent observatories were established on the mainland of Spain in the cities of Almería and Logroño. In addition, two more observatories (Miguel Lafuente, 1964) were established in Santa Cruz de Tenerife (Tenerife Island, Canary Islands) and Moca (Fernando Poo Island, Equatorial Guinea), but they are far from the Iberian Peninsula and have not been taken into account in this work. At present, the IGN has two observatories in operation: one in San Pablo de los Montes (Toledo) and the other one in Güímar (Tenerife Island, Canary Islands). A brief description of the mentioned observatories is given below (only for the observatories involved in this study).
3.3.1 Toledo and San Pablo de los Montes observatories
Taking advantage of the construction of the new Geophysical Observatory of Toledo in the Buenavista estate on the outskirts of the city, a magnetic section was established along with it (Sancho de San Román, 1951; Payo and Gómez-Menor, 1998). In January 1935, the IGN proposed the establishment of a new magnetic map of Spain, which was started in 1936. Thus, the works to start the operation of the Toledo Observatory were accelerated to give assistance to the field measurements (Payo and Gómez-Menor, 1998). The so-called magnetic section started to run in 1936 with a set of Askania variometers, but the Spanish Civil War produced a cessation of activity from 31 August 1936 up to 1941, when the activity in the geomagnetic observatory resumed but provided rather disturbed data due to conditioning works (Sancho de San Román, 1951). After 1947, the geomagnetic observatory was fully operative, and yearbooks began to be published without interruption. Besides the Askania variometers, the observatory was equipped with a set of Toepfer variometers and several instruments to take absolute measurements: one Schimdt magnetic theodolite, one Askania terrestrial inductor and one Carnegie magnetometer (Payo and Gómez-Menor, 1998). The Toledo geomagnetic observatory was operative until 1981. In the decade of the 1970s, the growth of the city and, in particular, the railway electrification produced significant disturbances within geomagnetic records, mainly in the hours of departure and arrival of trains from and at Toledo train station.
Table 2Observatories used in this study.
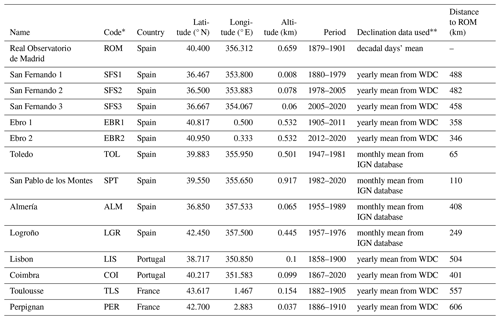
∗ All codes are IAGA codes except for the ROM code. WDC refers to the World Data Centre, and IGN refers to Instituto Geográfico Nacional.
For this reason, the IGN projected different magnetic surveys in the Montes de Toledo mountain range to build a new observatory. Finally, a suitable location was found in the town of San Pablo de los Montes, where magnetic anomalies were minimal. In 1974, a plot of 10 Ha was acquired to build the new observatory (Payo and Gómez-Menor, 1998). The construction of this observatory finished in 1978, and a part of the geomagnetic instruments of Toledo Observatory were transferred to San Pablo Observatory (SPT according to the IAGA codes). From then, constant cross-checking work was carried out over a period of 2 years between both observatories. In 1982, SPT Observatory definitively replaced Toledo Observatory and started publishing their yearbooks. At present, San Pablo Observatory is still in operation and has become the reference observatory of IGN for geomagnetic works. Furthermore, it has been a member of the INTERMAGNET network since 1992.
3.3.2 Almería Observatory
In 1949, the IGN decided to expand the seismic station of Almería, created in 1911, with a geomagnetic section. New geomagnetic pavilions were projected, the works of which ended in 1954 (Morencos, 1964). This observatory was equipped with a set of La Cour variometers to record the variations in the geomagnetic field. The absolute instrumentation initially available was one declinometer with an oscillation box by Sartorius and one earth inductor by Wind. They were updated by one earth inductor (Askania Werke) and a set of Anderson & Sorensen instruments: a quartz horizontal magnetometer (QHM) and a balance magnetometer zero (BMZ). With the new instrumentation, Almería Observatory could take continuous measurements from 1 January 1955. These were published continuously in the yearbooks of the observatory until 1989 when the observatory stopped its activity. The growth of the city of Almería that surrounded the observatory had made it that the measurements were highly disturbed.
3.3.3 Logroño Observatory
Logroño Observatory was built by the IGN 5 km west of this city. The observatory construction started with the geomagnetic pavilion, with the aim of being operative for the IGY. The geomagnetic observatory started to work on 8 July 1957, coinciding almost completely with the beginning of the IGY (Miguel Lafuente, 1964). The instrumentation initially installed at Logroño Observatory was a set of La Cour variometers for the recording of continuous variations. Besides this, there were the following instruments used to take absolute measurements: a magnetic theodolite with its oscillation box, a Sartorius earth inductor, a torsion magnetometer QHM and a balance magnetometer BMZ. This observatory was continuously running and publishing their yearbooks until 1976, when it stopped its activity.
4.1 Declination data from Spanish and surrounding observatories
The data from the Spanish observatories described in the previous section have been used in this study to provide declination information at the ROM coordinates. Table 2 summarises the information on these observatories, including the period they were or have been in operation. The yearly mean declination values obtained from the yearbooks published for San Fernando Observatory and Ebro Observatory are shown in Fig. 8a. The monthly mean values of declination of the IGN observatories obtained from the IGN database (Instituto Geográfico Nacional, 2024) are shown in Fig. 8b.
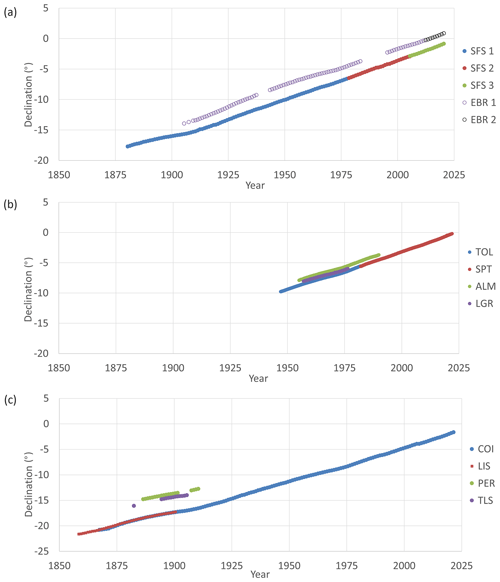
Figure 8Evolution of magnetic declination: (a) San Fernando and Ebro observatories, (b) IGN observatories, (c) surrounding observatories.
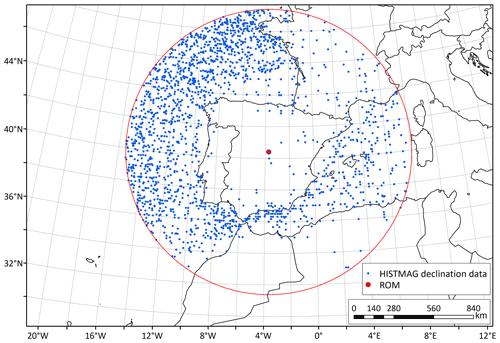
Figure 9Declination points selected from HISTMAG database. Red point corresponds to the ROM coordinates (40.4000° N, 3.6879° W). The radius of the spherical cap is 1000 km.
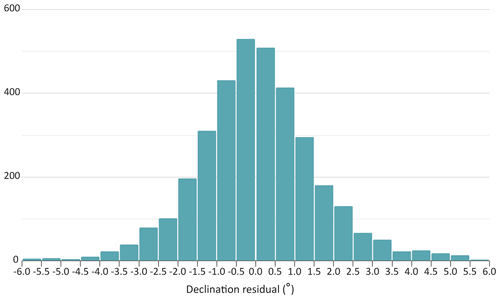
Figure 10Residuals from the comparison between HISTMAG declination data with those given (for the same time and location) by the gufm1 model.
In our study, we have also considered the declination measurements made at other geomagnetic observatories near Spain, situated in Portugal and southern France. In Portugal, the geomagnetic observatory with the greatest tradition recording and measuring the Earth's magnetic field is the one of the Instituto Geofísico da Universidade de Coimbra. This observatory started to work in 1866, although, in 1931, it had to be transferred to a new location in Alto de Balaia Street to avoid the disturbances induced by the power lines (Custodio de Morais, 1953). This observatory is still working today (as COI in the IAGA codes); thus, it has the longest geomagnetic measurement series of the Iberian Peninsula and one of the longest series in the world. The annual mean values of this series are published in the World Data Centre for Geomagnetism (WDC) and are continuously updated. A homogenised revision of the Coimbra Observatory data (Morozova et al., 2021) has recently been published, but no significant differences are observed for the purpose of our study, and, thus, we have considered the previous data published by the WDC. The declination values of this series are shown in Fig. 8c. Besides this, geomagnetic measurements were made in Portugal, in the city of Lisbon, from the year 1858 at Observatorio do Infante D. Luiz (Observatorio do Infante D. Luiz, 1863). This observatory published, from that year, the annual results of its measurements of the different components of the geomagnetic field, and it was operational until 1900. The installation of electric lines for the tram near the observatory disturbed the normal operation of the magnetic instruments, and it was impossible to use their measurements from that date (Observatorio do Infante D. Luiz, 1904). The declination values of this series, extracted from the yearbooks published by this observatory, are shown in Fig. 8c. Information on these observatories in Portugal is shown in Table 2.
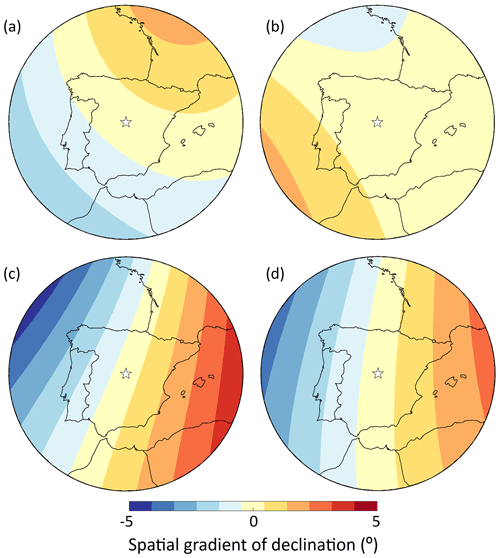
Figure 11Spatial gradient map of the declination during four different epochs. Maps for (a) 1600 and (b) 1750 were estimated by the gufm1 model, and the (c) 1900 and (d) 2020 maps were produced by the Cov-Obs.x2 model. The white star corresponds to the ROM coordinates (40.4000° N, 3.6879° W).
In the south of France, there were also two geomagnetic observatories located in the cities of Toulouse and Perpignan. They started to record the geomagnetic field at the end of the 19th century, but they stopped at the beginning of the 20th century; thus, the measurement series obtained by them are very short. The annual mean values of the geomagnetic components measured at these observatories are also available at the WDC. For Toulouse Observatory, the series began in 1882, although these only have continuity between 1894 and 1905. For Perpignan Observatory, the series cover the period from 1886 to 1910, although these present a gap of data between 1902 and 1906 (see Table 2). Figure 8c also shows the declination values corresponding to these observatories in southern France.
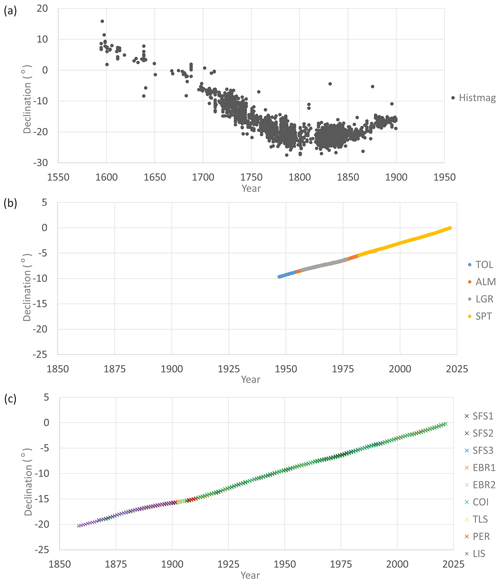
Figure 12Declination data transferred to the ROM coordinates, which have been separated into different panels for a better visualisation: (a) HISTMAG historical data, (b) IGN observatory data, (c) other observatory data.
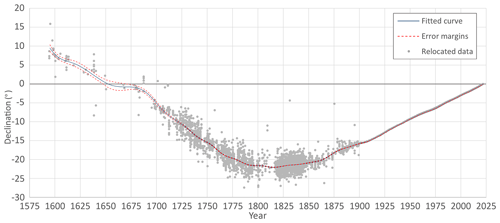
Figure 13Fitted declination curve obtained for the Royal Observatory of Madrid and its error margins at 1σ. In the background, all transferred (or relocated) historical and instrumental data used for curve fitting are plotted by grey dots.
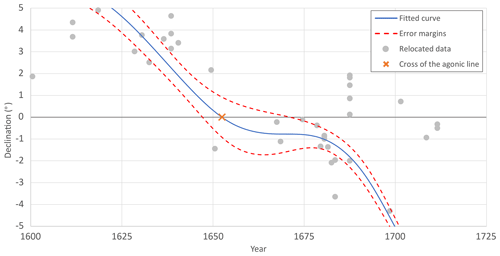
Figure 14Detail of the declination curve obtained, showing the crossing of the Royal Observatory of Madrid by the agonic line around the year 1652. Dashed red lines show the error margins of the declination curve. In the background are transferred (or relocated) data that have been used for curve fitting.
4.2 Declination historical data
Based on the previous compilation, the recorded geomagnetic observatory data in the Iberian Peninsula and surrounding areas date back to the latter half of the 19th century. These records offer a good temporal coverage, spanning from that period to the present day. In order to add more information with regard to declination data prior to the observatory epoch, we have considered the information available from the HISTMAG database (Arneitz et al., 2017). This database has integrated a large amount of historic geomagnetic data from all around the world, including archaeomagnetic and volcanic data. The historical compilation is mainly based on the previous compilation of Jonkers et al. (2003) that brings together a huge amount of data obtained during naval trips and measurements made on land. In addition, HISTMAG completed the Jonkers database with historical information from other sources, including measurements made for mining, sundials, cartography, etc. For the purpose of this work, we made a query of the HISTMAG database (Conrad Observatorium, 2024), considering a spherical cap with its centre at the ROM and a radius of 1000 km. The historical declination data cover the period from 1500 to 1900. Figure 9 shows a map with the spatial distribution of the selected data.
The result of the query provided a total of 3512 declination records. To check the initial quality of these data, we conducted a comparison of them with the data provided by the geomagnetic model gufm1 using the coordinates of the points and the dates of their records, extracted from the database. The results, in terms of declination residuals, are shown in Fig. 10. The residuals follow a normal distribution, with a centre in 0.05° and a standard deviation of 1.68°. This was expected since the major parts of these data were used in the construction of the gufm1 model. Therefore, we have considered it to be that these data are suitable to be used in this study.
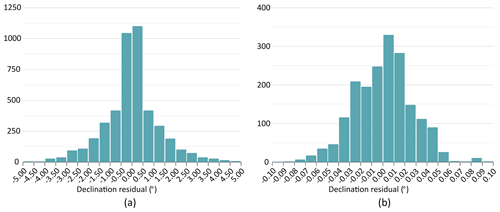
Figure 15Distribution of residuals between original data and the fitted declination curve of the ROM: (a) histogram of residuals for the historical data series; (b) histogram of residuals for the instrumental data series.
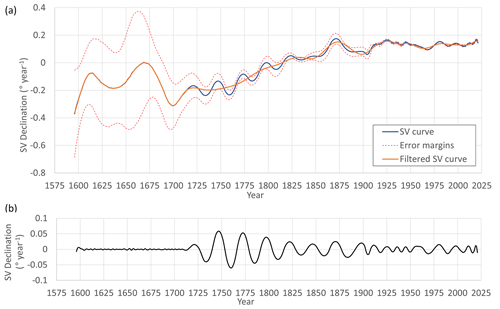
Figure 16(a) Secular-variation curve obtained for the Royal Observatory of Madrid and its error margins at 1σ of probability and a filtered secular-variation curve, removing periods shorter than 25 years. (b) Solar contribution to the secular-variation curve (residual between the blue and orange curves in (a)).
4.3 Transfer of all the declination data to ROM coordinates
As indicated in the previous sections, the magnetic-declination measurements recorded in the ROM are very scarce. They only cover some decades at the end of the 19th century. For this reason, if one wants to analyse the time evolution of the declination element at the ROM coordinates, we need to transfer the rest of the declination measurements (i.e. the observatory data from the Iberian Peninsula and the south of France and all the historical data of the HISTMAG database) from the original locations to the ROM coordinates. This declination database will provide information about the declination at the ROM coordinates over the last 450 years. To transfer the declination data from the original locations to the ROM coordinates (40.4000° N, 3.6879° W), we use the declination spatial gradient estimated from the gufm1 model from 1590 to 1840 and the most recent model, Cov-Obs.x2 (Huder et al., 2020), from 1840 to the present day. To do that, we estimate, for a certain time, the difference in declination for the original location and the value given at the ROM coordinates. Then this difference, taken as a spatial gradient, is added to the original declination data, providing the transferred value. In Fig. 11, we show the value of the declination gradient within the spherical cap of Fig. 8 for four different epochs (1600, 1750, 1900 and 2020) according to these two geomagnetic models.
Figure 12a shows the result of applying the spatial-gradient method to the historical data obtained from the HISTMAG database. In Fig. 12b, the transferred declination data from the IGN observatories (Toledo, Almería, Logroño and San Pablo de los Montes) from which we have monthly mean declination values are shown. In addition, Fig. 12c shows the same result for data measured at other observatories of the Iberian Peninsula and the south of France (San Fernando, Ebro, Coimbra, Lisbon, Perpignan and Toulouse) from which the annual mean declination values are available. The transferred declination data reveal a clear difference between the observatory data and the historical observations compiled in HISTMAG. The historical observations transferred to ROM exhibit significant dispersion (Fig. 12a) due to their inherent characteristics (see Jackson et al., 2000). However, the observatory data show good agreement after being relocated to ROM coordinates (Fig. 12b, c).
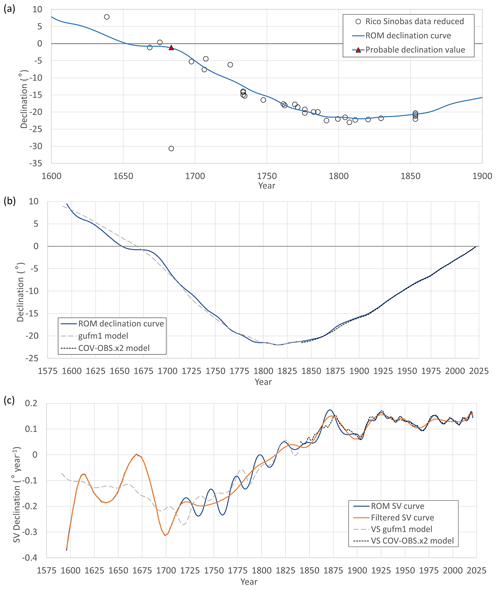
Figure 17(a) Declination curve obtained for the Royal Observatory of Madrid and declination values collected by Rico Sinobas and reduced to the ROM coordinates. The probable value for the wrong declination of Lisbon in 1683 is shown by a red triangle. (b) Declination curve obtained compared with the declination predicted by the gufm1 and Cov-Obs.x2 models. (c) Obtained and filtered secular-variation curves compared with the secular variation predicted by gufm1 and Cov-Obs.x2 models.
5.1 Declination curve at ROM
With the declination data transferred to the ROM coordinates shown in Fig. 12, we have generated a time-continuous curve for the declination from 1590 up to the present day. To obtain the curve, we have applied a bootstrapping method (similar to that of Thébault and Gallet, 2010) taking into account the declination uncertainty of each individual datum. In the curve construction, the temporal domain is expressed by means of cubic B-splines with knot points every 5 years. The sets of data have been ranked into two categories: the historical data that cover from the earliest times up to 1900 and the instrumental series covering from 1900 to the most modern values. To provide a smooth declination curve, the cubic B-splines are penalised by minimising the second time derivative of the declination curve by means of a damping temporal parameter. The optimal value obtained for the historical data was λ=0.1, and that for the instrumental series was λ=0.001.
To get the error bars of the declination curve, the bootstrap approach considers 1000 sets of data generated by bootstrapping the data considering their measurement uncertainties. In this sense, we have considered three different declination uncertainties according to the following periods. In the interval since 1900 to the present date, we have considered an uncertainty of 1 min of arc taking into consideration the accuracy of the declinometers used in the Spanish observatories during the 20th century (Batlló, 2005) and the analysis of the hourly mean value uncertainty carried out by Curto (2019). It is difficult to properly know an uncertainty value for the declination values before 1900. In relation to the data of historical values of declination collected from the HISTMAG database, we do not know the uncertainty of the compasses used in the measurement of the declination. In accordance with Jackson et al. (2000), who include a noise error of 0.5° for these historical observations, we have used this value as the uncertainty for the declination data before 1900. Although some of these data belong to the earliest observatories functioning in the Iberian Peninsula, no detailed information is available about the uncertainty of their measurements, and so we have decided to be conservative and use the same value. Being even more conservative, we have decided to double this uncertainty value (i.e. 1°) for the historical declination data prior to 1750; thus, the accuracy of the measurement and the resolution of the compasses are supposed to be lower as we go back in time.
For each bootstrapped dataset, we generate a declination curve. The final curve is the mean of the 1000 obtained curves, and the error bands (at 1σ of probability) are obtained using the standard deviation of the 1000 curves. As result, we get the declination curve for the ROM plotted in Fig. 13.
This fitted curve shows that, at the Royal Observatory of Madrid, the minimum declination value achieved in the period of study was −21.99° in the year 1816. Since then, the value of declination at that location has been continuously increasing until reaching positive values at the beginning of the year 2022. Before the minimum, the declination value had been decreasing since the beginning of the selected period (the year 1590), and the previous crossing by the agonic line would have taken place around 1652, changing declination from positive to negative values, with 1647–1671 being the period of 95 % probability (see Fig. 14).
With the optimal declination curve obtained for the ROM, the residues of each group of data (i.e. historical and instrumental data) used in the calculation process with respect to the fitted curve have been calculated (Fig. 15). For the historical data, the histogram of residual data points out the contribution of two types of distributions: a Gaussian distribution plus a Laplacian distribution, both centred at 0° (Fig. 15a). For the instrumental data, the histogram follows a Gaussian distribution centred at 0° (Fig. 15b). These results indicate an appropriate fitting of both series of data to obtain the declination curve at the ROM coordinates. As expected, the high dispersion of the historical data (see, e.g. Fig. 13a) is evident in the greater width of the residual data distribution compared to that of the instrumental data series.
The secular-variation curve (i.e. the first time derivative) for declination has been calculated from the ROM declination curve previously obtained. This curve (Fig. 16a) illustrates the non-constant nature of the secular variation in declination over time, displaying significant temporal variability initially related to processes in the deep Earth's interior, where the geomagnetic field originates from. However, a detailed analysis of this variability reveals a clear periodicity characteristic of external solar forcing, specifically of the solar cycle. The secular-variation declination curve demonstrates a pronounced influence of the external geomagnetic field, modulated by the 11-year and 22-year solar cycles. This external influence has not been adequately removed from the original declination data. To mitigate the effect of solar activity, we applied a filter that removes periods shorter than 25 years, and the filtered curve is shown in Fig. 16a. The contribution of solar activity is depicted in Fig. 16b. It is important to note that solar activity is not accurately recorded before 1700 due to the limited number of declination data points (see Fig. 13). This finding highlights the necessity of filtering geomagnetic observatory data to eliminate any residual contributions from the external field when analysing long-term time series.
5.2 Comparison with independent data and historical global models
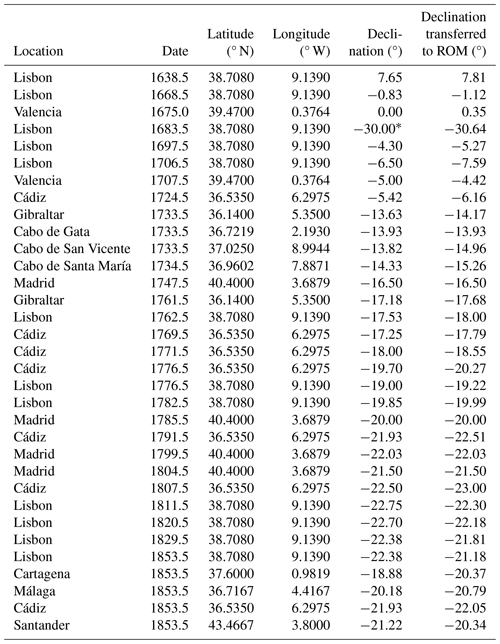
In order to check the validity of the obtained declination curve, we have compared the curve with a compilation of declination data not included in the curve that cover a period before 1855. These independent declination data correspond to the measurements made by Rico Sinobas (1856) at different locations within the Iberian Peninsula. From this compilation (see Sect. S4), we have selected the observations from 1600 onwards and discarded two observations whose locations were badly defined. The coordinates of these selected points have been determined, and the observations have been transferred to the ROM coordinates. The transferred declination data are listed in Table 3.
The result of this comparison is shown in Fig. 17a, where it can be seen that they fit quite well with the declination curve obtained for ROM. Only one observation corresponding to Lisbon for the year 1683 shows a great discrepancy with the declination curve. It seems to be a typo in the original document as the measurement of a declination value of 30°00′ W in the Iberian Peninsula was not reached in the whole period studied. It appears that a value of 30′ W might have been more likely and would align with the declination curve, as illustrated in Fig. 17a by a red triangle. This comparison indicates that the compilation made by Rico Sinobas is of high enough quality, and this could be taken into account in future declination studies.
We have also compared the declination curve obtained for the Royal Observatory of Madrid with the declination values given by the geomagnetic gufm1 and Cov-Obs.x2 models for this location. In Fig. 17b, the ROM declination curve has been plotted together with those provided by the gufm1 model for the period 1590–1840 and those provided by the Cov-Obs.x2 model for the period 1840–2022. The obtained declination curve and those synthesised by both models show a good agreement, especially after 1800, where the amount of declination data increase. Before this epoch, the discrepancy increased due to the small amount of data measured in that time and the observed high dispersion.
In terms of secular variation, we compared the original curve and the filtered curve with the model predictions (Fig. 17c). Observing the original secular-variation curve (blue line in Fig. 17c), we note a clear agreement with the secular variations of the global models. The largest discrepancies occur before 1800, a period where the curve and the gufm1 model are constrained by limited declination data. The comparison with the filtered curve (orange line in Fig. 17c) highlights the impact of solar forcing on the global models. Both the gufm1 and Cov-Obs.x2 models replicate the time variability of the original curve. These results could indicate that the historical models do not adequately account for the influence of solar forcing in their construction.
The Royal Observatory of Madrid was established by King Carlos III in 1785, with construction beginning around 1790. However, it did not become operational until 1851 due to various challenges. In 1853, the observatory expanded to include meteorological and geomagnetic observations, acquiring several specialised instruments. In September 1855, Mr. Rico Sinobas made the first continuous geomagnetic measurements in the Iberian Peninsula. Discrepancies in early geomagnetic data were noted, possibly due to metallic influences from the observatory's construction.
In December 2020, the agonic line crossed the ROM. This event has prompted this work, with a comprehensive study of the declination behaviour at the ROM coordinates over the past 4 centuries. To achieve this, we processed declination data from the Iberian Peninsula and nearby regions, collected from geomagnetic observatories from the late 19th century onwards and older historical data compiled in the HISTMAG database. This allowed us to create a declination curve for the Royal Observatory of Madrid, pointing out how the agonic line also crossed the ROM around 1652. The obtained curve aligns with independent declination data measured by Rico Sinobas in the Iberian Peninsula during the last century. Additionally, our results highlight the significant influence of solar forcing on the declination curve, reflecting the impact of the solar cycle on the secular variation of the declination. This effect has also been observed in other historical global models, where this external forcing has not been adequately mitigated.
COV-OBS.x2 code is accessible at https://doi.org/10.1186/s40623-020-01194-2 (Huder et al., 2020). The gufm1 code is accessible at https://doi.org/10.1098/rsta.2000.0569 (Jackson et al., 2020). The calculations in this work have been carried out using MATLAB software, using a licence from Instituto Geográfico Nacional (2023–2024).
The dataset obtained from Rico Sinobas (1856) is provided in the Supplement. The ROM dataset can be accessed at https://doi.org/10.1002/gdj3.61 (Pro et al., 2018). The observatories' dataset can be accessed at https://geomag.bgs.ac.uk/data_service/data/annual_means.shtml (WDC, 2024). The IGN yearbooks can be accessed at https://www.ign.es/web/ign/portal/gmt-anuarios-geomagneticos (Instituto Geográfico Nacional, 2024). The HISTMAG data set can be accessed at https://cobs.zamg.ac.at/gsa/index.php/en/models-and-databases/histmag (Conrad Observatorium, 2024).
The supplement related to this article is available online at: https://doi.org/10.5194/hgss-15-81-2024-supplement.
Conceptualisation: JMT and FJPC. Data curation: JMT and FJPC. Formal analysis: JMT and FJPC. Investigation: JMT. Methodology: FJPC. Software: FJPC. Supervision: FJPC and ABA. Validation: JMT and FJPC. Visualisation: JMT, AN and FJPC. Writing – original draft preparation: JMT. Writing – review and editing: FJPC, AN and ABA. All the authors have read and agreed to the published version of the paper.
The contact author has declared that none of the authors has any competing interests.
Publisher’s note: Copernicus Publications remains neutral with regard to jurisdictional claims made in the text, published maps, institutional affiliations, or any other geographical representation in this paper. While Copernicus Publications makes every effort to include appropriate place names, the final responsibility lies with the authors.
This article is part of the special issue “History of geophysical institutes and observatories”. It does not belong to a conference.
The authors thank the editor and the reviewers Mioara Mandea and Tohru Araki for helping us improving the manuscript. This work has used geomagnetic observatory data, and we thank all the research institutions and observatories that provided these data.
This paper was edited by Kristian Schlegel and reviewed by Mioara Mandea and Tohru Araki.
Alexandrescu, M., Courtillot, V., and Le Mouël, J. L.: Geomagnetic field direction in Paris since the mid-sixteenth century, Phys. Earth Planet. Inter., 98, 321–360, 1996.
Arneitz, P., Leonhardt, R., Schepp, E., Heilig, B., Mayrhofer, F., Kovacs, P., Hejda, P., Valach, F., Vadasz, G., Hammerl, C., Egli, R., Fabian, K., and Kompein, N.: The HISTMAG database: combinating historical, archeomagnetic and volcanic data, Geophysi. J. Int., 210, 1347–1359, https://doi.org/10.1093/gji/ggx245, 2017.
Azpiazu, U. and Gil, R.: Magnetismo terrestre. Su estudio en España, Instituto Geográfico y Catastral, Madrid, 100 pp., Toledo Geophysical Observatory, 1919.
Batlló, J.: Catálogo inventario de magnetómetros españoles, Instituto Geográfico Nacional, Madrid, 305 pp., ISBN 84-9810-728-8, 2005.
Conrad Observatorium: HISTMAG, GeoSphere Austria [data set], https://cobs.zamg.ac.at/gsa/index.php/en/models-and-databases/histmag/ (last access: 23 October 20204), 2024.
Curto, J. J.: Uncertainty in hourly mean data from classical magnetometers, Earth Planet. Space, 71, 139, https://doi.org/10.1186/s40623-019-1119-2, 2019.
Custodio de Morais, J.: Observaçoes de Magnetismo Terrestre no Instituto Geofísico da Universidade de Coimbra, Revista da Facultade de Ciencias da Universidade de Coimbra, Vol XXII, Coimbra, Toledo Geophysical Observatory, 1953.
De Prado, C.: Declinación de la aguja en varios sitios de España, Revista Minera, periódico Científico e Industrial, IX, 413–415, Madrid, https://info.igme.es/biblioteca/ficheros/RevistaMinera/Revista_9_1858.pdf (last access: 21 October 2024), 1858.
Huder, L., Gillet, N., Finlay, C. C., Hammer, M. D., and Tchoungui, H.: COV-OBS. x2: 180 years of geomagnetic field evolution from ground-based and satellite observations, Earth Planet. Space, 72, 120, https://doi.org/10.1186/s40623-020-01194-2, 2020.
Instituto Geográfico y Catastral: Mapa Magnético de España para la época 1924.0, Instituto Geográfico y Catastral, Madrid, 8 pp., Toledo Geophysical Observatory, 1927.
Instituto Geográfico y Catastral: El magnetismo terrestre. Datos referidos a la declinación magnética en España, in: Anuario del Observatorio Astronómico de Madrid para 1934, Instituto Geográfico y Catastral, Madrid, 334–372, ROM library, 1933.
Instituto Geográfico Nacional: Catálogo de la exposición de instrumentos históricos del Real Observatorio de Madrid, Instituto Geográfico Nacional, Madrid, 136 pp., ISBN 978-84-416-2269-2, 2012.
Instituto Geográfico Nacional: Anuarios Geomagnéticos, Instituto Geográfico Nacional, https://www.ign.es/web/ign/portal/gmt-anuarios-geomagneticos/ (last access: 23 October 2024), 2024.
Jackson, A., Jonkers, A., and Walker, M.: Four centuries of geomagnetic secular variation from historical records, Philos. Trans. Royal Soc. A., 358, 957–990, https://doi.org/10.1098/rsta.2000.0569, 2000.
Jonkers, A. R. T., Jackson, A., and Murray, A.: Four centuries of geomagnetic data from historical records, Rev. Geophys., 41, 1006, https://doi.org/10.1029/2002RG000115, 2003.
Lamont, J.: Untersuchungen über die richtung und stärke des erdmagnetismus an verschiedenen puncten des südwestlichen Europa, Hübschmann, Munchen, 338 pp., https://books.google.com.bn/books?id=ZccOAAAAQAAJ&printsec=frontcover&hl=es&source=gbs_ge_summary_r&cad=0#v=onepage&q&f=false (last access: 21 October 2024), 1858.
Mandea, M. and Le Mouël, J.-L.: After some 350 years – zero declination again in Paris, Hist. Geo Space. Sci., 7, 73–77, https://doi.org/10.5194/hgss-7-73-2016, 2016.
Miguel Lafuente, T.: Observatorio Geofísico de Logroño, Geomagnetismo, 1957-1958-1959, Instituto Geográfico y Catastral, Madrid, 120 pp., Toledo Geophysical Observatory, 1964.
Morencos, J.: Observatorio Geofísico de Almería. Geomagnetismo. 1955–1959, Instituto Geográfico y Catastral, Madrid, 150 pp., Toledo Geophysical Observatory, 1964.
Morozova, A. L., Ribeiro, P., and Pais, M. A.: Homogenization of the historical series from the Coimbra Magnetic Observatory, Portugal, Earth Syst. Sci. Data, 13, 809–825, https://doi.org/10.5194/essd-13-809-2021, 2021.
Observatorio del Ebro: Boletín mensual del Observatorio del Ebro, Vol 1, N 1, Tortosa, 90 pp., https://articles.adsabs.harvard.edu/cgi-bin/iarticle_query?journal=BMOE.&volume=0001&type=SCREEN_THMB (last access: 23 October 2024), 1910.
Observatorio del Ebro: Boletín del Observatorio del Ebro. Observaciones Geomagnéticas, 2012, Roquetes, https://www.obsebre.es/images/oeb/pdfs/ca/ButlletinsMagnetisme/ebre_2012_ca. (last access: 23 October 2024), 2013.
Observatorio do Infante D. Luiz: Annaes do Observatorio do Infante D. Luiz, Volumen primeiro 1856 a 1863, Imprensa Nacional, Lisboa, 129 pp., https://arquivo.pt/wayback/20230321162517mp (last access: 23 October 2024), 1863.
Observatorio do Infante D. Luiz: Annaes do Observatorio do Infante D. Luiz, Volumen XXXIX, Quadragesimo Setimo Anno 1901, Imprensa Nacional, Lisboa, 127 pp., https://drive.google.com/drive/u/1/folders/1aNgg5E07mUw9KqHZ_M0P_IUT5Jc8bOUb (last access: 23 October 2024), 1904.
Pro, C., Vaquero, J. M., and Moreno-Pizarro, D.: Early geomagnetic data from the Astronomical Observatory of Madrid (1879–1901), Geosci Data J., 5, 87–93, https://doi.org/10.1002/gdj3.61, 2018.
Payo, G. and Gómez-Menor, R.: Historia del Observatorio Geofísico de Toledo, Instituto Geográfico Nacional, Toledo, 221 pp., ISBN 84-7819-088-0, 1998.
Puente-Borque, M., Pavón-Carrasco, F. J., Nuñez, A., Tordesillas, J. M., and Campuzano, S. A.: Regional geomagnetic core field and secular variation modelo ver the Iberian Peninsula from 2014 to 2020 based on the R-SCHA technique, Earth Planet. Space, 75, 128, https://doi.org/10.1186/s40623-023-01873-w, 2023.
Real Instituto y Observatorio de la Armada en San Fernando: Anales 2020. Observaciones Meteorológicas, Sísmicas y Geomagnéticas, Ministerio de Defensa, Madrid, 177 pp., https://publicaciones.defensa.gob.es/anales-observaciones-meteorologicas-sismicas (last access: 23 October 2024), 2021.
Real Observatorio de Madrid: Anuario del Real Observatorio de Madrid, 1868, Madrid, 456 pp., ISSN: 0210-7619, IGN library, 1867.
Real Observatorio de Madrid: Nota D: Declinación magnética en Madrid durante el decenio 1879 a 1888, in: Observaciones meteorológicas efectuadas en el Observatorio de Madrid durante los años 1888 y 1889, Madrid, 247–268, ROM library, 1890.
Rico Sinobas, M.: Observaciones magnéticas de declinación e inclinación, hechas en el Observatorio de Madrid el mes de setiembre de 1855 por D. Manuel Rico y Sinobas, encargado de dirigir las observaciones meteorológicas del mismo, e individuo corresponsal de la Real Academia de Ciencias, Revista de los Progresos de las Ciencias Exáctas, Físicas y Naturales, Tomo VI, 83–97 pp., Madrid, 1856.
Sancho de San Román, J.: Observatorio Central Geofísico de Toledo. Geomagnetismo. Año 1947, Instituto Geográfico y Catastral, Madrid, 43 pp., Toledo Geophysical Observatory, 1951.
Thébault, E., and Gallet, Y.: A bootstrap algorithm for deriving the archeomagnetic field intensity variation curve in the Middle East over the past 4 millennia BC, Geophys. Res. Lett., 37, 22, https://doi.org/10.1029/2010GL04478, 2010.
Tinoco, J.: Apuntes para la historia del Observatorio de Madrid, Instituto Geográfico y Catastral, Madrid, 88 pp., IGN library, 1951.
WDC: World Data Centre for Geomagnetism: Edinburgh, WDC [data set], https://geomag.bgs.ac.uk/data_service/data/annual_means.shtml (last access: 23 October 2024), 2024.
- Abstract
- Introduction
- The Royal Observatory of Madrid
- Other Spanish observatories
- Compilation of declination data
- Results and discussion
- Conclusions
- Code availability
- Data availability
- Author contributions
- Competing interests
- Disclaimer
- Special issue statement
- Acknowledgements
- Review statement
- References
- Supplement


