Articles | Volume 14, issue 1
https://doi.org/10.5194/hgss-14-71-2023
Note
 | 
07 Jun 2023
Note |  | 07 Jun 2023

Atmospheric electricity observations by Reinhold Reiter around Garmisch-Partenkirchen

R. Giles Harrison and Kristian Schlegel
Abstract

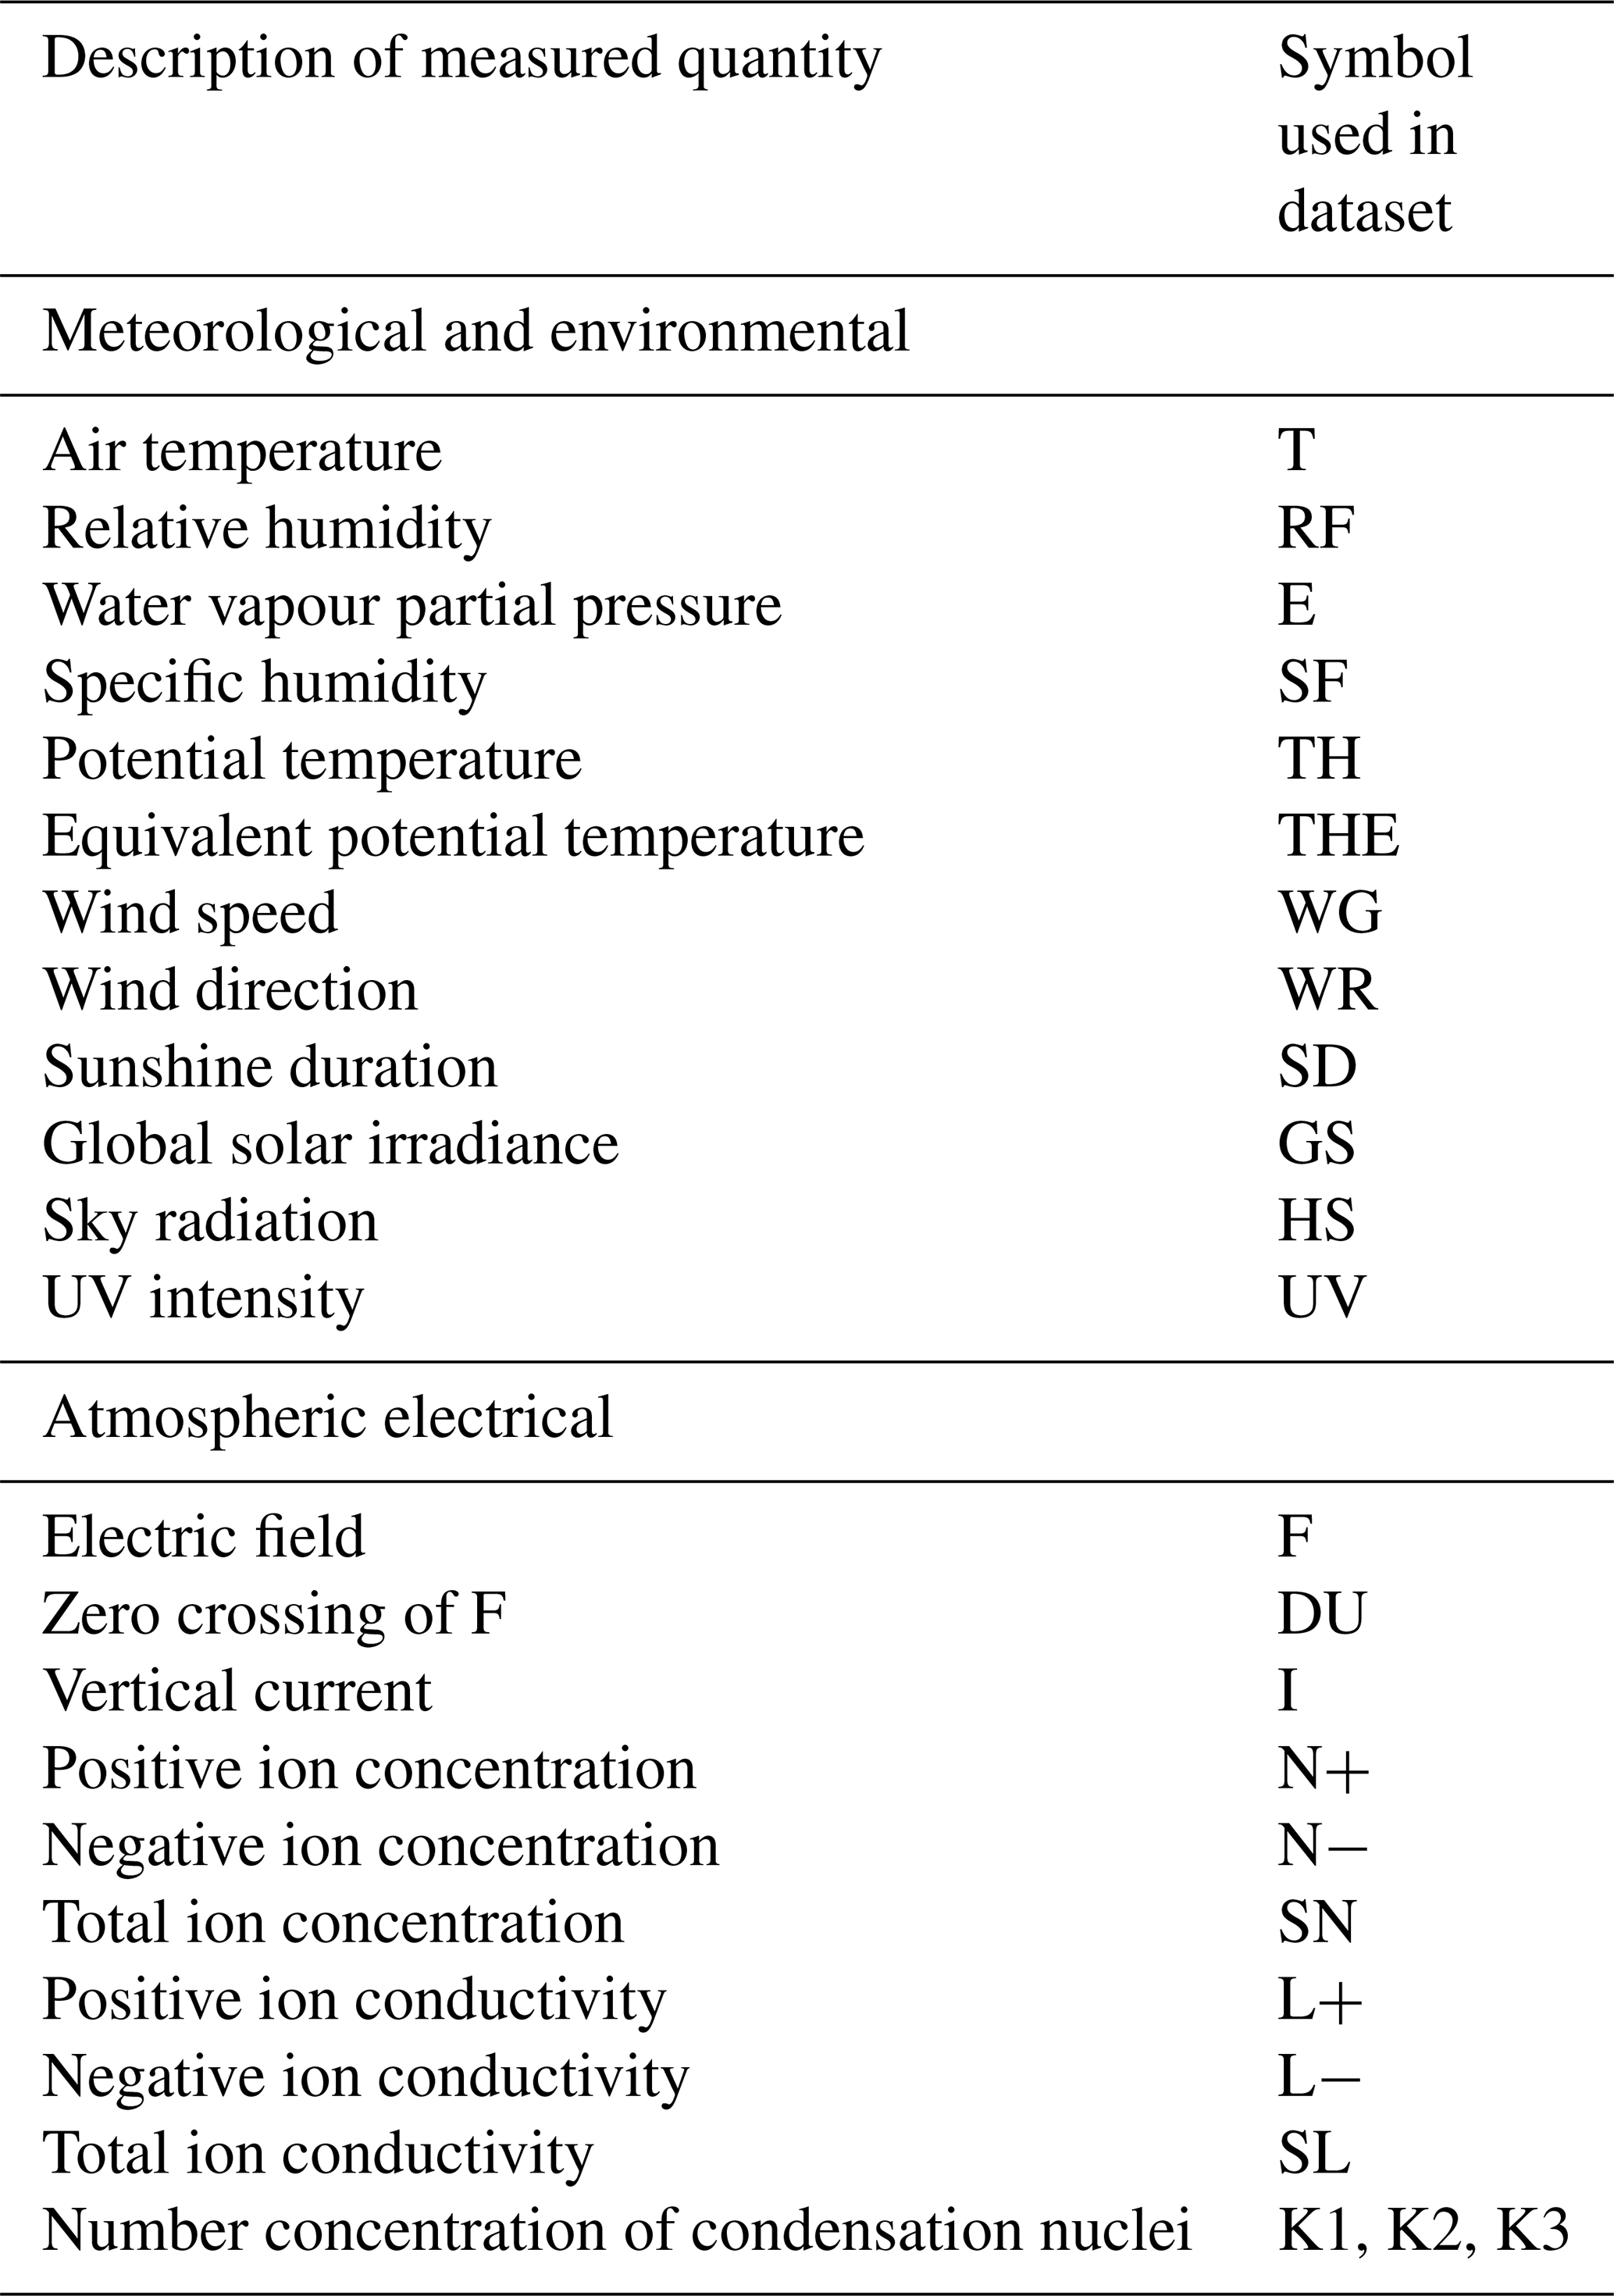
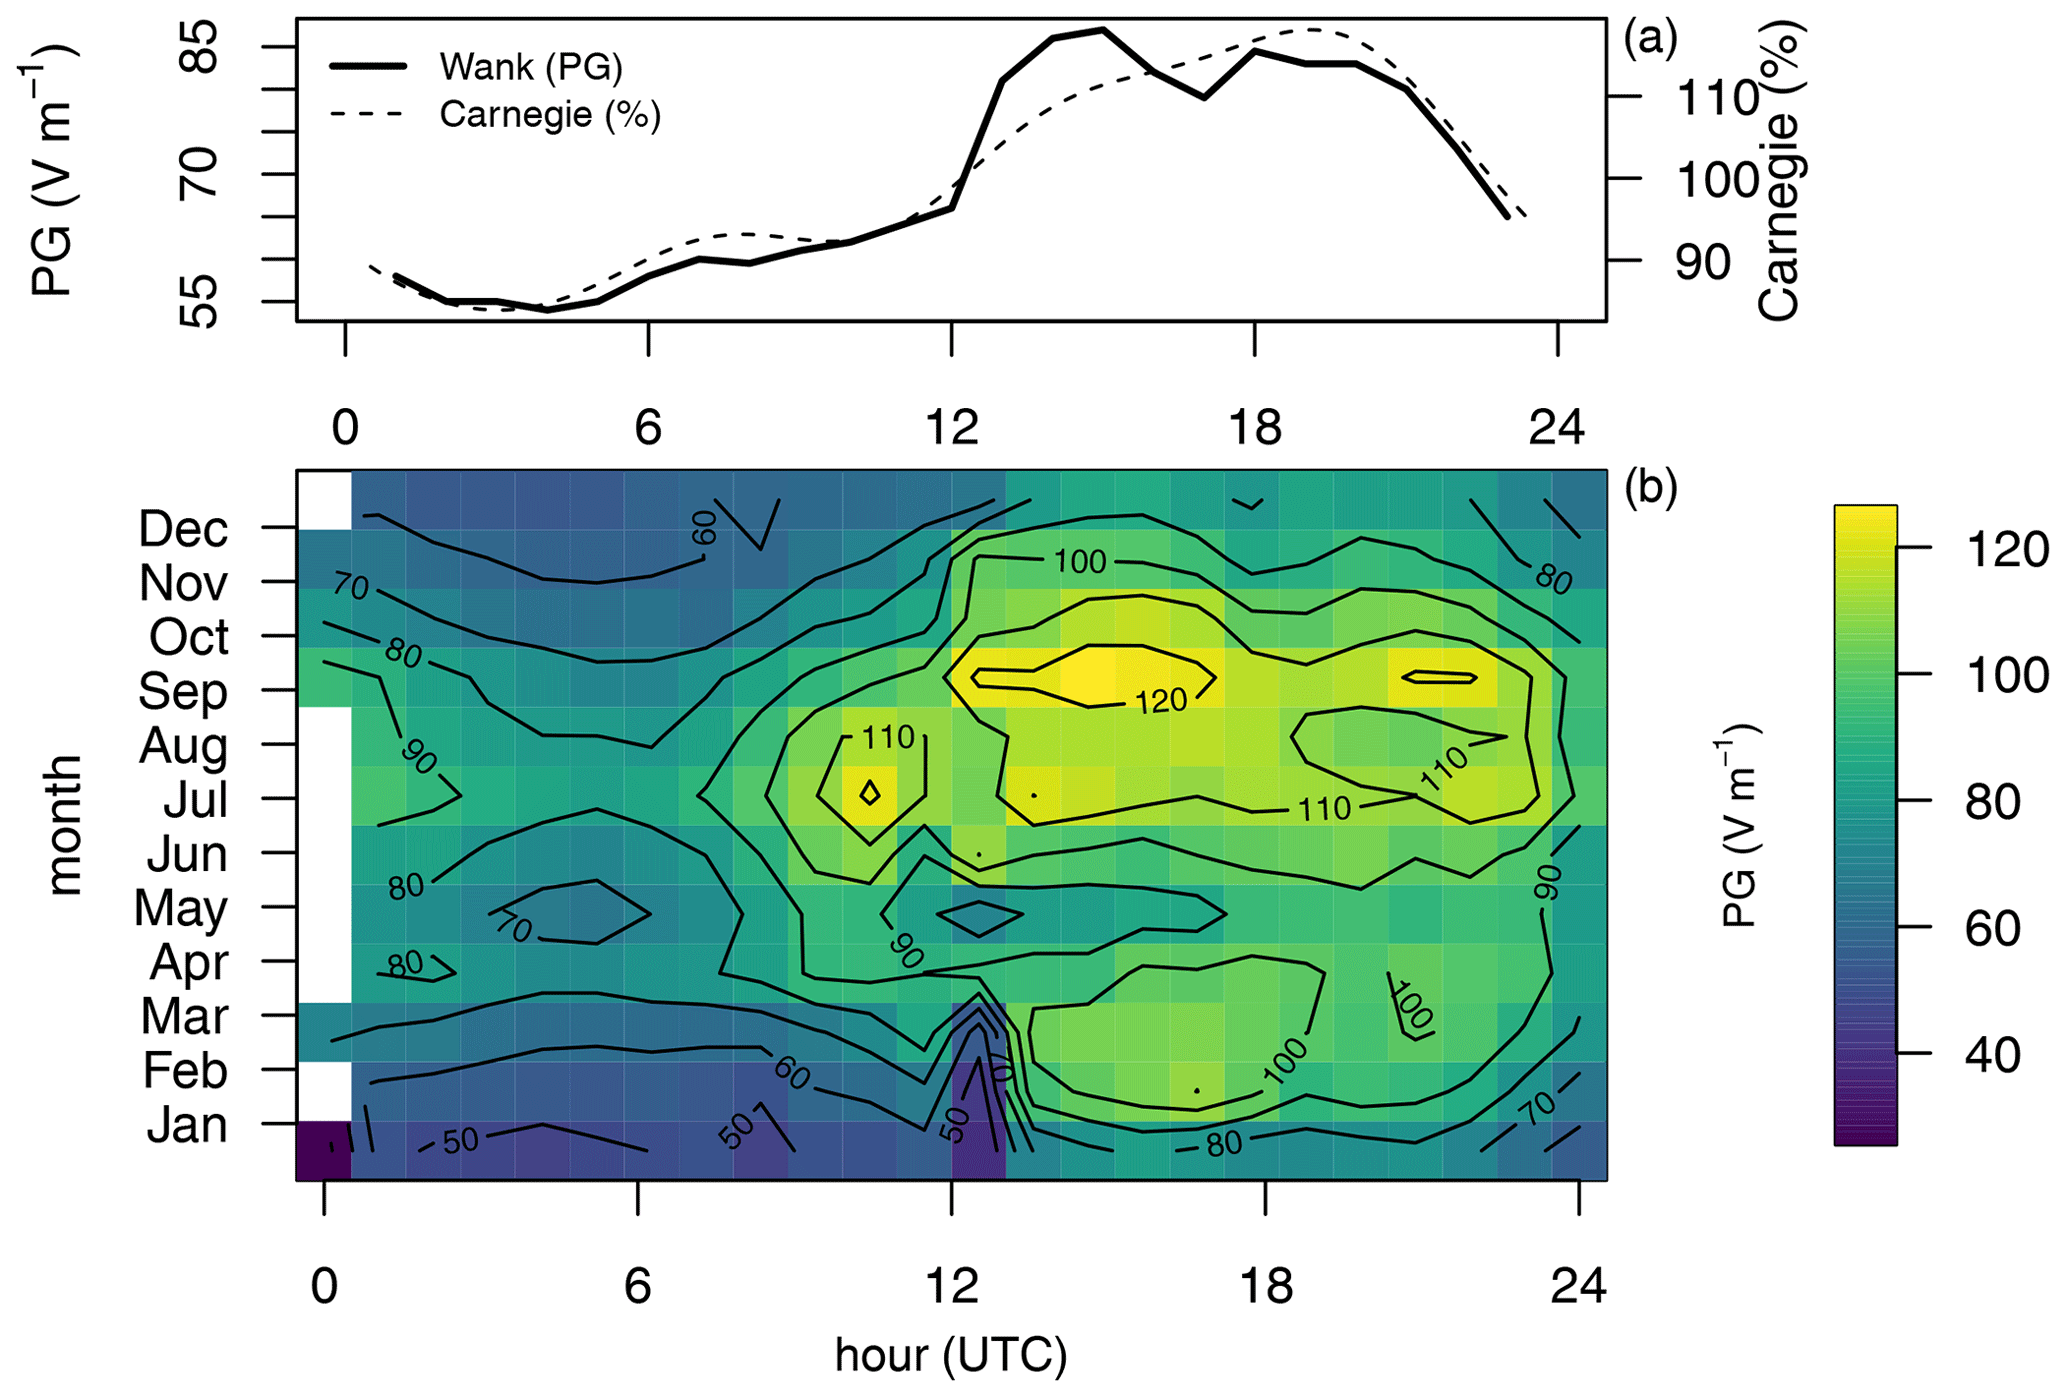
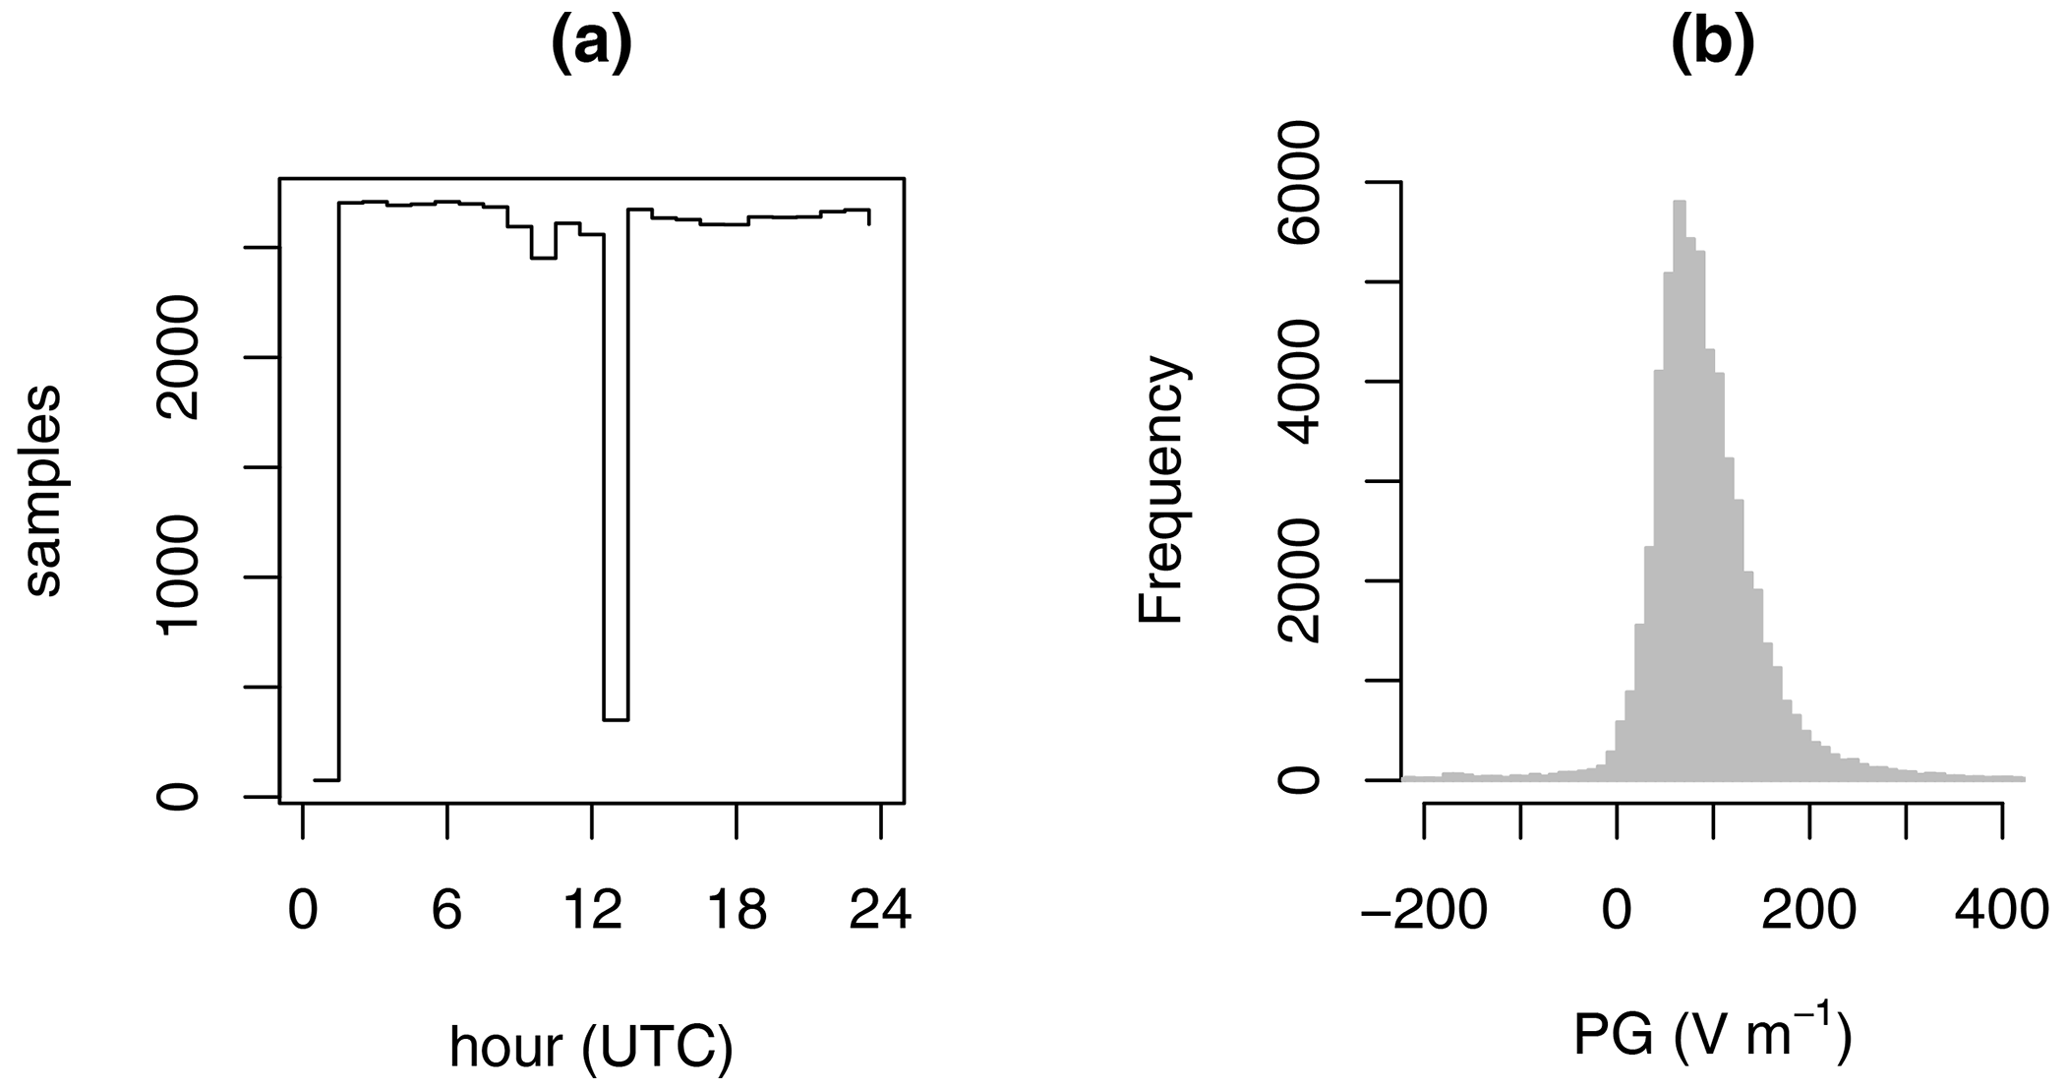
During 4 decades, from 1950 to 1990, atmospheric electricity measurements as well as other environmental measurements were made by Reinhold Reiter at several sites close to Garmisch-Partenkirchen. The quantities determined included the atmospheric potential gradient, the vertical current, and the ion concentrations. Observations made at the Mount Wank site (4730 N, 1109 E; 1780 m) from 1 August 1972 to 31 December 1983 are available in digital form.

1 Introduction

Motivated by his interest in the influence of atmospheric electric processes on humans, Reinhold Reiter (1920–1998) started atmospheric electricity measurements in the early 1950s. Due to widening interest in the global atmospheric electric circuit and its relevance to climate (e.g. Nicoll et al., 2019), past measurements of atmospheric electricity are receiving increasing international attention (Aplin, 2020). Data obtained under clean-air conditions, such as those from mountain sites, are of particular importance. The atmospheric electrical quantities obtained by Reiter within a sustained campaign of environmental measurements frequently fulfilled the clean-air requirements.

Reiter began with various measuring sites in Munich and southern Bavaria, probably to allow intercomparisons. Later, he concentrated on measurements undertaken at Garmisch-Partenkirchen, on the nearby Wank and Zugspitze mountains, and aboard an instrumented passenger cable car moving regularly between the Eibsee and the Zugspitze summit. (The locations of these sites are shown in Fig. 1.)

https://hgss.copernicus.org/articles/14/71/2023/hgss-14-71-2023-f01

Figure 1The area around Garmisch-Partenkirchen (southern Bavaria, Germany); the scale is given in the top left-hand corner, and the following observational sites are marked: Mount Wank (square, upper right), Central Research Institute (triangle), and Zugspitze (star, lower left). The cable car runs almost directly north from the Zugspitze summit to the right-hand shore of Eibsee (map adapted from Digitale Topographische Karte 1:100 000 © Bayerische Vermessungsverwaltung 2022, courtesy of Martin Fasbender).

To undertake this, Reiter founded a privately funded research institute, the Physikalisch-Bioklimatische Forschungsstelle in Garmisch-Partenkirchen which was incorporated as the Fraunhofer-Institut für Atmosphärische Umweltforschung (IFU) in the Fraunhofer Society in 1962. He led this institute as its director until his retirement in 1985. In 2002, this institute became part of the Institut für Meteorologie und Klimaforschung Atmosphärische Umweltforschung (IMK-IFU) and of Campus Alpin of the Karlsruher Institut für Technologie (KIT).

Reinhold Reiter passed away on 24 September 1998, and a detailed memorial article was published by Weihe (1999). It is understood that some of his possessions were bequeathed to Ettal Abbey, a Benedictine monastery in Bavaria.

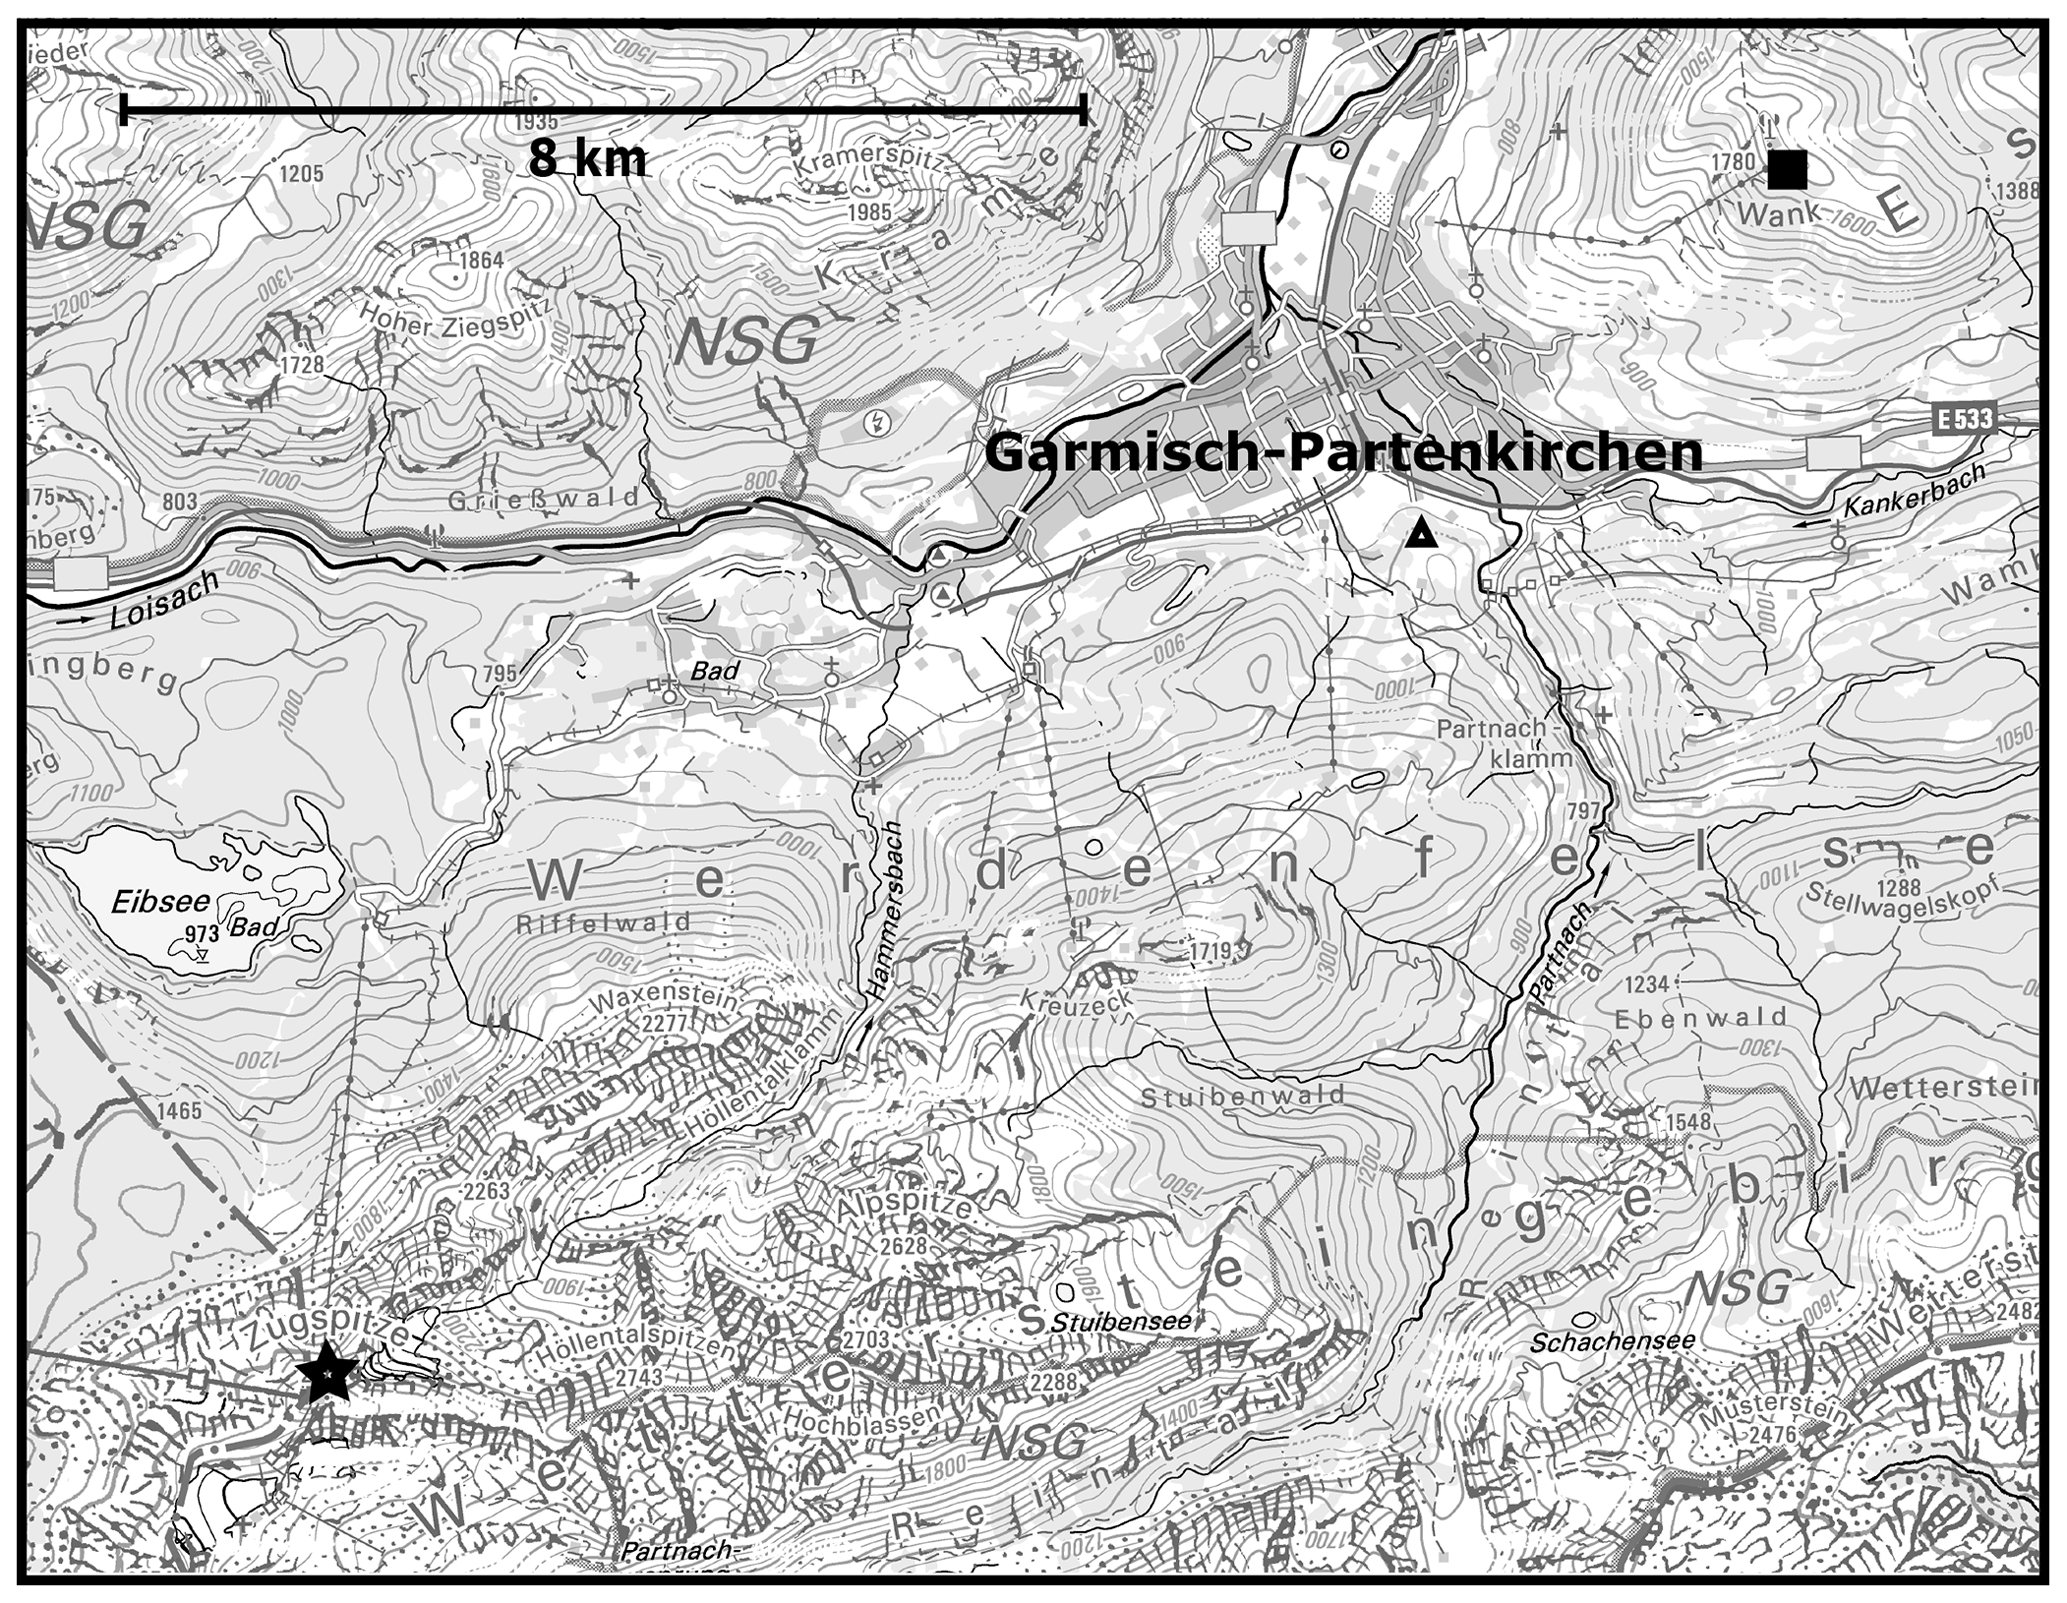
2 Measurement locations

Reiter's principal scientific motivations were to investigate biometeorological responses to atmospheric variables, such as the concentrations of small ions, and to study short-term solar–terrestrial influences on the global circuit. This may be reflected in the choice of mountain sites that offer the possibility to make measurements under low-pollution conditions and with minimal local disturbance.

The Garmisch-Partenkirchen measurements were obtained at permanent sites on the Zugspitze (2964 m altitude) and Wank (1780 m) mountains as well as at an additional site known as the “Central Research Institute” on the valley floor (740 m). A novel feature was the use of the cable car connecting the Zugspitze and a ground station close to the Eibsee that was instrumented to carry sensors in a regular path which sometimes repeatedly passed through fog and cloud layers. Vertical profiles of ozone were obtained using this approach (Reiter, 1991).

3 Apparatus

Customised instruments and systems were devised for the atmospheric electrical measurements. A primary quantity studied was the vertical potential gradient (PG). On Mount Wank, as well as on the cable car, a radioactive collector probe was used that was connected to a high-impedance electrometer amplifier. The PG sensing probe was heated, and its physical construction was refined during a long period of operation under mountain conditions, especially precipitation. The atmospheric conductivity was measured with an aspirated Gerdien condenser. A further measurement of the PG was made using an electrostatic field mill, and the air–Earth current was measured with a wire antenna. A special device was developed for measuring the space charge and, simultaneously, the natural radioactivity in the air. Beyond the usual fair-weather measurements, the precipitation current density was obtained with an electric rain gauge. All of these instruments and the corresponding results are described in papers (Reiter, 1977a, b) and in Reiter's textbook (Reiter, 1992).

4 Data recovery

Some of the measurements from the Bavarian Alps have previously been made available on a CD-ROM, which was originally distributed through the collaborative network provided by the Space Processes and Electrical Changes Influencing Atmospheric Layers (SPECIAL) scientific community (Rycroft and Füllekrug, 2004). These data values were retrieved from magnetic tapes with the help of one of Reiter's collaborators in summer 2000. They provide hourly values from the Mount Wank site (4730 N, 1109 E; 1780 m) and span from 1 August 1972 to 31 December 1983. The wide range of quantities recorded is summarised in Table 1, with the atmospheric electricity quantities identified.

Table 1Quantities recorded on Mount Wank (1972–1983).

Download Print Version | Download XLSX

5 Discussion

The PG measurements obtained were over a sufficiently extended period in order to provide statistical support for suspected solar effects on the lower atmosphere (Reiter, 1977b), which was a major topic of research interest in the 1970s (e.g. Olson, 1971). Due to these effects emerging, it is likely that the local influences are small enough that global atmospheric electric circuit variations can also be retrieved.

Figure 2 provides a summary of the seasonal and diurnal variation in the PG at the site using data from 1976 onwards, which is the longest period of consistent data following an unexplained step change in the mean values. Figure 2a shows the hourly variation across all months, which is compared with the well-known global circuit “Carnegie curve” variation. Although there are discrepancies in detail, perhaps arising from local meteorological factors or uneven sampling, the (Pearson) correlation between hourly values of the Carnegie curve and the Mount Wank PG is 0.96. The probability (p) that this is due to chance is small (p<0.001), using the method of Ebisuzaki (1997) which accounts for serial correlation. Figure 2b shows the diurnal variation by month, in which the Carnegie curve is evidently stronger in the second half of the year. Some values around midnight (UTC) are absent.

https://hgss.copernicus.org/articles/14/71/2023/hgss-14-71-2023-f02

Figure 2(a) Median hourly potential gradient (PG) across all months of the year from Mount Wank with the relative variation from Cruise VII of the Carnegie overplotted. (b) Hourly median PG by month from Mount Wank using values for the period from 1976 to 1983.

Download

Figure 3 summarises the sampling and the distribution of values obtained. From Fig. 3a, it can be seen there are far fewer values for midnight and midday than for any of the other hours. It is not clear why this is, but both midnight and midday occur first in each line of values in the data files, so it might be a data processing artefact. A similar pattern of missing values is found for some other measured quantities in the data files. Figure 3b presents the combined hourly PG data as a histogram: the median is 84 V m−1, and the interquartile range is 58–119 V m−1.

https://hgss.copernicus.org/articles/14/71/2023/hgss-14-71-2023-f03

Figure 3(a) Count of hourly samples of Mount Wank PG values from 1976 to 1983. (b) The distribution of all of the hourly PG values obtained.

Download

Figure 4 demonstrates the consistency evident between annual variations in PG measurements from Mount Wank and those made at Lerwick in Shetland (Harrison and Riddick, 2022) for Decembers that have digital values available. Some of the variation observed at Shetland is thought to arise from the El Niño–Southern Oscillation (Harrison et al., 2022) that, in turn, modifies the global distribution of current-generating storms. Figure 4a shows the values as a time series. Although there is a trend in the Mount Wank data (Harrison, 2004), Fig. 4b shows the correlation between the two short series of values. This is consistent with the global circuit providing the common variation occurring at both sites.

https://hgss.copernicus.org/articles/14/71/2023/hgss-14-71-2023-f04

Figure 4Annual December mean PG values for Mount Wank compared with those for Lerwick, following Harrison (2004), as (a) time series and (b) a scatterplot. The correlation coefficient r in panel (b) is r=0.74 (p=0.03).

Download

Combined with the Carnegie curve agreement shown in Fig. 2, Fig. 4 further supports the value of the Mount Wank PG data for studying global circuit effects.

6 Conclusions

Atmospheric electricity and other environmental measurements were made in the Bavarian Alps over a long period; from these measurements, a digital series of hourly measurements for much of the 1970s is available. In the PG data from the Mount Wank site, the presence of global and solar–terrestrial signals is apparent, which indicates the likely wider applicability of the measurements. The endeavours at the Garmisch-Partenkirchen sites deserve to be more widely known.

Data availability

The 1972–1983 Mount Wank dataset is openly accessible through the University of Reading's Research Data Archive: https://doi.org/10.17864/1947.000445 (Harrison and Schlegel, 2023). The Lerwick December data are available at https://doi.org/10.17864/1947.000409 (Harrison, 2022).

Author contributions

The authors jointly drafted the manuscript.

Competing interests

At least one of the (co-)authors is a member of the editorial board of History of Geo- and Space Sciences. The peer-review process was guided by an independent editor, and the authors also have no other competing interests to declare.

Disclaimer

Publisher’s note: Copernicus Publications remains neutral with regard to jurisdictional claims in published maps and institutional affiliations.

Special issue statement

This article is part of the special issue “Atmospheric electrical observatories”. It is not associated with a conference.

Review statement

This paper was edited by Karen Aplin and reviewed by two anonymous referees.

References

Aplin, K. L.: Introduction to the special issue “Atmospheric electrical observatories”, Hist. Geo Space. Sci., 11, 137–138, https://doi.org/10.5194/hgss-11-137-2020, 2020. 

Ebisuzaki, W.: A method to estimate the statistical significance of a correlation when the data are serially correlated, J. Climate, 10, 2147–2153, https://doi.org/10.1175/1520-0442(1997)010<2147:AMTETS>2.0.CO;2, 1997. 

Harrison, R. G.: Long-range correlations in measurements of the global atmospheric electric circuit, J. Atmos. Sol.-Terr. Phys., 66, 1127–1133, https://doi.org/10.1016/j.jastp.2004.05.001, 2004. 

Harrison, G.: Atmospheric electricity data for El Niño-Southern Oscillation studies, University of Reading [data set], https://doi.org/10.17864/1947.000409, 2022. 

Harrison, G. and Schlegel, K.: Atmospheric electricity data from the Bavarian Alps 1972–1983, University of Reading [data set], https://doi.org/10.17864/1947.000445, 2023. 

Harrison, R. G. and Riddick, J. C.: Atmospheric electricity observations at Lerwick Geophysical Observatory, Hist. Geo Space. Sci., 13, 133–146, https://doi.org/10.5194/hgss-13-133-2022, 2022. 

Harrison, R. G., Nicoll, K. A., Joshi, M., and Hawkins, E.: Empirical evidence for multidecadal scale Global Atmospheric Electric Circuit modulation by the El Niño-Southern Oscillation, Environ. Res. Lett., 17, 124048, https://doi.org/10.1088/1748-9326/aca68c, 2022. 

Nicoll, K. A., Harrison, R. G., Barta, V., Bor, J., Brugge, R., Chillingarian, A., Chum, J., Georgoulias, A. K., Guha, A., Kourtidis, K., Kubicki, M., Mareev, E., Matthews, J., Mkrtchyan, H., Odzimek, A., Raulin, J.-P., Robert, D., Silva, H. G., Tacza, J., Yair, Y., and Yaniv, R.: A global atmospheric electricity monitoring network for climate and geophysical research, J. Atmos. Sol.-Terr. Phys., 184, 18–29, https://doi.org/10.1016/j.jastp.2019.01.003, 2019. 

Olson, D. E.: The evidence for auroral effects on atmospheric electricity, Pure Appl. Geophys., 84, 118–138, https://doi.org/10.1007/BF00875461, 1971. 

Reiter, R.: Review of the History, Activities and Basic Facilities of the Institute for Atmospheric Environmental Research, in: Electrical Processes in Atmospheres, 759–803, https://doi.org/10.1007/978-3-642-85294-7, 1977a. 

Reiter, R.: The electric potential of the ionosphere as controlled by the solar magnetic sector structure. Result of a study over the period of a solar cycle, J. Atmos. Terr. Phys., 39, 95–99, https://doi.org/10.1016/0021-9169(77)90048-4, 1977b. 

Reiter, R.: On the mean daily and seasonal variations of the vertical ozone profiles in the lower troposphere, Atmos. Environ., 25A, 1751–1757, 1991. 

Reiter, R.: Phenomena in atmospheric and environmental electricity, Elsevier Science Publishers, Amsterdam, 572 pp., ISBN 978-0444892867, 1992.  

Rycroft, M. J. and Füllekrug, M.: The initiation and evolution of SPECIAL, J. Atmos. Sol.-Terr. Phys., 66, 1103–1113, https://doi.org/10.1016/j.jastp.2004.05.013, 2004. 

Weihe, W. H.: In memoriam Reinhold Reiter 17 November 1920–24 September 1998, Int. J. Biometeorol., 43, 96–98, https://doi.org/10.1007/s004840050122, 1999. 

Download
Short summary
Environmental measurements were undertaken by Reinhold Reiter (1920–1998) around Garmisch-Partenkirchen in the Bavarian Alps for 4 decades. This included measurement sites on the Zugspitze and Wank mountains as well as the use of an instrumented cable car between the Eibsee and the Zugspitze summit. The Mount Wank site operated between 1 August 1972 and 31 December 1983, and the hourly data values – including atmospheric electricity quantities – for this site have been recovered.