the Creative Commons Attribution 4.0 License.
the Creative Commons Attribution 4.0 License.
 | 08 Aug 2022
Atmospheric electricity observations at Lerwick Geophysical Observatory
R. Giles Harrison
John C. Riddick
Atmospheric electricity measurements were made at Lerwick Observatory, Shetland, between 1925 and 1984. These principally provide a long series of hourly potential gradient (PG) measurements at an unpolluted site but also include air–Earth current density measurements during the late 1970s and early 1980s. An especially notable aspect was investigating the dramatic atmospheric electrical changes caused by nuclear weapon detonations in the late 1950s and early 1960s, which has parallels with the discovery of the Antarctic ozone hole. The methodology employed at Lerwick to provide the PG measurements is described. There is renewed international interest in such measurements, not least because the Lerwick PG data have been shown to be linked to Pacific Ocean temperature anomalies. The past measurements described have characterised the Lerwick site exceptionally well in atmospheric electrical terms, which also indicate its suitability for future, similar measurements.
- Article
(6023 KB) - Full-text XML
- BibTeX
- EndNote


Geophysical studies in the UK have a long history and indeed present one of the longest formal experimental investigations in the natural sciences, arguably beginning with the work of William Gilbert in Tudor times (Gilbert, 1600). Regular and systematic measurements have since provided a range of important insights, many associated with Greenwich and Kew observatories in London during the 19th century. Atmospheric electrical measurements were often pursued alongside magnetic measurements. The expectation of such an arrangement led to atmospheric electricity investigations being included on the geomagnetic survey ship Carnegie. The significant result from the Carnegie observations was finding a consistent daily variation linked to universal time, widely known as the Carnegie curve (Harrison, 2013).
Atmospheric electricity measurements formed part of routine work at observatories across the world during the 20th century, such as those operated by the Carnegie Institution in South America and Western Australia, and by meteorological services in Europe. As further UK magnetic observatories became sought after and built beyond London, new sites for regular atmospheric electricity measurements consequently also became established, notably at Eskdalemuir in Scotland and Lerwick in Shetland (Harrison, 2003). Lerwick Observatory has recently celebrated the centenary of its foundation.
Following the renewed international interest in atmospheric electricity measurements for climate research (Nicoll et al., 2019), specific attention is given here to the Lerwick atmospheric electricity instrumentation, which was operational from 1925 to 1984. The observatory is located just off the A970 main road, between Lerwick and Scalloway, on rising land at 80 m above sea level and about 2 km from the town of Lerwick. Figure 1a and b show the location of Lerwick and Fig. 1c and d the region around the observatory, including Trebister Loch. Descriptions of the other meteorological work of the site at Lerwick are available in Harper (1950) and Tyldesley (1971). The annual volumes of the Observatories' Year Book (hereafter OYB), published until 1967, provide a further important resource.
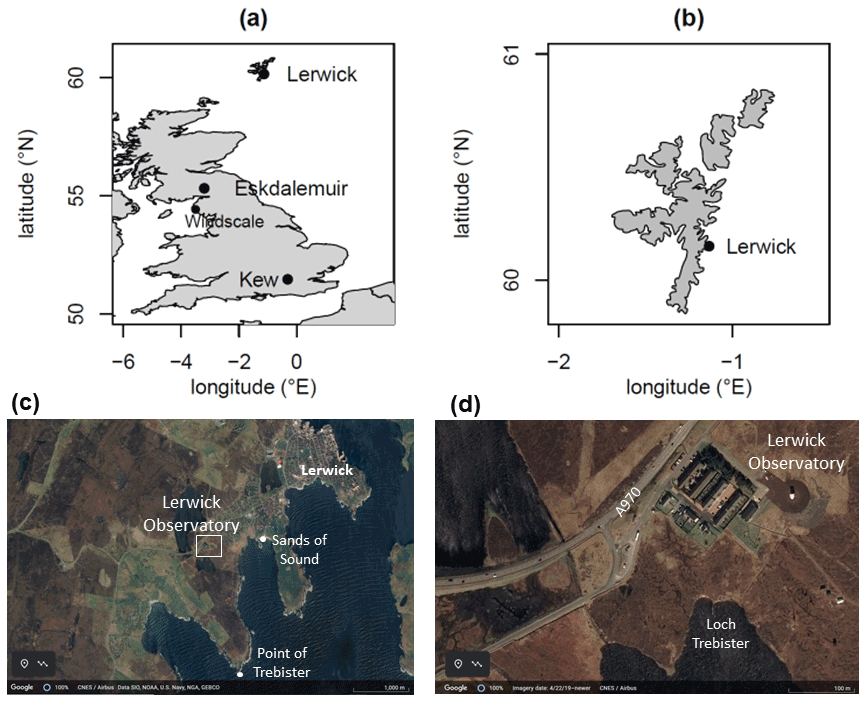
Figure 1Maps showing (a) the positions of the geophysical observatories at Kew, Eskdalemuir, and Lerwick and the nuclear site previously known as Windscale (Sellafield). (b) Shetland. Panels (c) and (d) show the local environment around Lerwick Observatory. Images in panels (c) and (d): © Google Earth.
2.1 Foundation
Expansion of electrical distribution networks towards the end of the 19th century generated interference with the work of geomagnetic observatories, requiring more remote sites beyond London to be sought (Macdonald, 2018). These endeavours led to a new observatory being built at Eskdalemuir, Scotland, in 1909, at which the daily recording routine also included atmospheric electricity measurements (Harrison, 2004). With Eskdalemuir Observatory established, the quest for a more northerly site became urgent following the First World War, after a request from the Norwegian government for help in undertaking research into meteorological and auroral phenomena in high latitudes. (One specific need was to provide high-latitude comparative data for Roald Amundsen's arctic voyages. In later years, Lerwick was also used for staff training by the British Antarctic Survey; Walker, 2011a). A permanent site was the preferred option, for which Shetland was especially suitable, as not only was it as far north as possible in the UK, but it also allowed measurements from Kew, Eskdalemuir, and Shetland to lie roughly on a north–south line for research on the position and pattern of the electric current systems associated with magnetic disturbances.
Establishing such a northern observatory was included in the programme of the Meteorological Office in 1919. A radio station had been built near Lerwick in 1913 by the Admiralty, and transferred after the war to the General Post Office (GPO), but was little used. As it offered office space and living quarters, it was well suited to becoming the intended observatory. An arrangement followed with the Air Ministry. It was agreed that the Lerwick radio station site could be used as a geophysical observatory in return for maintaining the radio equipment, which itself was used for the transmission of meteorological reports and time signals (the radio heritage is embedded in the site being known locally as “Da Wireless”). Lerwick Observatory was formally opened on the 7 June 1921 by A. Crichton Mitchell, superintendent of the Meteorological Office at Edinburgh, with Jock Crichton becoming the Lerwick superintendent. The full name of the site was Lerwick Geophysical Observatory (Ashford, 1994).
2.2 Infrastructure developments
At the observatory's outset, there were 13 small houses on the site. Only some of these were used for accommodation, allocated to the superintendent Jock Crichton, the caretaker Jimmy Ridland, and a wireless operator, S. Newcomb. Comfort was basic, with official furniture provided from 1926. One house had its scullery used as a darkroom for auroral photographic work, another provided the observatory office, and another a workshop. A further house had darkrooms for use with the electrograph and the photographic recorder of a geomagnetic induction loop around Trebister.
The early electricity supply at the site was poor and greatly improved by installation of an oil-powered generator in November 1925. Water for the observatory was obtained from Trebister by a windmill pump, with the water filtered through shingle and sand. The water supply was also initially unreliable, as the first pump was inadequately engineered for the strong winds encountered, and an improved wind pump was installed in March 1925.
Early use of the observatory was strongly influenced by its military past. In 1925, barbed wire entanglements around the site were removed and new paths constructed across the site from material obtained by cutting drains to prevent flooding. The wireless station was operated for the Air Ministry and used for emergency communications by the General Post Office (GPO) in March 1925, following a cable breakage with the mainland. This occurred again in March 1928. The antenna masts were finally dismantled in September 1932.
With the Second World War looming, a temporary radio station was re-established in July 1939, intended for receiving time signals and weather reports. After the outbreak of war, light-blocking curtains were fitted to observatory windows, and bombers were seen to pass low over the magnetic huts in an air raid on Lerwick on 22 November 1. Some requisition of facilities was made by the army in 1940, which led to difficulties with the water supply, not least from the use of Trebister Loch for washing. The workshop in one of the houses was made into an air-raid shelter in 1941.
New offices were opened in 1960, and a substantial refurbishment led to the opening of a new building in 2013. Office blocks and residential buildings were near to the road, with a meteorological balloon shed on the northeasterly side of the site, overlooking the town of Lerwick (see Fig. 2). The meteorological enclosure was behind the office blocks, with various huts housing magnetometers situated further away along an access path.
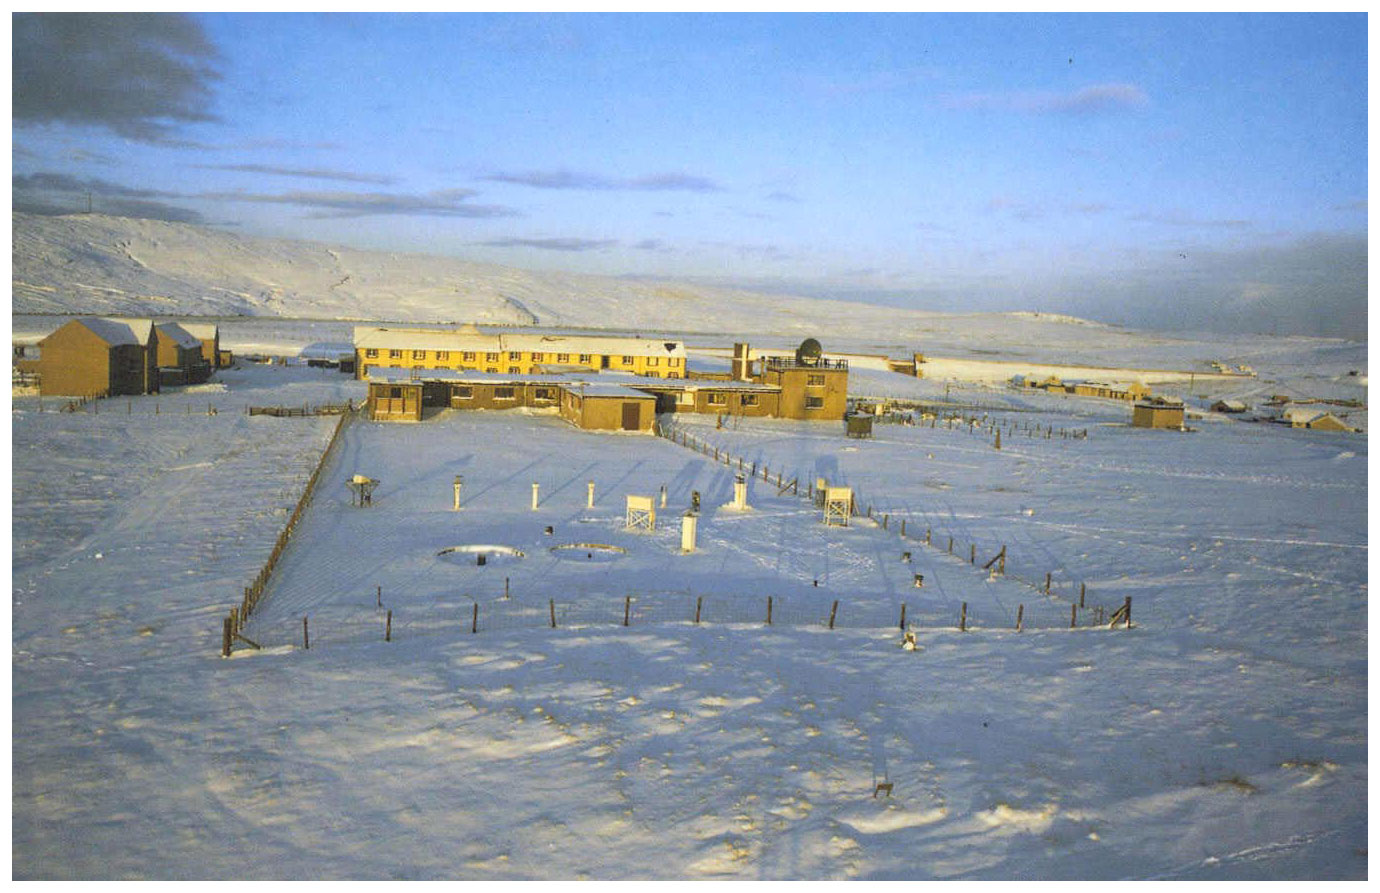
Figure 2The meteorological site and office buildings, viewed from the southeastern end, in the early 1990s. Photograph provided by Alan Gair.
By about 1920, operating principles for standardised atmospheric electricity measurements were well established. These measurements were principally to obtain the atmosphere's vertical electric field, generally known in this context as the vertical potential gradient, PG2, but also included the electrical conductivity of air and the vertical conduction current density. The PG was determined from the electric potential measured at a fixed point above the surface, using a sensing electrode of some kind and an electrostatic voltmeter3. The probe providing the local air potential did so by actively exchanging charge with its surroundings and, hence, was known as an “equaliser” or “collector”. The 19th century measurements typically used a flame probe equaliser, connected to a mechanical electrometer, for example, on a moveable mast at Greenwich Observatory (Airy, 1847), and sited above the cupola at Kew Observatory (Ronalds, 1847). A flame probe sensor was, however, only suitable for intermittent use. This difficulty was removed with the invention of the Kelvin water dropper equaliser in 1859, which equalised the potential with the air through using a fine mist of water supplied from a header tank. By keeping the tank filled with water, continuous measurements of PG became possible, and permanent recordings of the variations obtained were made by projecting the electrometer's deflection onto photographic recording paper (Aplin and Harrison, 2013). Following the naming convention for other meteorological self-registering (or “autographic”) instruments, a continuous recording device for the PG was known as an “electrograph” or, more specifically when a water dropper equaliser was used, the “Kelvin electrograph”. The paper chart records were known as electrograms.
For the new site at Lerwick, the intention was also to install an electrograph, and Fig. 3 shows the approximate positions of the various atmospheric electricity measurement sites. From the outset, a radioactive equaliser was considered more suitable rather than a Kelvin water dropper equaliser. The Lerwick electrograph consisted of a radioactive probe exposed to the atmosphere and connected to an electrometer and chart recorder, initially a Benndorf instrument (Benndorf, 1906), as shown in Fig. 4a. A design feature of the Benndorf electrometer was the mechanical linkage (Fig. 4b) in its original form that used a pot of sulfuric acid with a mica vane for damping of oscillations (Hatakeyama, 1934). Figure 4c shows a single day's chart trace from the Lerwick Benndorf electrometer, which includes an earthing test.
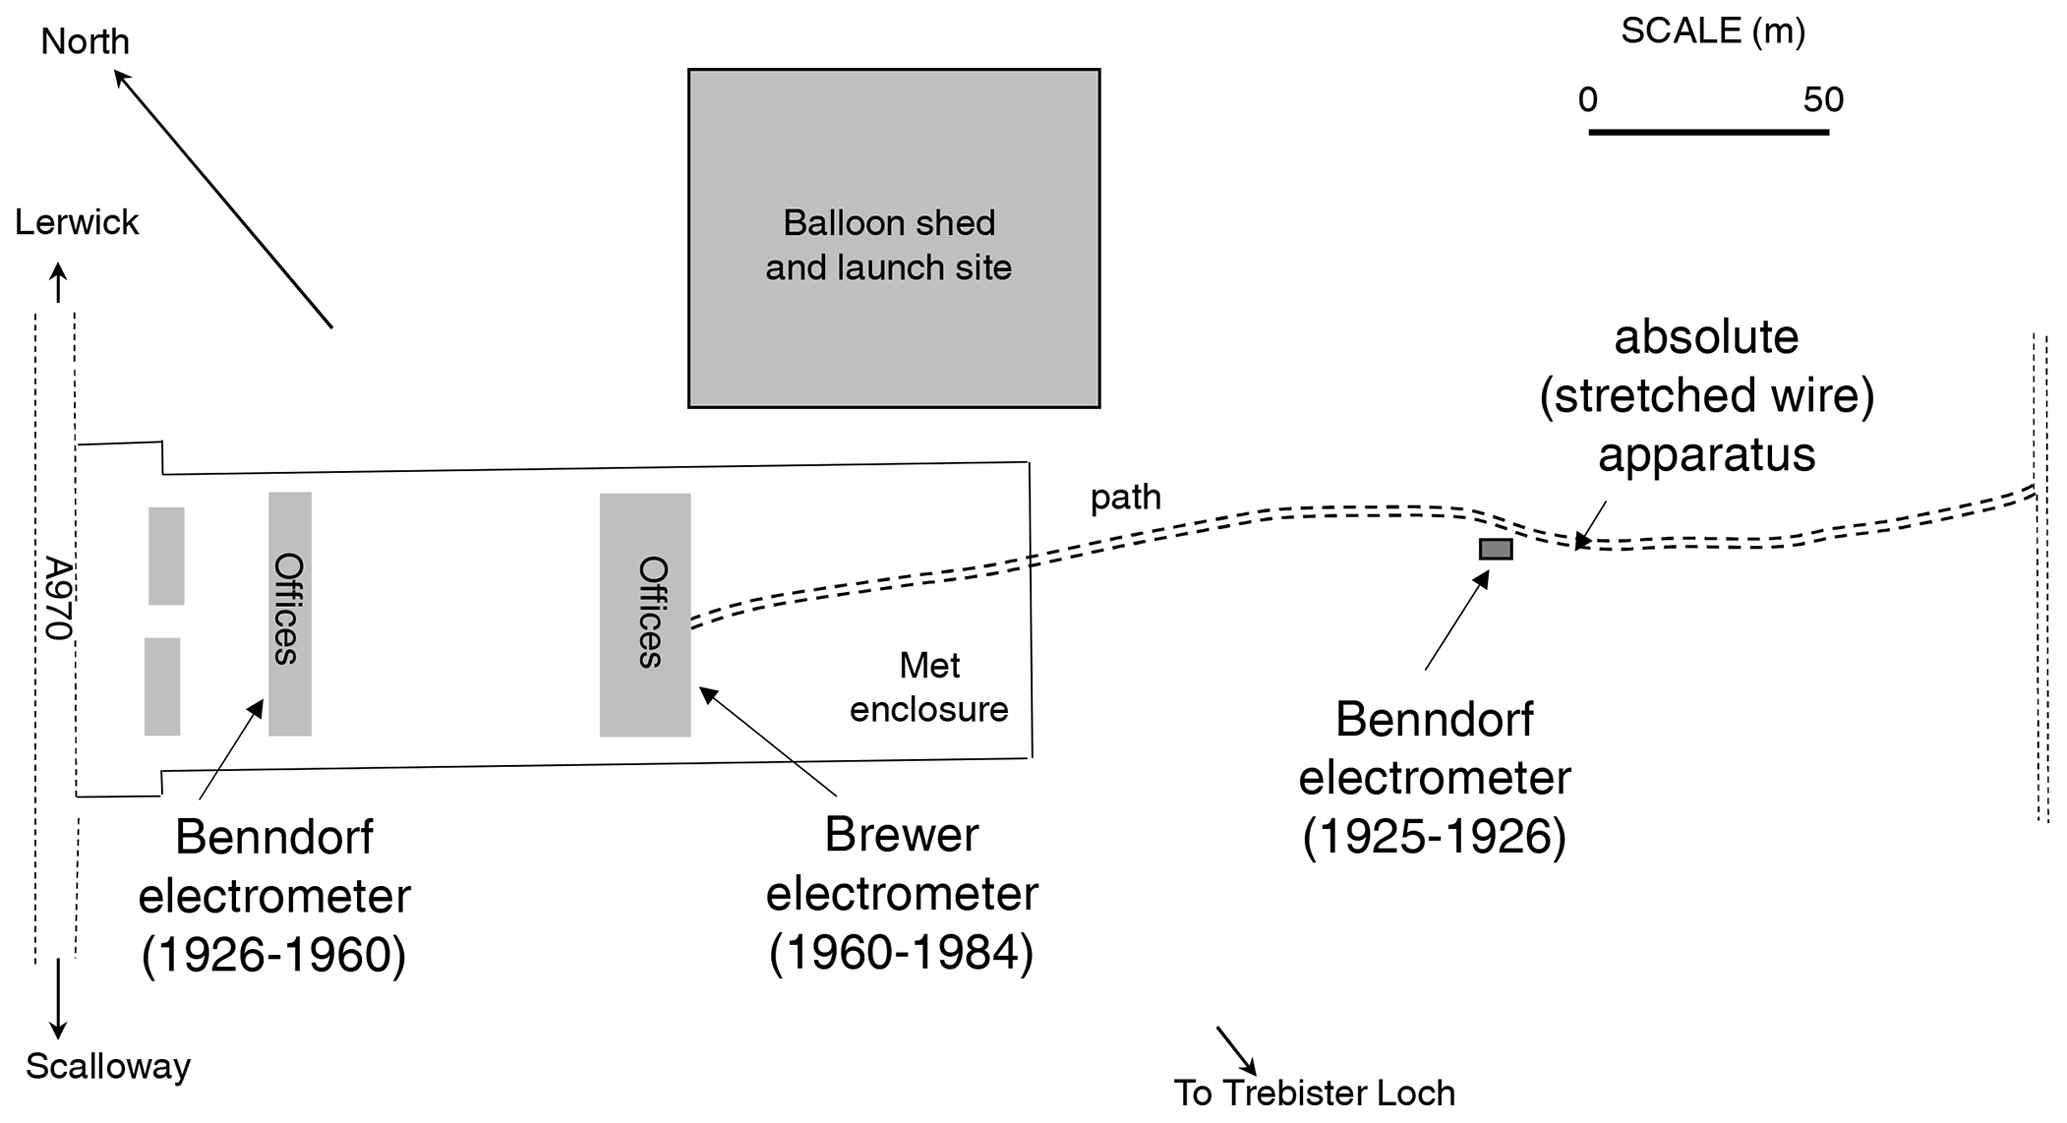
Figure 3Layout of the Lerwick Observatory site, from about 1961, based on the Observatories' Year Book descriptions. The principal positions of the atmospheric electricity sensors at different times through the measurement series are given.
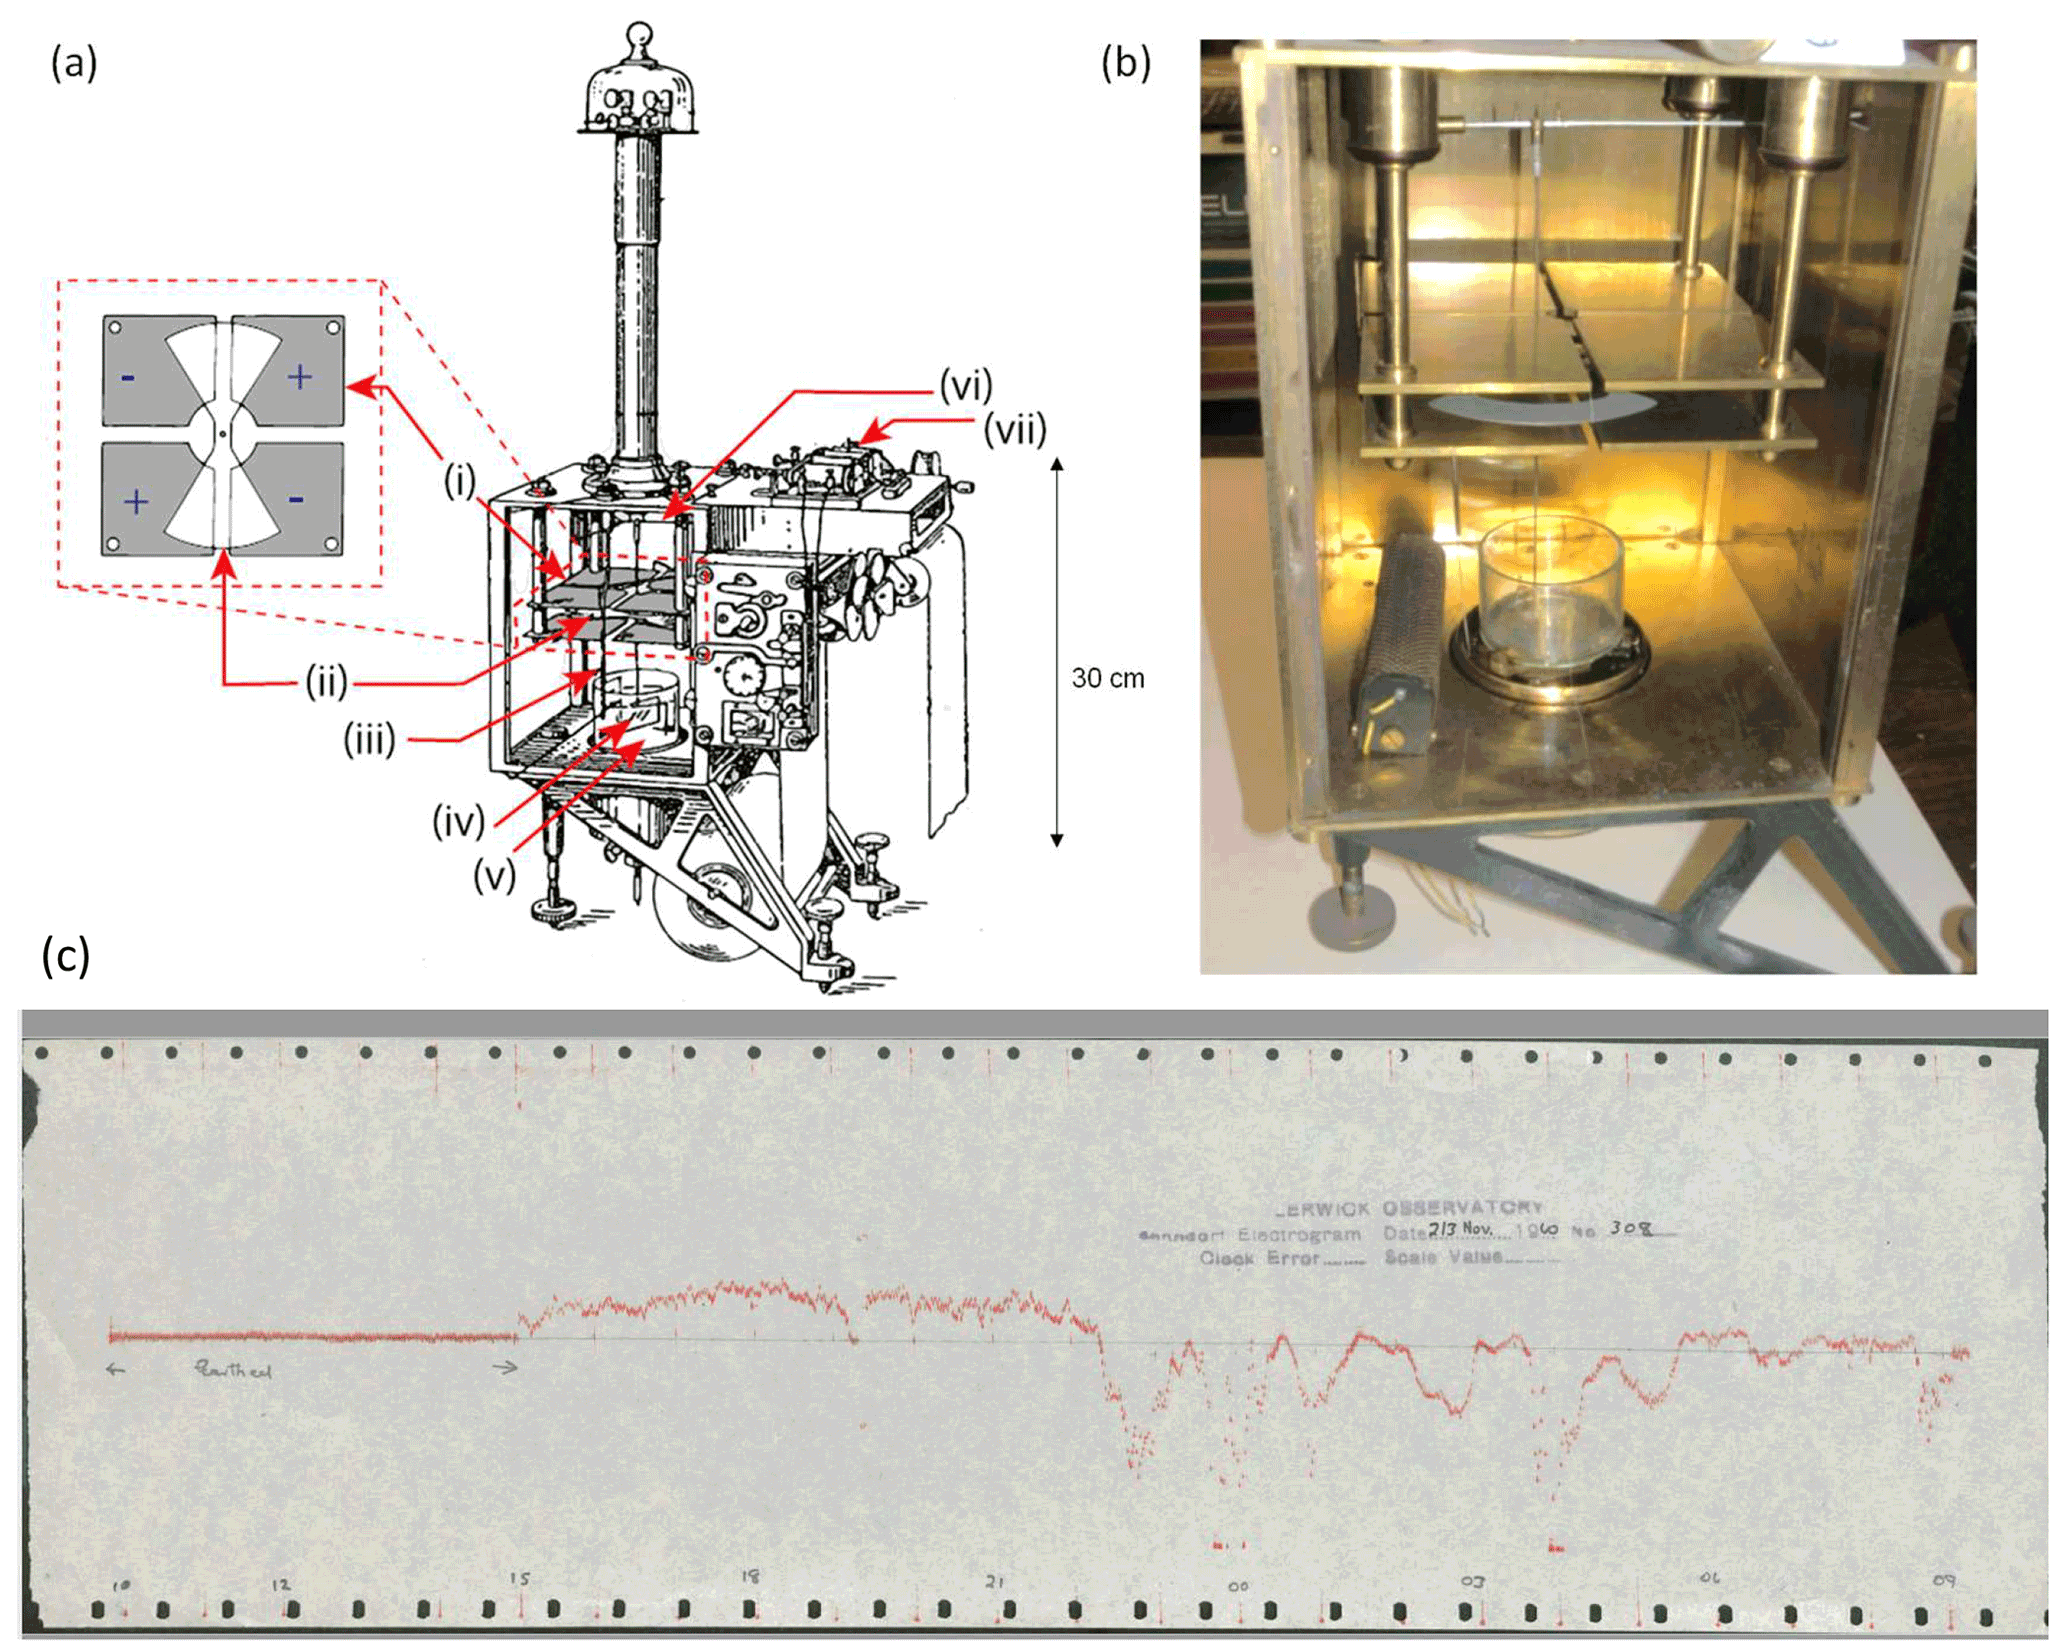
Figure 4The Benndorf electrometer. (a) Schematic view of a Benndorf device with recording paper, modified from Nagamachi et al. (2022), showing the following different components: (i) plate electrodes, (ii) quadrant plate, (iii) connection wire, (iv) mica plate, (v) sulfuric acid pot, (vi) pen-connecting rod, (vii) pen pressure adjuster. (b) Internal view of the Benndorf electrometer used at the Serra do Pilar Observatory, Porto, showing the acid pot and plate electrodes. (c) Benndorf electrometer paper chart, from Lerwick, for 2 November 1960. Photograph in panel (b) by Giles Harrison. Benndorf trace in panel (c) from the National Meteorological Archive.
The electrograph systems operated in a very consistent manner between 1927 and 1984, with the electrograph exposure calibrated to open-site exposure by comparison with a stretched wire apparatus (Fig. 5a) and electrometer (Fig. 5b). Evidence of the original support posts used remains (Fig. 5c), hence an almost identical arrangement in the same position could be employed again. In the following sections, further information on the operation of the instrumentation is summarised from different intervals during the measurements. Specific events in the history of these measurements are summarised in Table 1, which illustrates the considerable care and attention to detail needed to maintain the quality of the measurements. The aspects described below draw on the relevant volumes of the OYB and the unpublished notes of Richard Alexander Hamilton4 (R. A. Hamilton, Site History, Lerwick Observatory, unpublished).
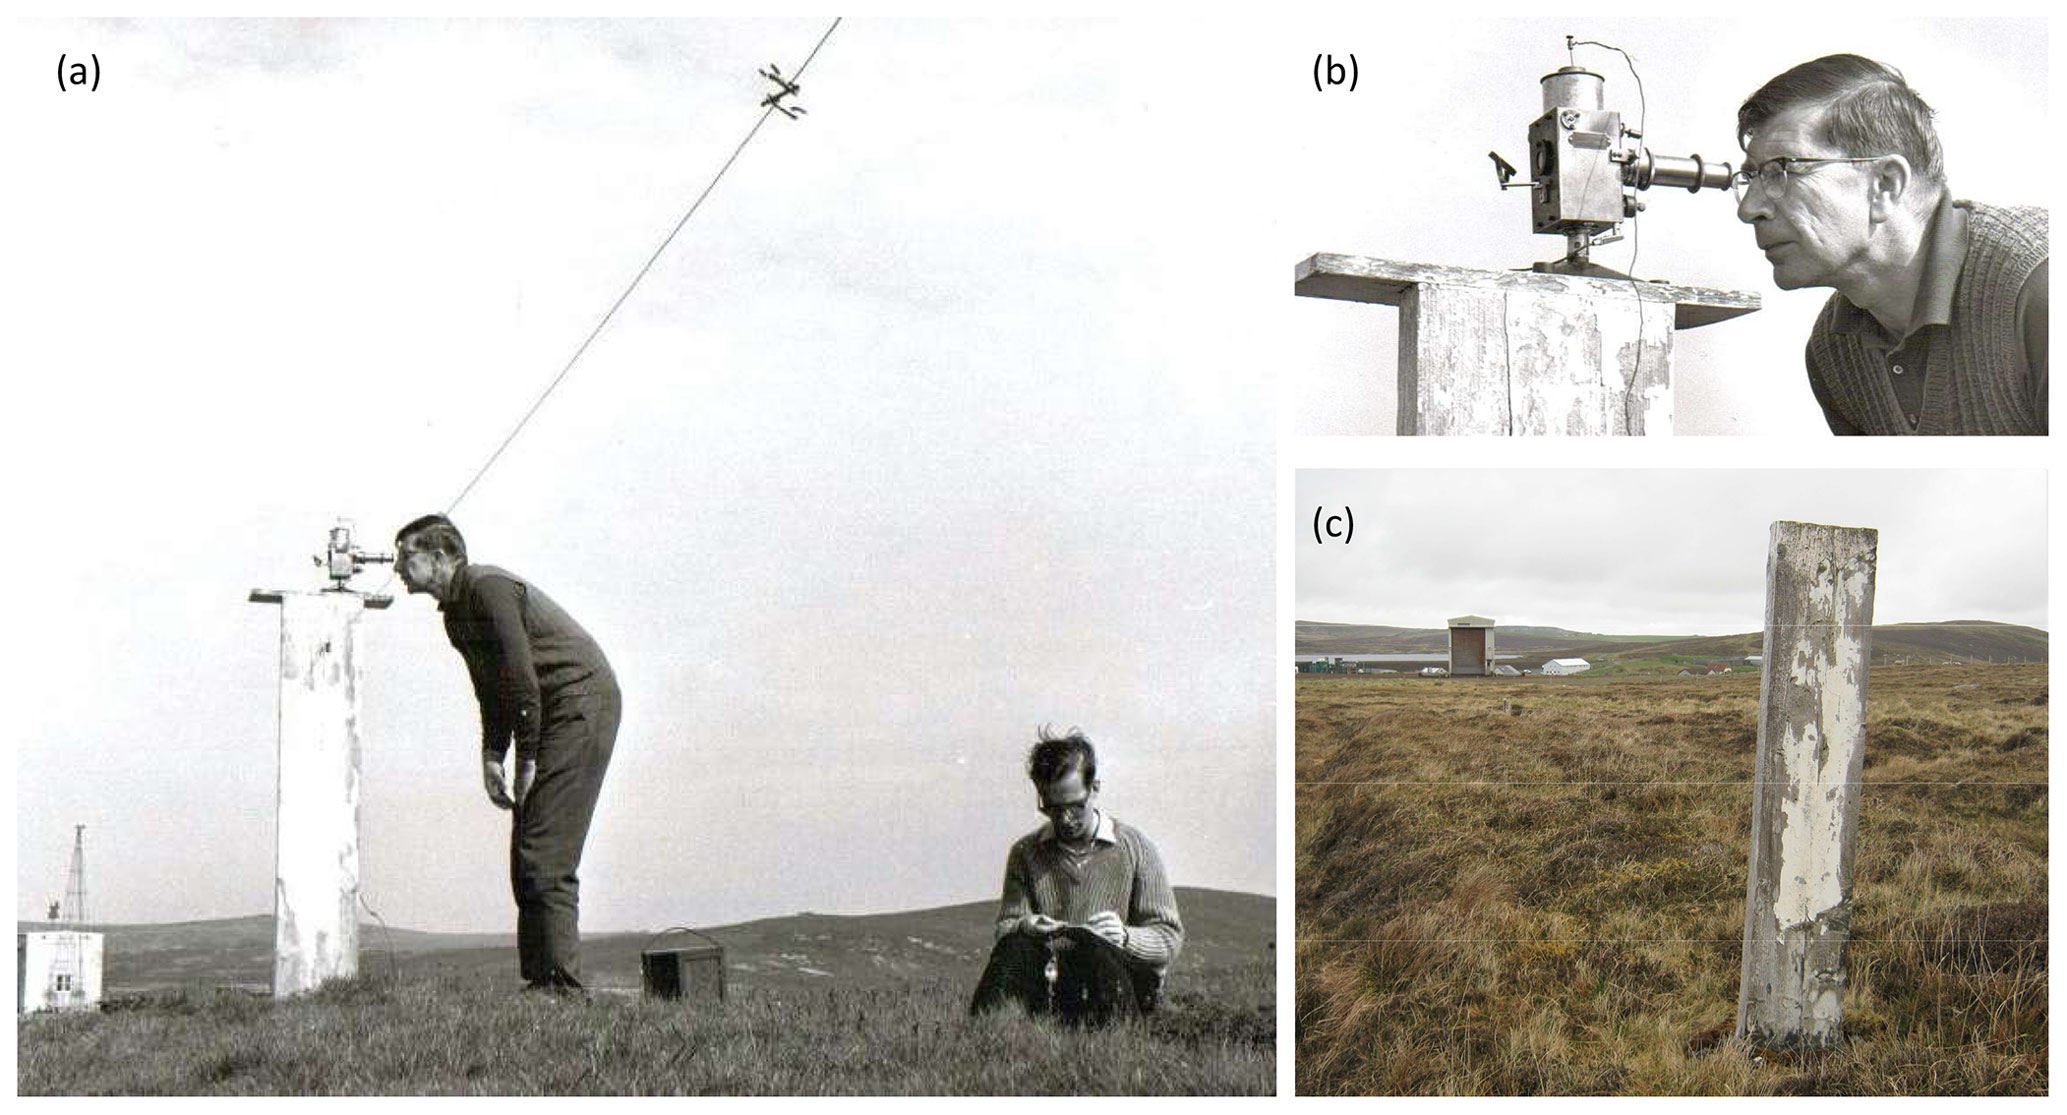
Figure 5(a) Use of a stretched wire, insulated at each end, to determine the potential at 1 m in the open (ca. 1963) with an electrometer. The Lerwick radiosonde balloon shed is in the background, and a radioactive source has been clipped to the midpoint of the wire. Observatory superintendent Richard Hamilton is operating the electrometer, with a student assistant. (b) Detail of the electrometer and crocodile clip connections. (c) One of the stretched wire posts still survives intact, with the remains of the electrometer support post in panel (a) also evident (image from May 2022). Photographs in panels (a) and (b) are from the Lerwick Observatory archive. Panel (c) has been provided by Norrie Lyall, Lerwick Observatory.
Table 1Summary of events in operation of the Lerwick atmospheric electricity apparatus.
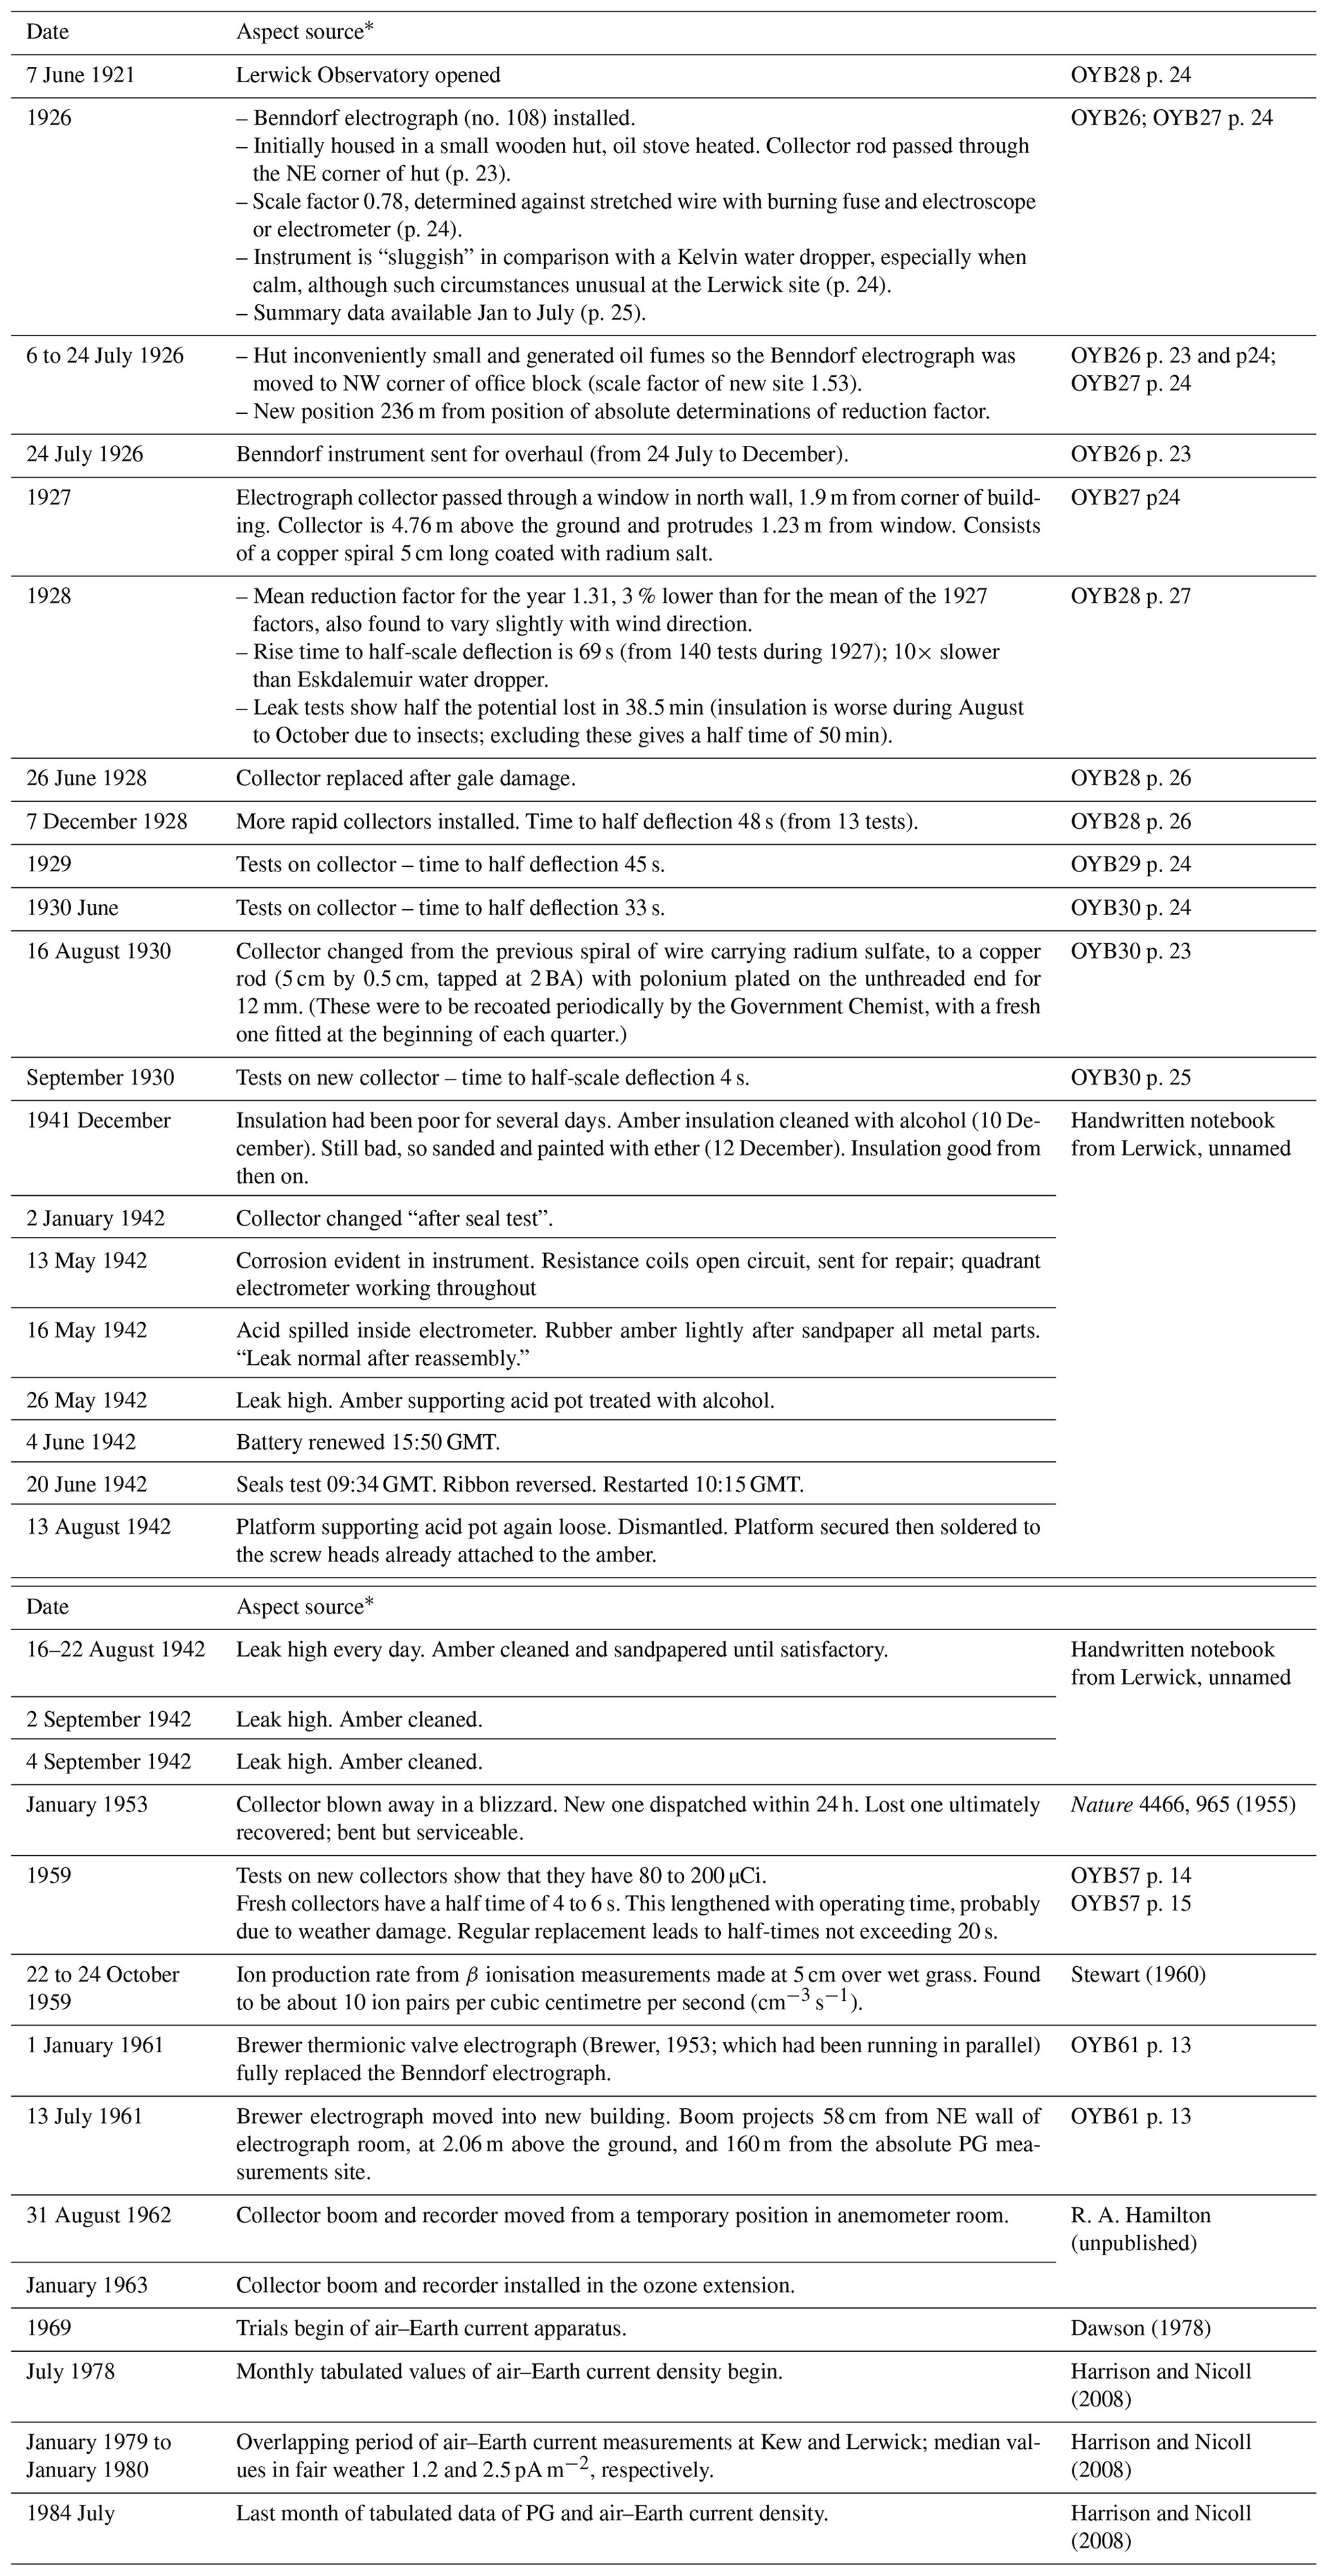
* OYByy refers to the annual volume of the Observatories' Year Book for the year 19yy (OYB, 1922–1967).
3.1 1921–1929
In 1922, the first site for electrograph was established towards the edge of the site with the building of a small wooden hut, occupying about 2 m2, with a ridged roof. It contained three brick pillars – one for the recording electrometer, another for the clockwork mechanism, and a third for the absolute electrometer for calibrations. The radioactive collector was a spiral of copper wire coated with radium within an adhesive varnish5. This sensor was exposed to the atmosphere at about 1 m from the hut's corner. Great difficulties resulted from damp around the apparatus, and, initially, from the lack of an absolute instrument for comparisons and calibration. An oil stove was kept burning continuously to alleviate the damp, together with small electric bulbs near the supports of the collector rod, which used sulfur insulators.
The Benndorf electrograph (Benndorf electrometer no. 108, manufactured by Ludwig Castagna, Vienna) arrived from Kew, on 8 August 1924, and a second electrostatic voltmeter to provide absolute reference observations was provided in the following year, on 30 March 1925. The electrograph system consisted of an exposed collector rod connected to the Benndorf electrometer with fine wire. Satisfactory measurements could not be obtained, due to the oil stove's fumes and the hut being inconveniently small and remote. The system was moved on 6 July 1926 to a more accessible position in the office block. There, the collector rod passed through a window in the northwestern wall, 1.9 m from the building's corner. The copper spiral collector was 4.76 m above the ground and projected 1.23 m. Timing for the electrograph was taken from the observatory's standard clock, itself synchronised by a daily time signal.
Initially, this new location for the apparatus was expected to be unsatisfactory, as it was likely to encounter distortion of the electric field by the buildings, and it was a large distance (236 m), from the previous site of the hut, where the absolute reference measurements were still made. These concerns turned out to be much less important than first anticipated. Results from the 1925 and 1926 measurements during this transition were not, however, published in full, with only a short summary of the results given in the OYB for the monthly mean PG at 03:00, 09:00, 15:00, and 21:00 GMT.
The absolute measurements of PG were made by the “stretched wire” method (the stretched wire system has also been known as a “passive wire antenna”), from 1926, from which an reduction factor for the Benndorf electrograph was computed to give the equivalent potential over open ground. The stretched wire was a horizontal length of uninsulated wire hung between insulators on two posts, with the wire many times longer than the height of the posts. This allowed the PG at the wire's height to be largely unaffected by the distorting effects of the supports on the atmospheric electric field. At Lerwick, two stout wooden posts 211 cm in height and 9.48 m apart were used to support the stretched wire, with a collector (at Lerwick this was initially a burning fuse, and later a radioactive (americium) source) in the centre, exactly 1 m above the ground. A standardising electrometer (of the Wulf design) was connected to one end of the wire to determine the potential. In total, 10 to 20 readings were obtained from the electrometer at minute intervals, and the reduction factor derived from comparing the mean of these values with the corresponding mean potential at the collector simultaneously recorded by the Benndorf. Smoothed monthly means of the reduction factors were derived, which were applied to the electrograph measurements.
There were 10 reduction factor determinations typically made each month, with, in 1927, values ranging from 1.31 to 1.43. The leakage rate of the system was, as a fraction of the rate of charging, in the winter and in the summer; this variation was included in the experiments determining the reduction factor, which was therefore ∼ 3 % lower in summer than winter. In 1928, the least mean monthly reduction factor was 1.19, and the greatest was 1.41. An attempt was made to relate the reduction factor to the wind direction, as larger values were associated with winds from the NE, S, SW, and W, in which directions the electrograph's collector had a good exposure. In other directions, flow was obstructed by buildings, and the extent of the reduction in the factor depended on the nearness of the obstructions to the collector. However, the effect was small, with the lowest mean values being 1.24 and 1.37 for winds from the SE and NE, respectively. In further experiments, three sets of PG measurements were made above an even surface near sea level. Of these experiments, two were at the Point of Trebister, 2 km SSE of the observatory, and the other near the Sands of Sound, 1 km to the east (Fig. 1c). In all, 10 series of observations were obtained. The mean electrograph reduction factor computed from these was 1.36, which is very similar to the values obtained by the standard tests at the observatory site.
3.2 1930–1939
In August 1930, a new type of collector was introduced, which consisted of polonium deposited on a copper rod about 4 cm long by 0.5 cm diameter. These rods were recoated periodically through an arrangement with the Government Chemist, with a fresh collector fitted at the start of each quarter. Otherwise, PG records with the Benndorf electrograph continued as before and were calibrated against absolute measurements made with the stretched wire and electrometer. The Wulf bifilar electrometers used for this were 5225 and 5716 (in 1931), and 5225 and 2965 (1932–1939), manufactured by Günther & Tegetmeyer, Brauschweig, Germany (Fricke, 2011).
3.3 1940–1950
Benndorf electrograph measurements and standardisation with the stretched wire continued with little or no change in procedure. R. A. Hamilton (unpublished) noted a suggestion from Edinburgh in 1940 that the electrograph recordings should cease, but this did not occur as the superintendent, Oliver Ashford, felt that the length of the record was already sufficient for it to be worth continuing. Intermittent trouble was experienced with the electrograph, but recording continued with only a few breaks. The general behaviour of the Benndorf electrograph was improved in 1942 after replacing the sulfuric acid with glycerine and the mica damping vane by a hook of copper wire. A new Wulf electrometer (no. 0157) was received in November 1948.
3.4 1950–1970
Throughout this period, the Lerwick PG measurements began to show anomalous reductions, which also occurred at Eskdalemuir, Porto, and Lisbon (Stewart, 1960). A reduction in PG due to radioactivity dispersal had been reported in Tucson, Arizona, following a nuclear detonation about 500 mi. (about 800 km) away in Nevada (Harris, 1955). It was concluded that the measurements at Lerwick were also affected by radioactivity contamination from distant nuclear weapons tests (Hamilton, 1965). When longer time series became available, a common effect was evident in data from the UK, Portugal, and Japan (Pierce, 1972)6, and radioactivity deposition processes were more extensively examined (Holzer, 1972).
During electrometer comparisons made in May 1960, variations in the reduction factors had been seen. This was investigated by a summer student in 1964, who found a marked PG variation with the wind direction. Greater PG values were found for southerly airstreams. By investigating the air flowing over Loch Trebister and through measurements made during freezing conditions, the radioactivity effects were deduced to arise only over land. This conclusion followed from two observations. First, during freezing conditions, which were assumed to prevent radioactive material from leaving the soil, the PG was increased. Second, over water, which would not have retained surface radioactive material, the PG was also increased. Together, these indicated that the conductivity was only being reduced over land.
As part of the move to new offices in 1960, the Benndorf electrograph was dismantled. From January 1960, a thermionic valve electrometer designed by Alan Brewer (1915–2007; long-term collaborator of G. M. B. Dobson at the University of Oxford and instrument scientist) replaced the Benndorf electrometer (Brewer, 1953) with a chart recorded added to provide the paper trace. This system is shown operating in Fig. 6. A comparison was made between the Benndorf and Brewer electrographs from May 1960, and the values correlated well. It was concluded that, although the Benndorf was a simple instrument to use, its sensitivity was inconsistent across its range. In addition, the Brewer electrometer was more complicated, and it was thought to be more difficult to identify malfunctions. When repairs were needed, however, the electrometer valves were readily changed.
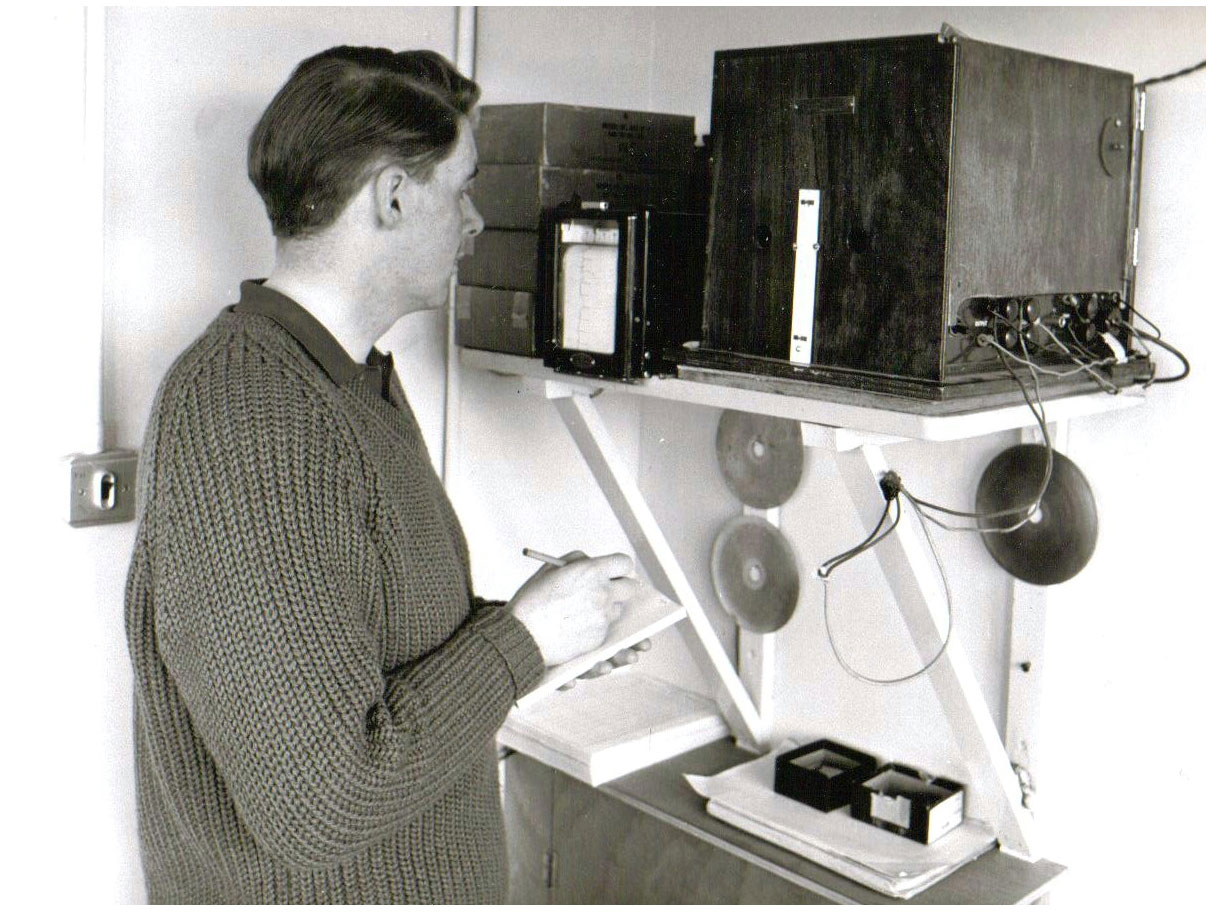
Figure 6Readings being taken from the Brewer valve electrometer's chart recorder, by Monty Georgeson, a scientific assistant at Lerwick Observatory from 1966. Photograph from the Lerwick Observatory archive.
Up to October 1961, when readings were made at the stretched wire, values were subsequently taken from the Benndorf or Brewer electrometer charts. After October 1961, simultaneous readings were made at the stretched wire and the electrometer. The Wulf electrometer was also calibrated for each observation. Early in 1962, the sulfur insulators for the electrograph collector were replaced by polytetrafluoroethylene (PTFE), which was found to be entirely trouble-free.
There was also a broadening of interest to include air–Earth current measurements, with a proposal to make continuous measurements at Kew, Eskdalemuir, and Lerwick (Hamilton and Paren, 1967). Trials of the air–Earth current7 apparatus began in 1969 (Dawson, 1978), using a well-insulated current-collecting plate, an electrometer current amplifier, and a recording device. Incandescent light bulbs were used to provide some local heating to reduce the effects of moisture. Some analogue chart paper rolls from this period exist, indicating a sustained period of evaluation, but the procedures were not sufficiently developed at that point to allow systematic tabulation.
3.5 1970–1985
The Brewer electrograph measurements continued in the established manner until July 1984. Experiments with conduction current density measurements continued, using instrumentation manufactured by Leonhard Saxer and Werner Sigrist. The sensor employed a collecting plate of area 0.5 m2 mounted flush with the ground above a 30 cm deep slate-lined pit, situated between the meteorological enclosure and the office block. The current from the plate was measured by the voltage developed across high-value (1010 to 1012Ω) resistors, using a mechanical Vibron chopper semiconductor electrometer (see also Harrison and Nicoll, 2008). The final output voltage signal was passed to the Met Office standard MODLE (Met Office Data Logging Equipment) recording system. Tabulations of conduction current density were produced from July 1978.
The PG values were tabulated as monthly sets of daily values in the annual volumes of the Observatories' Year Book until 1967, and thereafter on individual summary sheets taking a similar form with hourly values until 1984, and stored in the National Meteorological Archive. The methods for selecting representative values evolved during the 20th century. Initially, a geomagnetism-inspired approach was adopted, with a later method becoming established for selecting “fair weather” values in the second half of the 20th century.
During the 1930s, the OYBs were published about 2 years in arrears, with the 1937 volume being the last to be published before the war. The 1935 OYB contains photographs and a site plan which show that, although no longer used, the original atmospheric electricity hut was still in position. Due to the war, the 1938 volume was published in 1955, and the 1939 volume, with the whole introductory section virtually omitted, in 1957. Because of the need to catch up from the war, only very brief introductions to the measurements were included in the OYB during 1950–1956. From 1957, a full introduction was included. The 1950–1959 volumes were published in 1960 and 1961. Following the reorganisation of geophysical observations in the UK, publication of the OYB by the Met Office ceased in 1967. The UK atmospheric electricity data were then published by the former USSR's Hydrometeorological Service, in their monthly issue of Results of Ground Observations of Atmospheric Electricity. The final (1967) edition of the Observatories' Year Book reported that this arrangement, organised through the World Meteorological Organisation, had begun in January 1964.
All atmospheric electricity measurements ceased at Lerwick Observatory in 1984, with the last monthly tabulation being for July 1984.
4.1 Basic data record
The daily values included hourly mean values obtained over 60 min periods, centred at the exact hour (GMT) up until 1931, and on the half-hour thereafter. The equivalent PG in the open was provided, which was obtained by multiplying the chart reading by the reduction factor. Values were given for 03:00, 09:00, 15:00, and 21:00 GMT and hourly on undisturbed days. When it was difficult to obtain a stable reading, typically due to precipitation, the entry was marked as “z”, with a “+”, “−”, or “±” added to indicate the likely polarity of the mean value. In the tabulations, two sets of mean values were provided, namely
- (a)
all hours with positive values, and
- (b)
the means for all days on which all four 6 h values were recorded.
Values during hours when the trace passed off the top of the chart were included in (a), with the upper limit of registration being taken as the value for that period, i.e. essentially a saturation value. The range of the electrograph was about ±1500 V m−1, which was only likely to be exceeded beneath strongly electrified clouds and thunderstorms.
4.2 Classification by electrical character
Initially, the classification of the atmospheric electricity data was strongly influenced by the practices in magnetic recording, specifically that of assigning a description to the day's trace as quiet or disturbed. Following the same approach, the typical variations found in a day's recordings were classified by means of an electric character figure, according to the following:
- (0)
a day (midnight to midnight) with no negative PG recorded,
- (1)
a day with negative PG excursions totalling less than 3 h, and
- (2)
a day with negative PG totalling more than 3 h.
In 1927, electric character letters were added to the classification system. These were intended to show, in any of the hourly periods of the day, the following:
- (a)
that the PG range did not exceed 1000 V m−1,
- (b)
that the PG exceeded 1000 V m−1 at least once, but less often than six times, and
- (c)
that the PG exceeded 1000 V m−1 for six or more times.
From 1927, the symbols “>” and “<” were introduced to designate that, during the measurement period, the PG had exceeded the range of the electrograph. When the measurement was estimated due to a defect, the value was enclosed in parentheses.
From 1928, the electrical character description of each day was extended to include the duration of negative potential for each day. If the electrograph record failed but no precipitation had fallen, then it was assumed that the PG had remained positive; if, however, precipitation fell when there was no record, then no estimate was made, except when the missing segment was sufficiently small and any precipitation sufficiently continuous to allow reasonable interpolation.
In the OYB, a table of the greatest PG values (positive or negative) was given together with a list of when the PG was negative for prolonged periods and with only short excursions being positive. From 1936 onwards, Lerwick sent, to Edinburgh for forwarding to Oliver Gish8 in Washington, annual tables giving the annual frequency of days of character 0, 1, 2, and the monthly total duration of negative PG.
4.3 Classification by fair weather
In January 1957, the classification approach for the PG was fundamentally changed to use the weather conditions at the time of the measurement. This offered an independent classification method for identifying times with minimal local effects on the measurements (Harrison and Nicoll, 2018). An hour was regarded as having fair weather (FW) conditions if the following four conditions were fulfilled:
-
there were no hydrometeors
-
there was no low stratus cloud
-
there was less than three-eighths cumuliform cloud
-
the mean hourly wind speed was less than 8 m s−1.
Hours failing to meet the full FW criteria, but during which no hydrometeors (i.e. rain, snow, and hail) were observed, were also marked. A great advantage of this FW approach was that, since these classifications were applied to each hour individually, daily mean values could still be determined even if the day was partially disturbed. Many more daily mean values could therefore be obtained despite disturbed conditions. From January 1957 to December 1966 when both classification systems were in use, 1879 daily values were found using the FW classification system, but for only 807 d by using the daily character figure method.
Continuous air–Earth current measurements are available in the Met Office archive as tabulated data forms from July 1978 to July 1984. These are provided as hourly values in a similar manner to the PG, with values given for hours which were identified as fair weather or no hydrometeors.
Images of some Lerwick Observatory tabulated hourly record sheets from early and late in the measurements are given in Fig. 7. The early record sheet (Fig. 7a) was completed by hand, with values read directly from the electrogram trace; the later one is typewritten. In the later one (Fig. 7b), the hours which did not meet the fair weather criteria were marked with a superscript “+”. Some basic analysis, such as counting values and computing averages, is also included on the later record sheet.
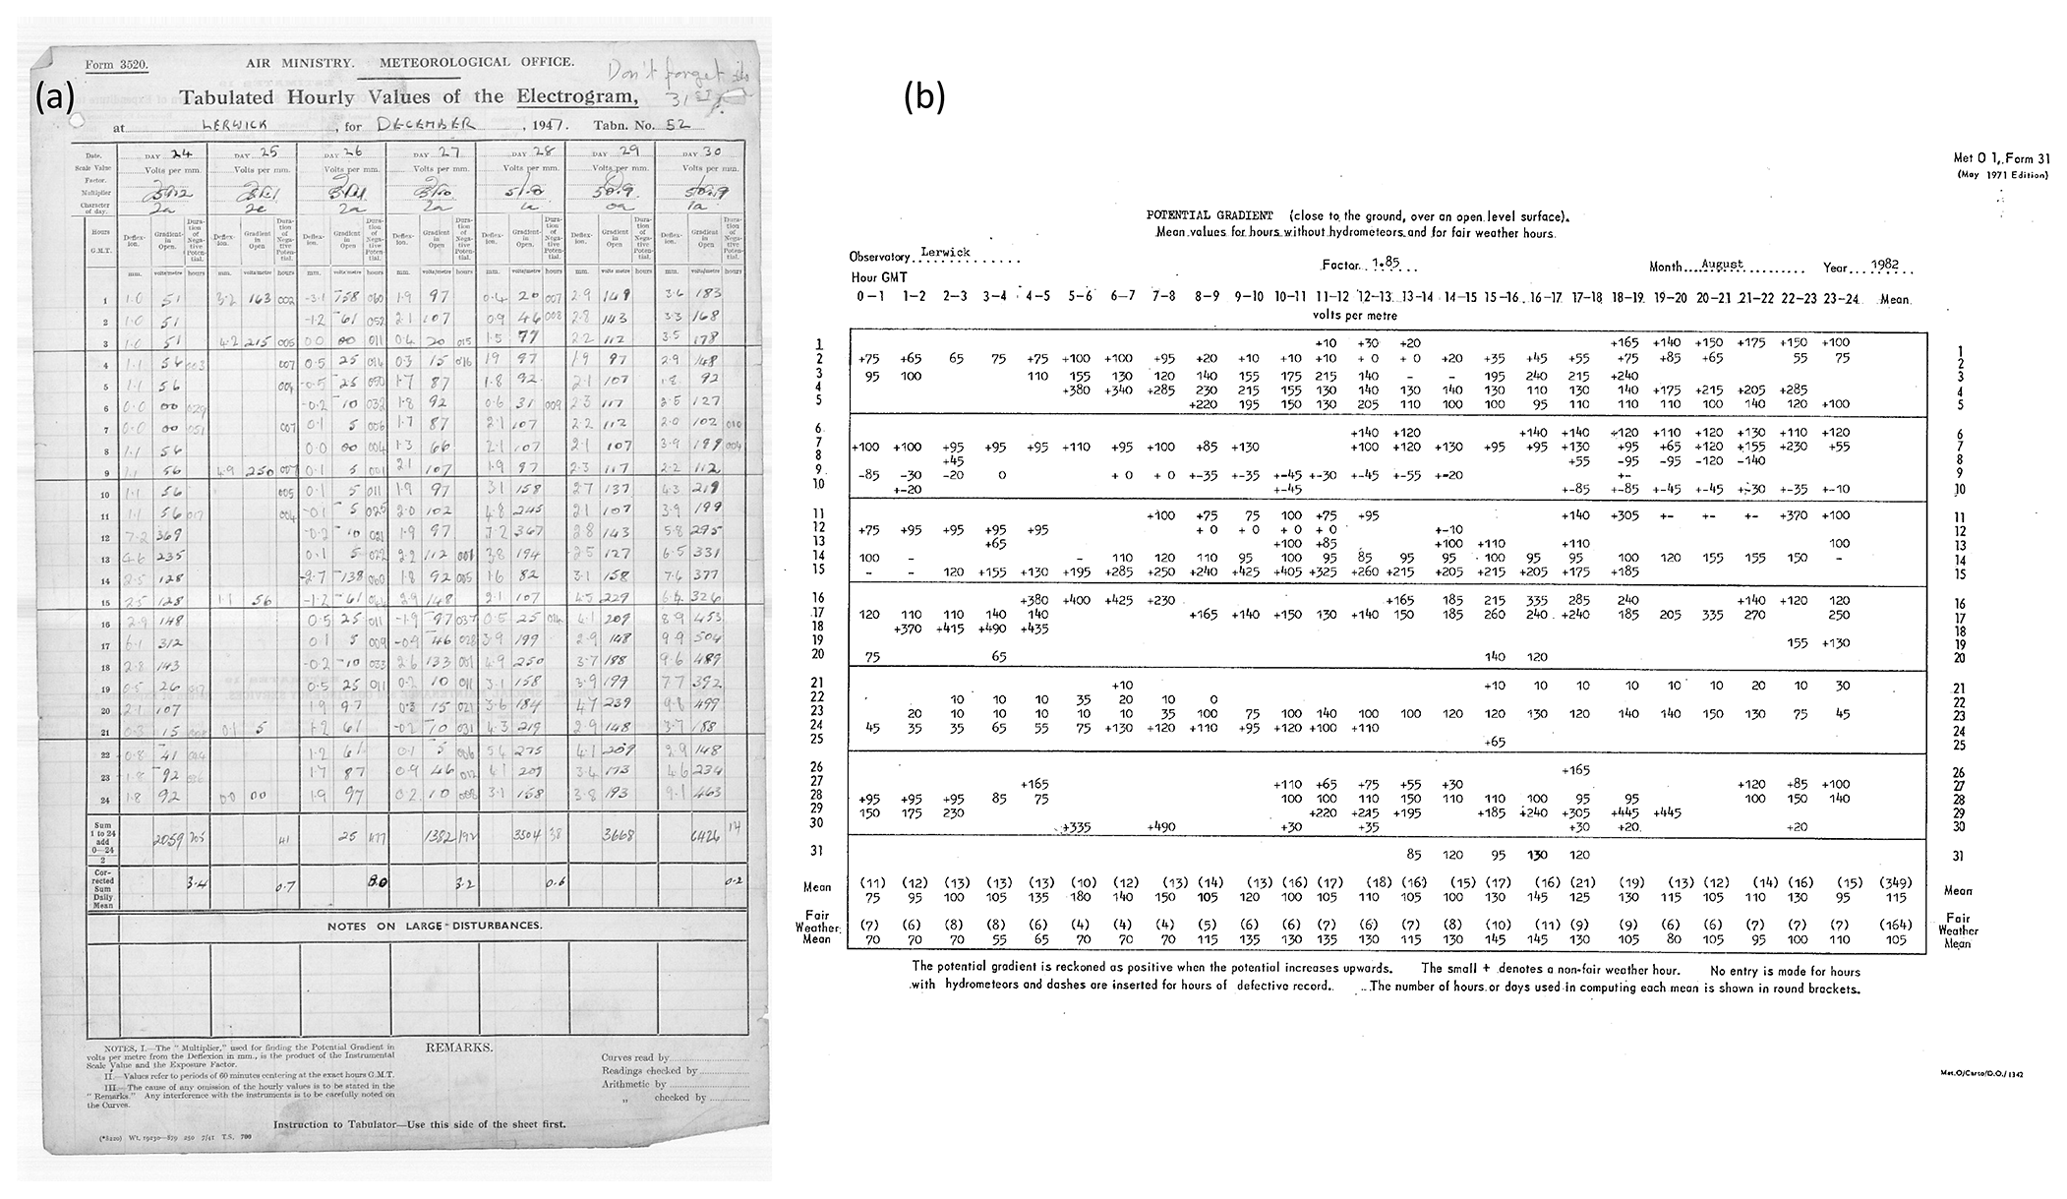
Figure 7Observatory record sheets for (a) December 1947 and (b) August 1982. In panel (a), the overall character of a day's measurements is given towards the top of each daily column, and in panel (b), an hourly classification was applied for the presence or absence of fair weather conditions. Images are from material in the Met Office National Meteorological Archive.
Little has been written about the overall scientific importance of the Lerwick atmospheric electricity data, but it is clearly an important atmospheric dataset which deserves full digitisation and further study. In the first decade of data, the PG measurements at Lerwick corroborated those obtained simultaneously by the Carnegie on its final voyage, such for 1 December 1928 (Fig. 8a), and contributions continued to be sent to the Carnegie Institution of Washington's scientists into the late 1930s.
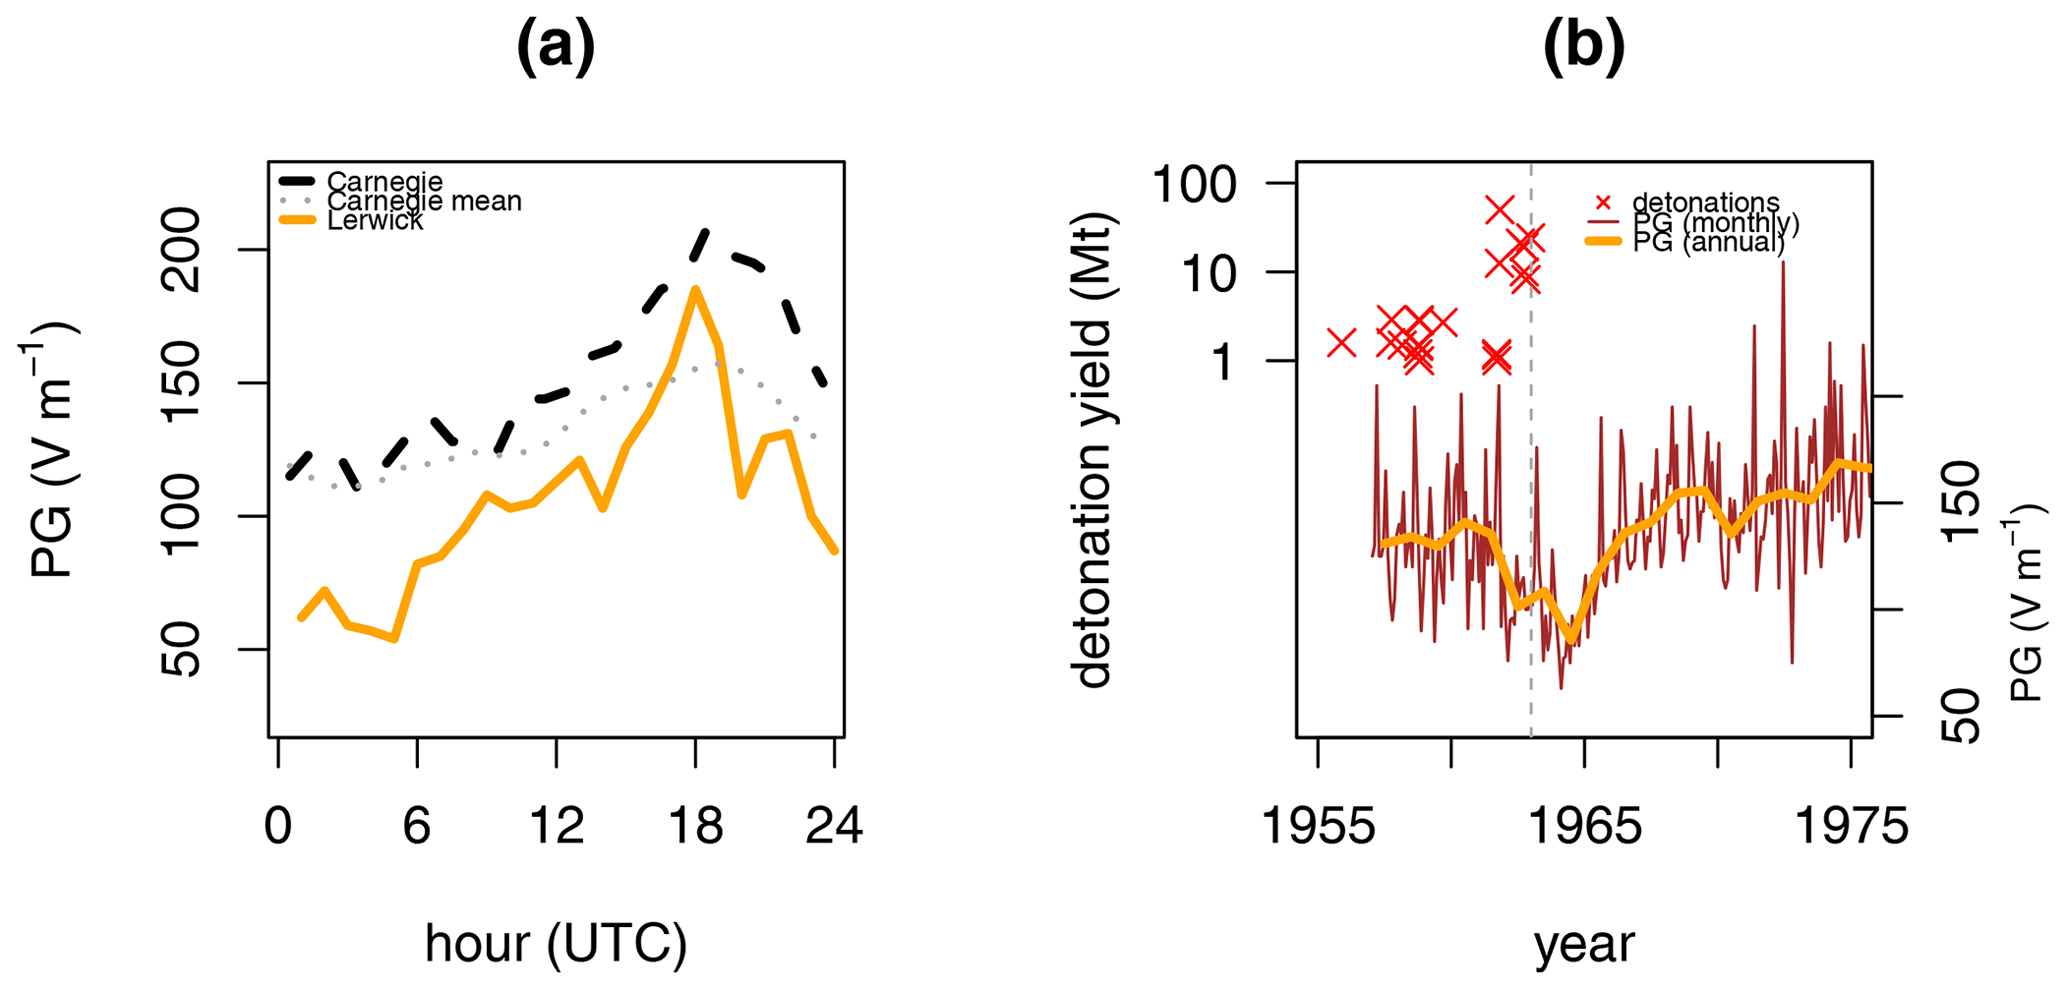
Figure 8(a) Hourly values of PG on 1 December 1928, on board the Carnegie, which was then at 29∘ S, 245.2∘ E (solid line) and recorded simultaneously at Lerwick (dashed line). A thin dotted line shows the averaged values from the Carnegie for cruise 7, (data from Harrison, 2013). (b) Northern Hemisphere nuclear weapons atmospheric detonations greater than 0.5 Mt (crosses; from Warner and Kirchman, 2000) and Lerwick fair weather PG as annual (thick line) and monthly (thin line) means. The vertical dashed line marks the beginning of 1963, and the Partial Nuclear Test Ban Treaty was agreed in August 1963.
The most significant contribution during the time of the measurements was explaining that the appreciable PG reduction in the 1950s and 1960s, as illustrated in Fig. 8b, was due to radioactive contamination following an intense period of northern hemispheric atmospheric nuclear weapons detonations. Lerwick's data were important for resolving this, as, unlike the companion site at Eskdalemuir, it was well removed from possible radioactivity releases from the nuclear site on the coast of Cumbria, then known as Windscale (from 1956–1981; it is now called Sellafield; see also Fig. 1a). It can only have been alarming for the scientists at Lerwick in the 1950s and early 1960s to observe major changes in a quantity which had shown consistent values for the previous 3 decades. Hence it is very much to their credit that the measurements were continued and investigated to find and report the cause (Hamilton, 1965). Although much less well known, it is not unreasonable to compare this analysis of surprising change with the discovery of the ozone hole over Antarctica in the 1980s. In both cases, data that were initially thought to be unsatisfactory for an unknown reason were explored for an explanation. Ultimately, extraordinary possibilities were justified by extraordinary evidence, and international agreements followed to address the environmental effects: the Partial Nuclear Test Ban treaty banning atmospheric nuclear tests was signed in 1963 (arguably hastened by the Cuban Missile Crisis of October 1962), and the Montreal Protocol to phase out ozone-depleting substances was signed in 1989.
Since then, the thoroughness of the past atmospheric electricity and meteorological measurements made at Lerwick has allowed the investigation of the effects of enhanced radioactivity on the weather, leading to the finding of a small associated increase in rainfall (Harrison et al., 2020). A further discovery in the Lerwick PG data from the 1970s has been its strong link to climate, specifically to variations in Pacific Ocean temperatures associated with the El Niño–Southern Oscillation (Harrison et al., 2011). This illustrates the special value of data from a site where local influences are small, allowing global effects – in this case internal variability in the climate system – to be uncovered.
The decision to cease the atmospheric electricity measurements in 1984 almost certainly followed directly from the end of the measurements associated with the closure of Kew Observatory in 1981. In the announcement about Kew (in Meteorological Magazine, Vol. 109, p. 215, 1980), mention is made of the loss of “a few specialist measurements (such as atmospheric electricity … and air pollution)”. The 1984 cessation of Lerwick's measurements occurred when the value of a long data series was relatively poorly appreciated in terms of environmental change and came, unfortunately, shortly before the 1986 Chernobyl reactor accident, for which the value of PG measurements would have been demonstrated again. Nevertheless, even with the truncated dataset, it has been possible to derive new scientific results, and Lerwick must be considered an exceptionally well-characterised and suitable site for any future atmospheric electricity monitoring.
Atmospheric electricity measurements in the UK have a long history and were competently pursued at Kew, Eskdalemuir, and, especially, Lerwick over a long time. They are now of renewed relevance because of the broader interest in climate-related quantities, which the Lerwick data have demonstrated includes the global atmospheric electric circuit. For climate-related atmospheric electricity research, the PG measurements at Lerwick are especially valuable because of the minimal interference from air pollution. The well-characterised atmospheric electrical properties of Lerwick Observatory obtained over the majority of the 20th century strongly support the prospects of further measurements there, with the modern durable instrumentation now available9.
Scans of the annual volumes of the Observatories' Year Book for Lerwick are available at http://www.geomag.bgs.ac.uk/data_service/data/yearbooks/ler.html (British Geological Survey, 2022).
RGH drafted the initial paper, with help from JCR. Both RGH and JCR revised the paper.
The contact author has declared that neither of the authors has any competing interests.
Publisher’s note: Copernicus Publications remains neutral with regard to jurisdictional claims in published maps and institutional affiliations.
This article is part of the special issue “Atmospheric electrical observatories”. It is not associated with a conference.
We thank Alan Gair for Fig. 2. Hugo Silva (University of Evora) arranged access to the Benndorf electrometer previously used at the Serra do Pilar Observatory, shown in Fig. 4. Figure 5a and b are archive material from Lerwick Observatory. Figure 7a and b were provided by the Met Office, and the Met Office originally obtained the data shown in Fig. 8. Further help was provided by the following Met Office staff: Norrie Lyall, current station manager, Paul Nelson, Graeme Marlton, and Mark Beswick at the National Meteorological Archive. Daniel Bennett (BBC Shetland) provided further historical sources.
This paper was edited by Kristian Schlegel and reviewed by two anonymous referees.
Airy, G.: Magnetical and meteorological observations made at The Royal Observatory, Greenwich in the year 1847, London, Board of the Admiralty, Palmer and Clayton, 1847.
Aplin, K. L. and Harrison, R. G.: Lord Kelvin's atmospheric electricity measurements, Hist. Geo Space. Sci., 4, 83–95, https://doi.org/10.5194/hgss-4-83-2013, 2013.
Ashford, O.: A history of Lerwick Observatory, in: Proceedings of a conference held at St Mary's College, University of Durham, 5–7 September 1991, in celebration of 150 years of meteorology in Durham, edited by: Giles, B. D. and Kenworthy, J. M., University of Durham, 1994.
Benndorf, H.: Über ein mechanisch registrierendes elektrometer für luftelektrische messungen, Physische Zeitschrift, 7, 98–101, 1906.
Bennett, A. J. and Harrison, R. G.: Atmospheric electricity in different weather conditions, Weather, 62, 277–283, https://doi.org/10.1002/wea.97, 2007.
Bennett, D.: A bomb, a song, a rabbit – the first WW2 bombs to fall on British soil, https://www.bbc.co.uk/news/uk-scotland-north-east-orkney-shetland-50354168 (last access: 20 May 2022), 2019.
Brewer, A. W.: An electrometer valve voltmeter of wide range, J. Sci. Instrum., 30, 91–92, https://doi.org/10.1088/0950-7671/30/3/308, 1953.
British Geological Survey: Observatories' Year Book for Lerwick, British Geological Survey [data set], http://www.geomag.bgs.ac.uk/data_service/data/yearbooks/ler.html, last access: 1 August 2022.
Dawson, A. E.: Instrument for measuring the air-earth-current density, unpublished notebook, Lerwick Observatory, 1978.
Fricke, G. A.: Günther & Tegetmeyer 1901–1958; Instrumente für die Wissenschaft aus Braunschweig, AF-Verlag, 2011.
Gilbert, W.: De Magnete, Magneticisque Corporibus, et de Magno Magnete Tellure [On the Magnet and Magnetic Bodies, and on That Great Magnet the Earth], https://archive.org/details/williamgilbertc00wriggoog (last access: 1 August 2022), 1600.
Gish, O. H.: Evaluation and Interpretation of the Columnar Resistance of the Atmosphere, J. Geophys. Res., 49, 159–168, https://doi.org/10.1029/te049i003p00159, 1944.
Gish, O. H. and Sherman, K. L.: Meteorological features indicated by air-conductivity measurements made on flight Of Explorer II, EOS, 17, 152–156, https://doi.org/10.1029/TR017i001p00152, 1936.
Hamilton, R. A.: Secular and other changes of atmospheric electrical potential gradient at Lerwick, Q. J. Roy. Meteor. Soc., 91, 348–352 https://doi.org/10.1002/qj.49709138910, 1965.
Hamilton, R. A. and Paren, J. G.: The influence of radioactive fallout on the atmospheric potential gradient, Meteorol. Mag., 96, 81–85, 1967.
Harper, W. G.: Lerwick Observatory, Meteorol. Mag., 79, 309–314, 1950.
Harris, D. L.: Effects of radioactive debris from nuclear explosions on the electrical conductivity of the lower atmosphere, J. Geophys. Res., 60, 45–52, 1955.
Harrison, R. G.: An antenna electrometer system for atmospheric electrical measurements, Rev. Sci. Instrum., 68, 1599–1603, https://doi.org/10.1063/1.1147932, 1997.
Harrison, R. G.: Twentieth-century atmospheric electrical measurements at the observatories of Kew, Eskdalemuir and Lerwick, Weather 58, 11–19, https://doi.org/10.1256/wea.239.01, 2003.
Harrison, R. G.: Long-term measurements of the global atmospheric electric circuit at Eskdalemuir, Scotland, 1911–1981, Atmos. Res., 70, 1–19, https://doi.org/10.1016/j.atmosres.2003.09.007, 2004.
Harrison, R. G.: The Carnegie curve, Surv. Geophys., 34, 209–232, https://doi.org/10.1007/s10712-012-9210-2, 2013.
Harrison, R. G. and Nicoll, K. A.: Air-earth current density measurements at Lerwick; implications for seasonality in the global electric circuit, Atmos. Res., 89, 181–193, https://doi.org/10.1016/j.atmosres.2008.01.008, 2008.
Harrison, R. G. and Nicoll, K. A.: Fair weather criteria for atmospheric electricity measurements, J. Atmos. Sol.-Terr. Phy., 179, 239–250, https://doi.org/10.1016/j.jastp.2018.07.008, 2018.
Harrison, R. G., Joshi, M., and Pascoe, K.: Inferring convective responses to El Niño with atmospheric electricity measurements at Shetland, Environ. Res. Lett., 6, 044028, https://doi.org/10.1088/1748-9326/6/4/044028, 2011.
Harrison, R. G., Nicoll, K. A., Ambaum, M. H. P., Marlton, G. J., Aplin, K. L., and Lockwood, M.: Precipitation modification by ionization, Phys. Rev. Lett., 124, 198701, https://doi.org/10.1103/PhysRevLett.124.198701, 2020.
Hatakeyama, H.: On Benndorf's Self-recording Electrometer, J. Meteorol. Soc. Jpn., 12, 501–510, 1934.
Holzer, R. E.: Atmospheric electrical effects of nuclear explosions, J. Geophys. Res., 77, 5845–5855, 1972.
Macdonald, L. T.: Kew Observatory and the Evolution of Victorian Science, 1840–1910, University of Pittsburgh Press, https://doi.org/10.2307/j.ctv1fxmdj, 2018.
McIntosh, D. H.: Obituary: Richard Alexander Hamilton, OBE, FRSE 1912–1991, Q. J. Roy. Meteor. Soc., 117, 853–854, 1991.
Nagamachi, S., Arita, S., and Hirota, E.: Historical data of atmospheric electric field observations in Japan, Geosci. Data J., https://doi.org/10.1002/gdj3.143, 2022.
Nicoll, K. A., Harrison, R. G., Barta, V., Bor, J., Brugge, R., Chillingarian, A., Chum, J., Georgoulias, A. K., Guha, A., Kourtidis, K., Kubicki, M., Mareev, E., Matthews, J., Mkrtchyan, H., Odzimek, A., Raulin, J.-P., Robert, D., Silva, H. G., Tacza, J., Yair, Y., and Yaniv, R.: A global atmospheric electricity monitoring network for climate and geophysical research, J. Atmos. Sol.-Terr. Phy., 184, 18–29, https://doi.org/10.1016/j.jastp.2019.01.003, 2019.
OYB: The Observatories' Year Book, annual volumes for 1922–1967, Meteorological Office, HMSO, London, UK, 1922–1967.
Pierce, E. T.: Radioactive fallout and secular effects in atmospheric electricity, J. Geophys. Res., 77, 482–487, 1972.
Ratcliffe, R. A. S.: Meteorologist's Profile – Richard Hamilton, Weather, 47, 387–388, https://doi.org/10.1002/j.1477-8696.1992.tb07102.x, 1992.
Ronalds, F.: On photographic self-registering meteorological and magnetical instruments, Philos. T. R. Soc. Lond., 137, https://doi.org/10.1098/rstl.1847.0010, 1847.
Stewart, K. H.: Some recent changes in atmospheric electricity and their cause, Q. J. Roy. Meteor. Soc., 86, 399–405, https://doi.org/10.1002/qj.49708636912, 1960.
Takeda, M., Yamauchi M., Makino, M., and Owada, T.: Initial effect of the Fukushima accident on atmospheric electricity, Geophys. Res. Lett., 38, L15811, https://doi.org/10.1029/2011GL048511, 2011.
Tyldesley, J. B.: Fifty years at Lerwick Observatory, Meteorol. Mag., 100, 173–179, 1971.
Walker, M.: History of the Meteorological Office, Cambridge University Press, Cambridge, https://doi.org/10.1017/CBO9781139020831, 2011a.
Walker, M.: Reminiscences of Lerwick, History of Meteorology and Physical Oceanography Special Interest Group Newsletter, 11–14, https://www.rmets.org/sites/default/files/2019-03/hisnews1101_0.pdf (last access: 1 August 2022), 2011b.
Warner, F. and Kirchmann, R. J. C.: Nuclear test explosions – Environmental and Human Impacts, SCOPE (Scientific Committee on Problems of the Environment), Vol. 59, Wiley, 2000.
Warzecha, S.: Results of atmospheric electricity measurements at Swider after the Chernobyl nuclear power plant accident, Publications of the Institute of Geophysics of the Polish Academy of Sciences, 198, 137–153, 1987.
Sullom Voe, Shetland, was the first part of the UK to be bombed in the Second World War, on 13 November 1939 (Bennett, 2019).
The vertical component of the atmospheric electric field Ez and the potential gradient F are related by .
In fair weather, the PG is positive and is typically 100 to 150 V m−1. During precipitation, the PG usually becomes large and variable and generally increases positively during fog, e.g. barograph, thermograph, anemograph, and hyetograph.
Richard Alexander “Hammy” Hamilton FRSE (1912–1991; McIntosh, 1991). A Lerwick superintendent 1960–1966 and inspirational experimental scientist (Walker, 2011b), who was strongly influenced by Gordon M. B. Dobson when a student of physics at Oxford (Ratcliffe, 1992).
In detail, the collector's copper spiral collector was soldered into the small end of a tapered copper alloy (German silver) tube, 76 cm long, of triangular cross section. This was attached to an aluminium (Duralumin) tube, with 89 cm length and 1.3 cm diameter. The tube entered through a hole, 3.8 cm in diameter, into a wooden box (dimensions 38 × 25 × 10 cm) held horizontally between the ends of two metal rods supported by sulfur insulators.
Similar effects were observed at Świder, Poland, following the Chernobyl accident (Warzecha, 1987) and at Kakioka, Japan, following the Fukushima accident (Takeda et al., 2011).
The air–Earth current in fair weather is also known as the vertical conduction current density, i.e. the vertical current flowing per unit area, and is typically ∼ 2 pA m−2.
Oliver H. Gish (1883–1987), geophysicist working on atmospheric electricity and staff member of the Department of Terrestrial Magnetism at the Carnegie Institution of Washington. His work especially concerned the vertical column resistance of air, which was initially determined by the first stratospheric balloon flight, Explorer II (Gish, 1944; Gish and Sherman, 1936).
Importantly, modern all-weather field mills (e.g. Bennett and Harrison, 2007) and stretched wire measurements (e.g. Harrison, 1997) no longer have any need to use radioactivity.
- Abstract
- Introduction
- Development of Lerwick Observatory
- Atmospheric electricity instruments
- Tabulations of data in the Observatories' Year Book
- Scientific findings from the Lerwick atmospheric electricity data
- Conclusions
- Data availability
- Author contributions
- Competing interests
- Disclaimer
- Special issue statement
- Acknowledgements
- Review statement
- References