the Creative Commons Attribution 4.0 License.
the Creative Commons Attribution 4.0 License.
 | 08 Apr 2020
Measurements of atmospheric electricity in the Széchenyi István Geophysical Observatory, Hungary
Gabriella Sátori
Veronika Barta
Karolina Szabóné-André
Judit Szendrői
Viktor Wesztergom
Tamás Bozóki
Attila Buzás
Dávid Koronczay
The Széchenyi István Geophysical Observatory, also known as the Nagycenk Geophysical Observatory (NCK), was established in 1957. It has been the only measurement site in Hungary where observations of various parameters of the atmospheric global electric circuit are made in the framework of organized research under the umbrella of the Hungarian Academy of Sciences (MTA). Measurements of the atmospheric electrical potential gradient (PG) and Schumann resonances (SRs) running quasi-continuously in the observatory for decades provide an invaluable source of information for geophysical research. This paper gives an overview on the history of the observatory and particularly on various atmospheric electricity (AE) measurements on-site to commemorate the efforts and excellence of the people who served atmospheric sciences by dedicating their lives to obtaining high-quality, reliable data and scientific achievements at the highest possible level.
- Article
(20734 KB) - Full-text XML
- BibTeX
- EndNote


The establishment of a geophysical observatory near Sopron, Hungary, had been put forward by Prof Károly Kántás, head of the Geophysical Research Laboratory of the Hungarian Academy of Sciences (MTA). The laboratory was embedded in the University of Sopron at that time. The initiative for establishing an observatory was part of the activities in Hungary in the 1950s in connection with preparations for celebrating the International Geophysical Year (IGY; July 1957–December 1958) (Bencze, 2001; Hejda, 2007; Nicolet, 1984). Prof Kántás's proposal also probably had personal motivations. The university in Sopron, including Hungary's centre of mining education, was to be moved in large part to the eastern half of the country for political reasons. Prof Kántás did not want to move, so he made efforts to create a research facility which could justify his staying in Sopron.
At that time, the laboratory intended to explore and exploit the usage of the telluric method in geophysical prospecting for raw materials. The observatory was planned to serve as a stationary reference measurement site, while surveys were to be made by a mobile recording instrument. The founders aimed at observing all six components of the geo-electromagnetic field (three electric and three magnetic components) in the observatory. This called for a location that was as free of artificial electric and magnetic noises and vagabond currents disturbing, biasing, and masking the natural fields as possible. Finding a suitable place was challenging especially for measuring the vertical component of the geoelectric field, which, at that time, was assumed to be the same as the vertical component of the atmospheric electric field. Test measurements confirmed that the best available location near Sopron was the place where the observatory is standing today (Bencze, 2001).
The site (47∘38′ N, 16∘43′ E; 153.7 m m.s.l.; L=1.9; NCK) is on a shallow northern slope near Lake Fertő on a sedimentary formation embedded in woodland inside the area of a nature reserve (Bencze, 2001; Ádám et al., 1981) (Fig. 1). The nearest settlement is the village Fertőboz, lying 1.6 km away from the observatory. The observatory, however, was named after another neighbouring settlement, Nagycenk, which was the centre of the local estate of the noble family Széchenyi. Note that in 1825, Count István Széchenyi, a member of this family, was the proposer and supporter of the establishment of a “learned society” in Hungary that has eventually become the Hungarian Academy of Sciences. This is why the observatory has become known as the Nagycenk Geophysical Observatory and has received later the Intermagnet code NCK which is the most often used and widely known abbreviation of the facility to date. And this is the reason why the observatory was officially named Széchenyi István Geophysical Observatory on the 50th anniversary of its establishment in 2007.
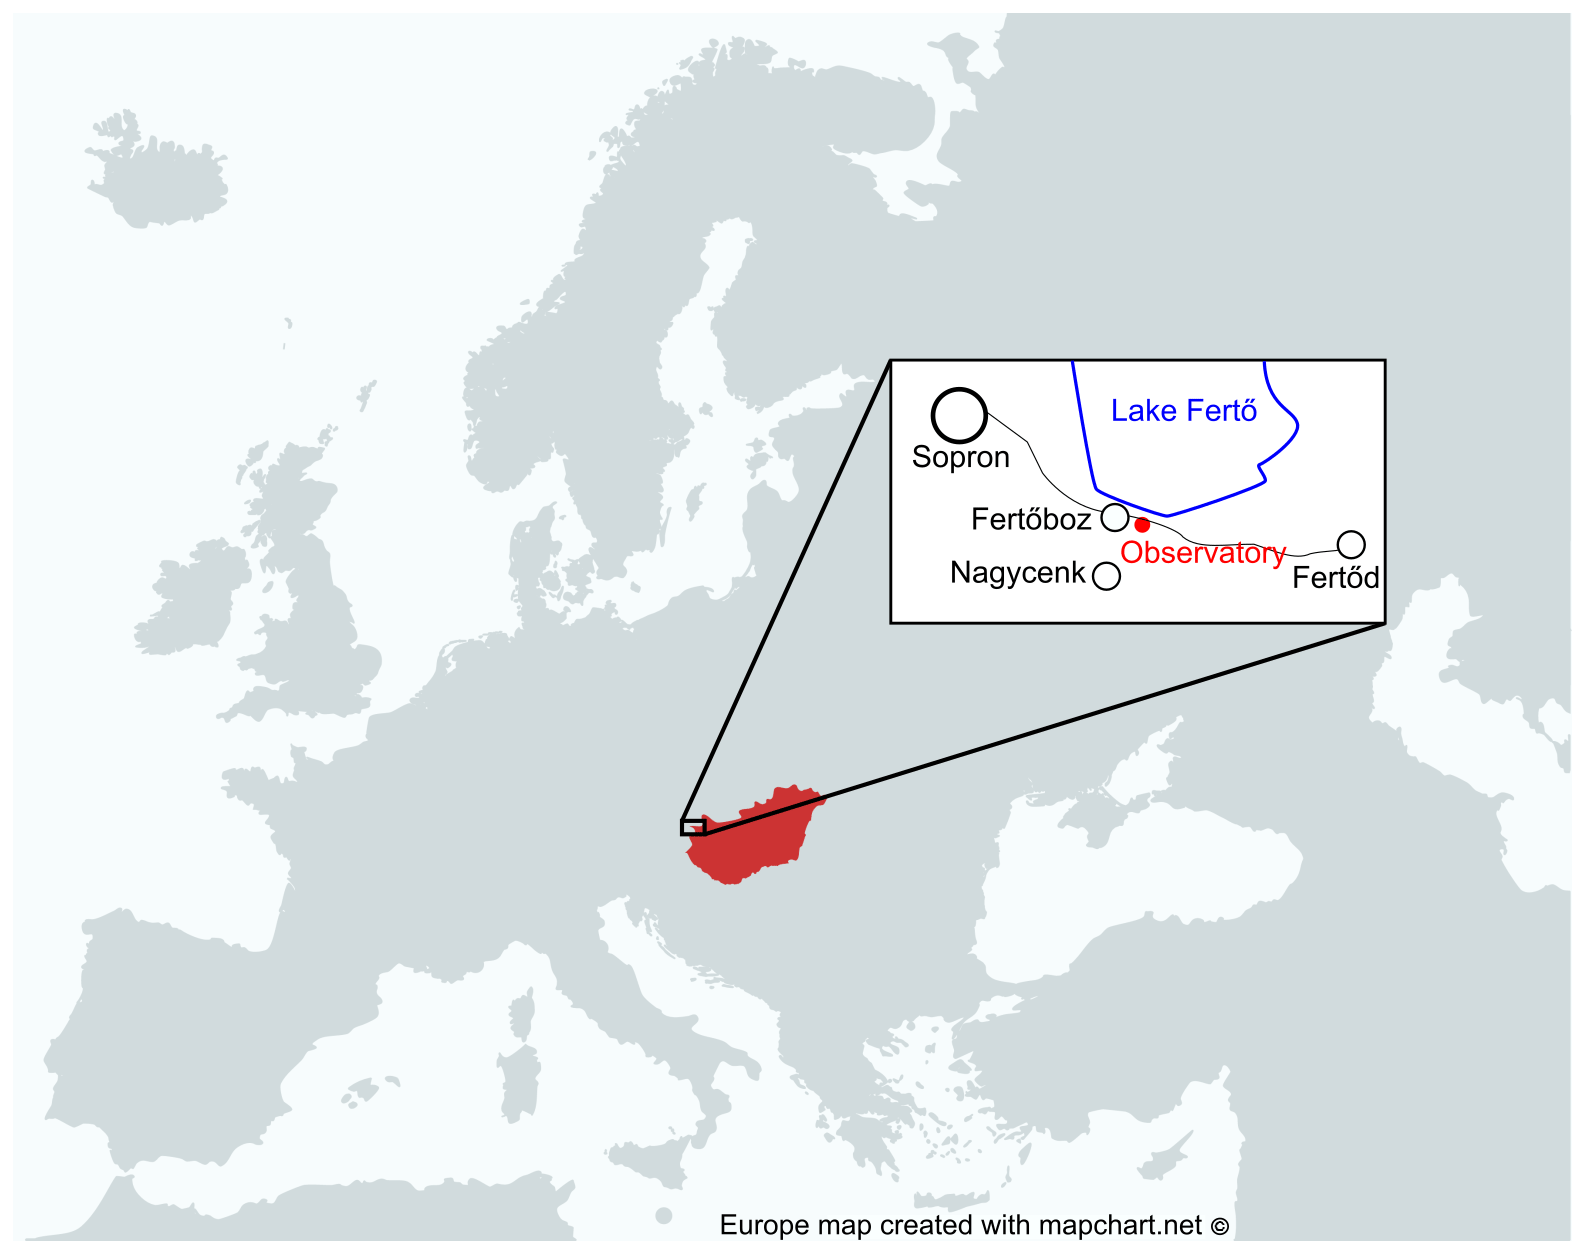
Figure 1Location of the NCK observatory.
The construction of the observatory was hindered by political instabilities culminating in the revolution against the political state power in Hungary in 1956. Prof Kántás emigrated after the defeat of the revolution, and the budget of the project was cut back. Pál Bencze undertook managing the construction from that point on, and completion of the observatory is predominantly his merit (Märcz, 1999). In addition to houses hosting an office and recording instruments for telluric and geomagnetic field measurements (both relative and absolute values), a separate building was built to specifically serve atmospheric electricity (AE) measurements (“atmospheric-electricity house”) (Fig. 2). This house, completed in 1957, has rooms for tools and recording devices of open-air measurements, and it also contains a room which has been carefully shielded for future air conductivity measurements (Bencze, 2001). Thanks to the dedication of Pál Bencze, the construction was completed, and the first (telluric) measurements were started on 1 July right at the beginning of the IGY, more than 4 months before the official opening of the observatory on 14 November 1957.
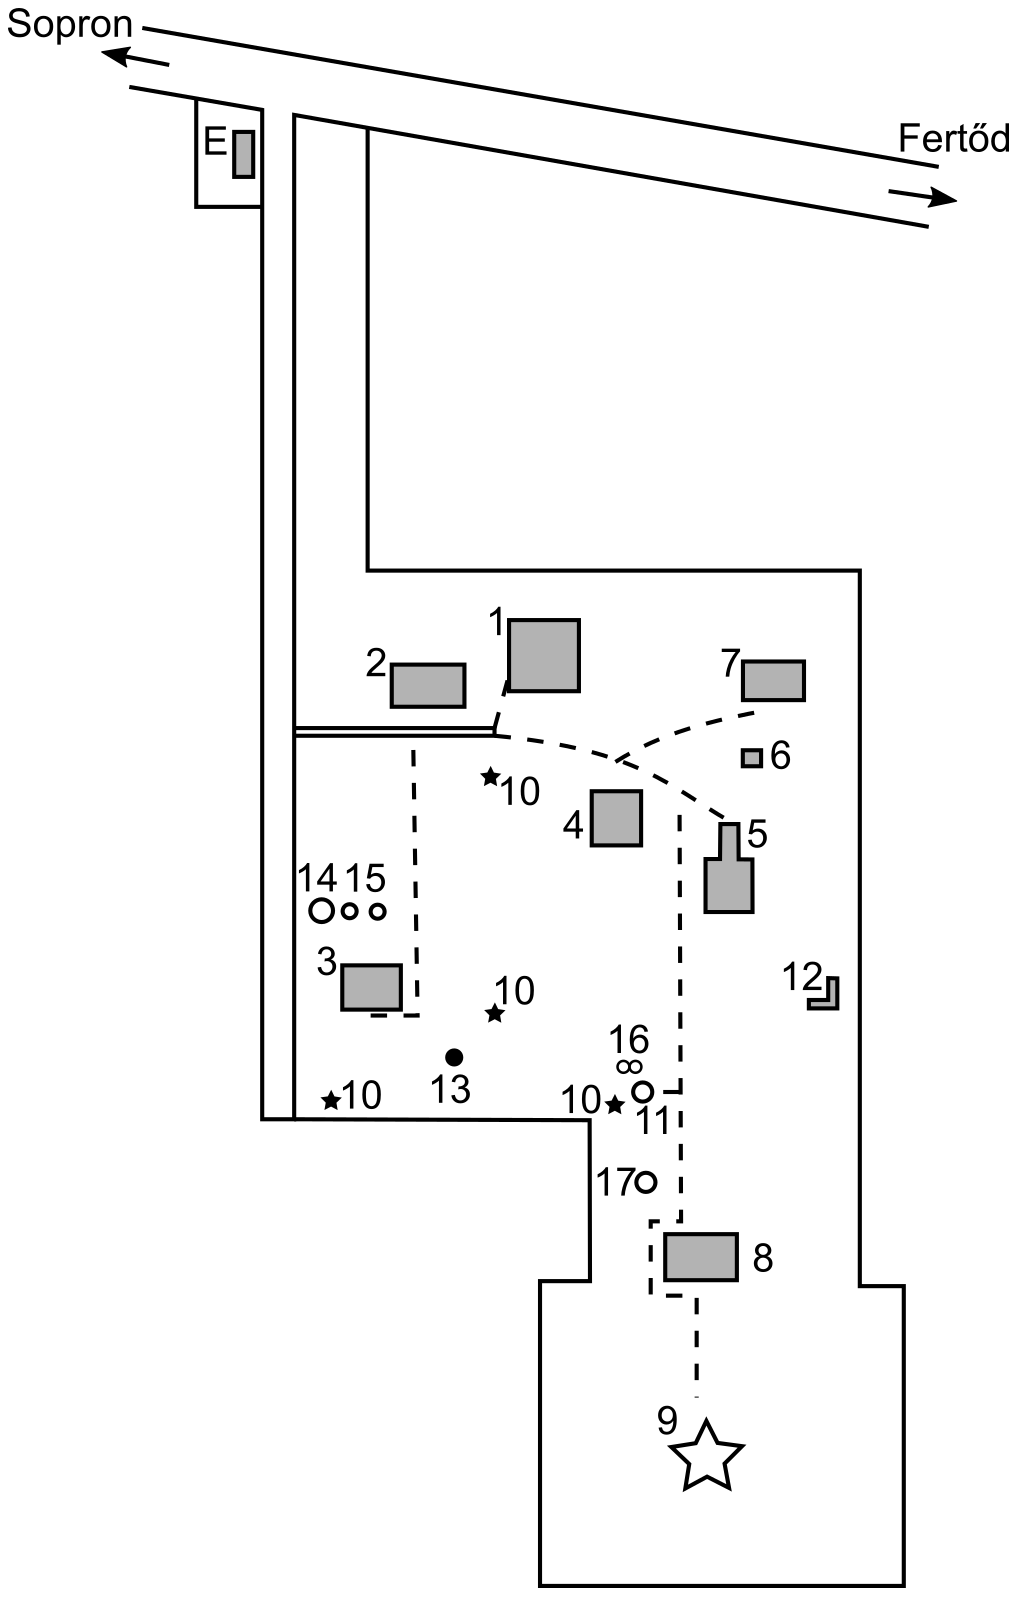
Figure 2Observatory site diagram. E – entrance; 1 – main building with staff hostel and electronic laboratory; 2 – telluric instruments and office; 3 – atmospheric-electricity house (laboratory of Schumann resonance, potential gradient, point discharge, and radio wave absorption measurements); 4 – magnetic absolute house with four pillars; 5 – underground magnetic variometer chambers; 6 – proton magnetometer hut; 7 – computer centre (data loggers, local-network server, and satellite transmitter); 8 – ionosonde station, electric, and mechanical workshop; 9 – ionosonde D antenna; 10 – ionosonde receivers; 11 – meteorological station; 12 – ELF induction coil chamber; 13 – ball antenna (Schumann resonance antenna); 14 – potential gradient sensor (stationary field mill); 15 – potential gradient sensors (radioactive); 16 – SAR reflector; 17 – VLF antenna. The figure is adopted and modified from Wesztergom (2001).
Over the years, the observatory has been managed by the Geophysical Research Laboratory and later by its successor, the Geodetic and Geophysical Research Institute (GGRI), which was formed via fusion with two other academic research communities, i.e. the Geodetic Research Laboratory and the Seismological Research Team in 1972. As a result of a structural reform of the Hungarian academic research network, GGRI became an integral part of the Research Centre of Astronomy and Earth Sciences (CSFK) as its Geodetic and Geophysical Institute in 2012. Since then, the observatory has been operated as one of the several research facilities of CSFK. Note that the Eötvös Loránd Research Network (ELKH) was created recently from research institutions of the Hungarian Academy of Sciences in September 2019, and ongoing research activities are conducted now in the framework of this organization.
Pre-processed and quality-controlled data have been regularly disseminated in the series of Geophysical Observatory Reports (available in GOR, 2019) published by the mother institution of the observatory. Recently, data have been saved in local data storage facilities and can be obtained from researchers of CSFK, e.g. by contacting the authors.
This paper focuses on those measurements which have been conducted at the Széchenyi István Geophysical Observatory near Nagycenk, Hungary, and are more closely related to research on the global electric circuit (GEC) (Rycroft et al., 2012). Atmospheric-electricity-related scientific research in CSFK in Sopron, which is based in large part (but not exclusively) on the measurements running in NCK, has been reviewed in detail by Sátori et al. (2013). While the most significant results obtained from these measurements are also summarized here, this retrospection is rather a tribute to the pioneering work of those who created the NCK observatory, which hosts the widest range of AE measurements in Hungary to date.
2.1 Measurements of point discharge currents
This was the first AE measurement in the observatory (started in 1961) due to its relative simplicity. A tip made of stainless steel was fixed at 8 m height on the roof of the atmospheric-electricity house (Fig. 3). When the ambient electric field is strong enough, it ionizes the air around the sharp tip, where it is focused, and a current starts to flow to the ground. The polarity and intensity of this current were measured by a galvanometer and have been recorded photographically on photo paper. The measuring and recording system was adapted from instruments originally used in Earth current observations (Bencze, 2001).
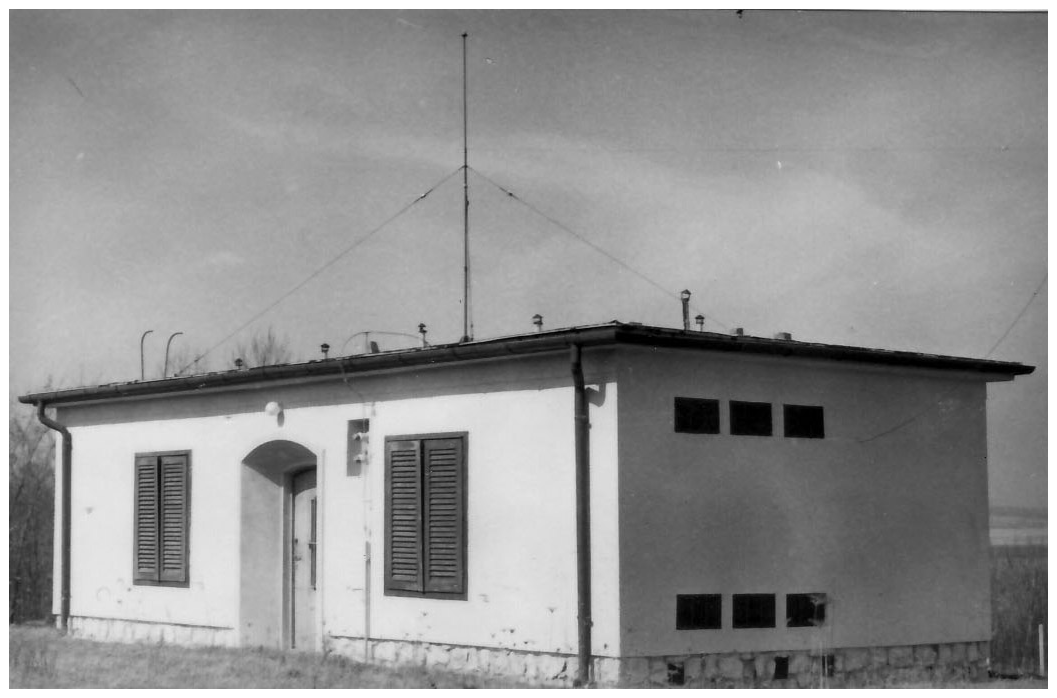
Figure 3The sensor for point discharge current measurements on the roof of the atmospheric-electricity building. (Re-printed from Wesztergom, 2007.)
This simple setup allowed for studying strong electric fields due to strongly electrified clouds and thunderstorms. The variation of the polarity of the recorded current allowed for the determination of the rough distribution of charges in the clouds. For example, the normal or reversed polarity of the passing thunderstorms could be determined (Bencze, 1966, 2007). The sensitivity of the system was high enough to study the statistics of the diurnal and seasonal variation of point discharge currents. A general surplus of negative transported charge was found both on the diurnal and seasonal scales. According to the results (Bencze, 1966; Märcz and Bencze, 1998), the minimum and maximum in the detected current intensity occurred on average in the morning and in the afternoon and in winter and in summer on the diurnal and seasonal time scale, respectively.
Point discharge current measurements at NCK were stopped in 2003. Pre-processed data were disseminated in the series of Geophysical Observatory Reports published by the director of the mother institution of the observatory.
2.2 Atmospheric electric potential gradient measurements
The atmospheric electric potential gradient (PG) is the negative of the vertical electric field, and it is a parameter of the DC (direct-current) part of the GEC measured at many sites around the globe (Rycroft et al., 2012). Measured over oceans and during undisturbed periods, changes in the PG are known to represent the variation of the global thunderstorm activity (Harrison, 2013). In the case of continental recording sites, however, changes related to the global thunderstorm activity are often altered and masked by local and regional effects, as the PG is a resultant of field components of local, regional, and global origin (Nicoll et al., 2019).
PG measurements at NCK were started in 1961 by Pál Bencze and Ferenc Märcz with a locally developed instrument (Bencze and Märcz, 1981; Bencze, 2001) that contains radioactive preparation (Nicoll, 2012) (Fig. 4). The case that contains the radioactive preparation is mounted on a vertical rod at a height of 1 m above ground. Ionizing radiation exerts its effect only downwards through an opening on the bottom of the case made of radiation-absorbent material. Due to the ionizing radiation, the air below the preparation becomes conductive so that the potential from the height of the radioactive sample down towards the ground gets equalized. The upper measuring electrode, placed in a shallow pit at ground level, acquires this potential, which is then measured by comparing it to the grounded lower electrode. The instrument originally measured the potential difference by means of a valve electrometer.
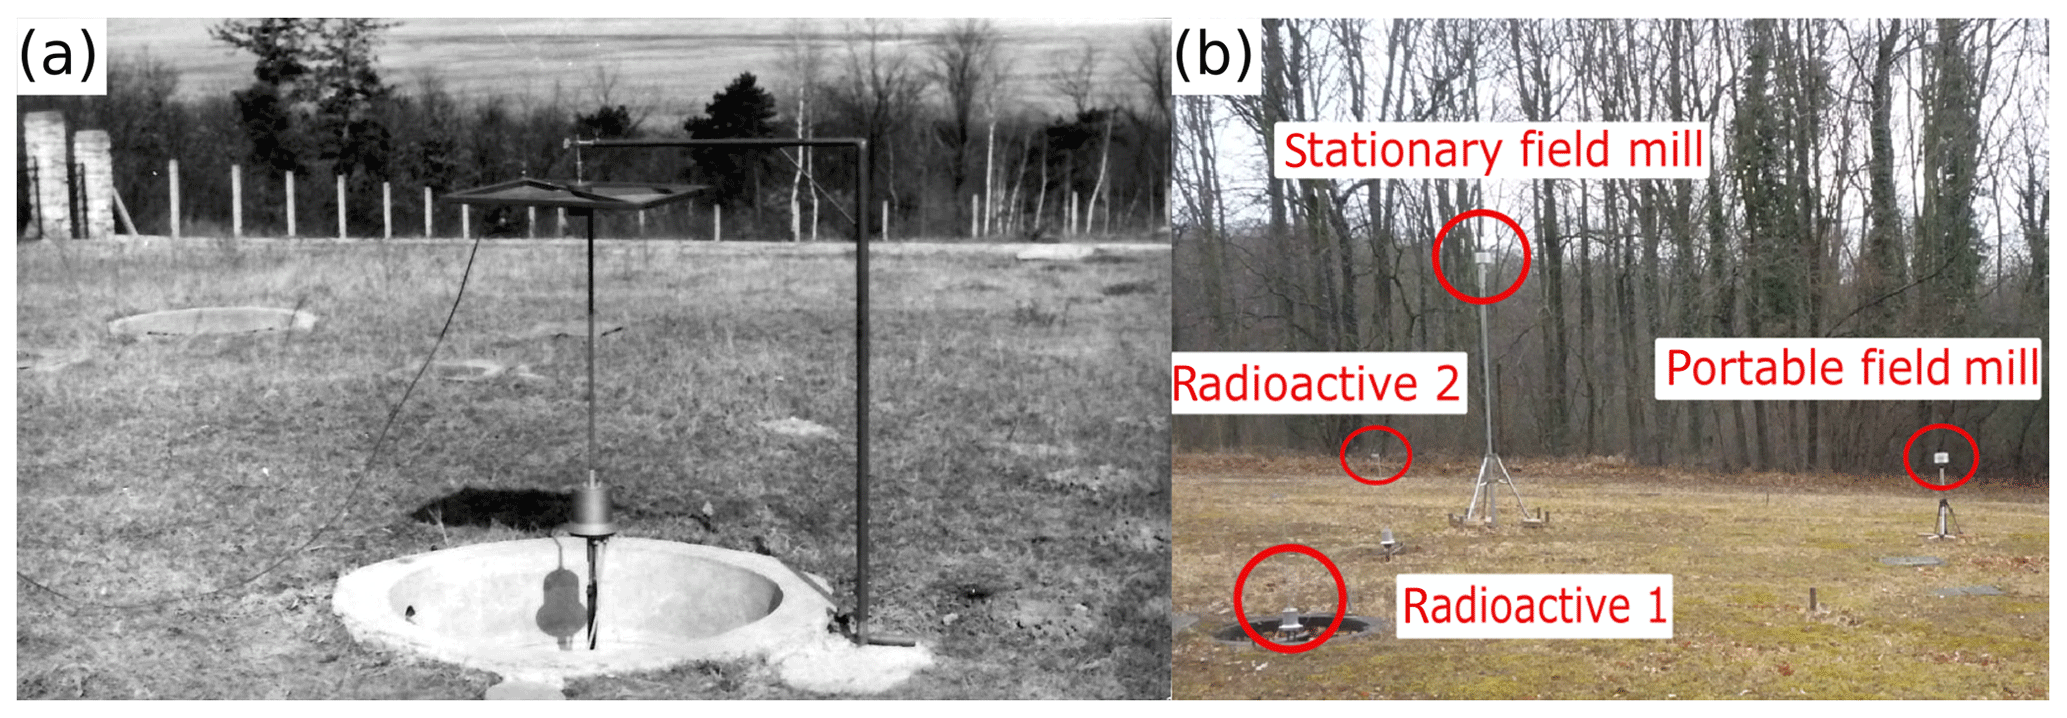
Figure 4(a) The oldest radioactive collector, installed in 1961, during calibration in the early days. (Re-printed from Wesztergom, 2007.) (b) Currently operating PG instruments at NCK. Radioactive 1 represents the older, radioactive collector (shown in a), whereas radioactive 2 is the more novel radioactive equipment installed in 1998.
The instrument has a measuring range of −300 to 300 V m−1, and the resolution of the PG values, used to be obtained via manual evaluation, is 0.3 V m−1. The instrument has been regularly calibrated in order to maintain the high quality and continuity of the recordings. Full calibration is done once per week whenever it is possible. A grounded shielding net is placed right above the radioactive collector at 1 m height to determine the baseline of the measurement. Then, different DC voltages within the measuring range of the instrument are given to the net to determine the sensitivity. Determination of the baseline is done more often, i.e. normally every day. The square shielding plate used for calibration in the beginning (Fig. 4) was very soon replaced by a copper net of circular shape with 1 m diameter.
Initially, any changes of the grid current owing to the variations of the atmospheric electric field were recorded photographically by a sensitive galvanometer which was adjusted so that a deflection of 10 mm on the record corresponds to 100 V (Fig. 5). Later on, digital data acquisition was introduced instead of the analogue one. Note that this instrument with the radioactive collector can detect slowly varying electric fields as it has a time constant of about 30 s. Hourly and daily means of recorded data have been stored and regularly published in tabulated form in the Geophysical Observatory Reports (GOR, 2019). With an operational period of more than 5 decades, the PG dataset of NCK is unique and has a great scientific and historic value (Bencze and Märcz, 1981; Sátori et al., 2013).
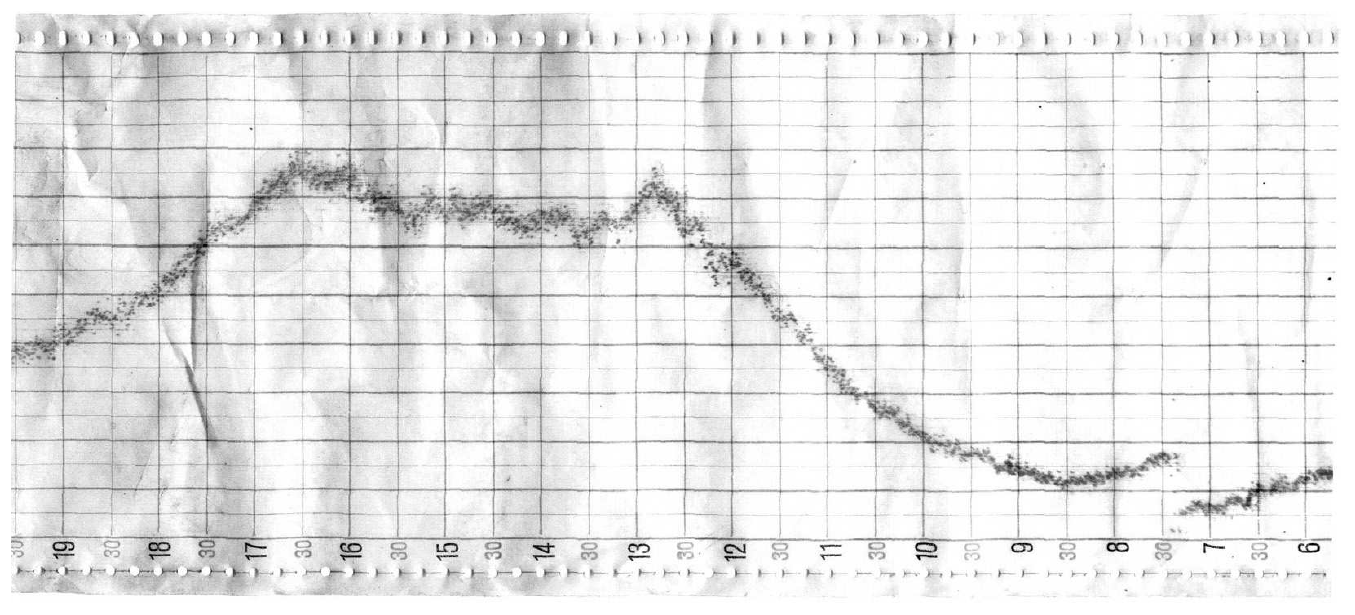
Figure 5The first record of PG at NCK (Fig. 9 in Bencze, 2001).
In 1998, another locally developed radioactive collector was installed (Fig. 2) both as a backup instrument to the old system and for investigating the effect of trees that grew to significant heights not far from the point of measurements. The modus operandi of the new apparatus is similar to that of the older one. However, the new instrument had more state-of-the-art electronics, and digital data acquisition methods were used. The separation between the two instruments is 5 m (Fig. 4) (Märcz et al., 2001).
A Boltek EFM-100 Atmospheric Electric Field Monitor (field mill; Boltek, 2019) was installed at NCK in 2013, and it has been operating since then. The instrument is mounted on a 3 m high metal pole surrounded by trees at a distance of 15–30 m. The resolution of measured PG values is 10 V m−1. The sensor is factory calibrated. PG data measured by this Boltek device have also been available in the data repository of the Natural Environment Research Council for atmospheric science and Earth observation (i.e. at the website of the Centre for Environment Data Analysis; CEDA, 2019) since 2016, in the framework of the Global Coordination of Atmospheric Electricity Measurements (GloCAEM) project. A second Boltek EFM-100 device was procured in 2015. The second field mill is used as a portable device in field campaigns, e.g. to perform parallel campaign measurements at NCK and at Mitzpe Ramon, Israel (in 2016), Świder, Poland (in 2017), and Reading, UK (in 2018). This portable device provides the opportunity to intercalibrate different fixed instruments measuring the PG at the separated observatories. Presently, the PG is measured continuously by means of three instruments in the NCK observatory, i.e. by the two locally developed radioactive collectors and one Boltek EFM-100 field mill (Fig. 4).
Since 1961, several internationally recognized research projects have been carried out based on the PG data of NCK. A non-exhaustive list of these is given below.
Märcz (1976) investigated the link between ionospheric absorption and atmospheric electricity after severe space weather events. According to his research, significant enhancements of the PG have been detected after events of ionospheric absorption.
In 1981, Märcz and Bencze published the diurnal variation of PG at NCK (Märcz and Bencze, 1981). The observed variation was found to be similar to the Carnegie curve, which represents the diurnal variation of the global thunderstorm activity. However, further investigations based on a longer PG dataset showed that in wintertime the diurnal variation of PG at NCK is more similar to the Carnegie curve than in the summer (Fig. 6). This can be attributed mainly to the fact that local and regional thunderstorm activities are less intensive in winter than in summer (Märcz and Harrison, 2003).
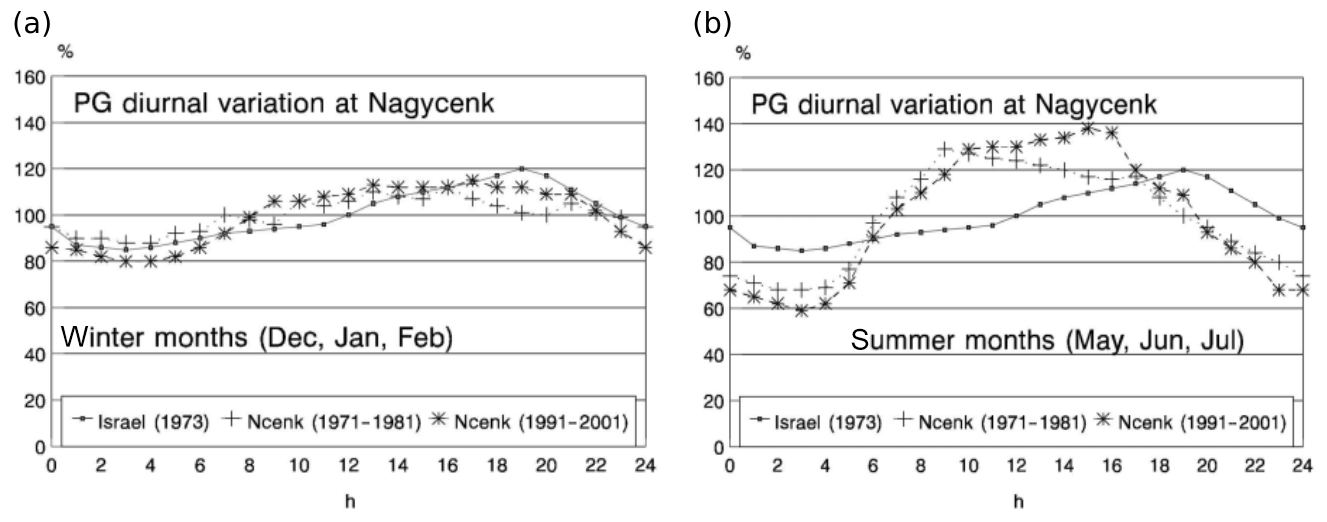
Figure 6Diurnal variation of the PG for different PG datasets (PG over the oceans on undisturbed days as in Israel, 1973, and at NCK – abbreviated as Ncenk– in 1971–1981 and 1991–2001): (a) wintertime and (b) summertime PG values.
According to early studies, there is no significant variation of the PG at NCK that would be attributable to the 11-year solar cycle (Märcz and Bencze, 1981). Nevertheless, after additional investigations, a significant positive correlation was found between the PG at NCK and the 10.7 cm solar radio flux during the west phase of the quasi-biennial oscillation (QBO), and also a less significant negative correlation was noticed during the east phase of the QBO (Märcz, 1990).
Märcz (1997) also investigated the relation between the PG at NCK and cosmic rays. He found that the PG was ∼7 % lower on the day after a strong Forbush decrease event.
Simultaneous records of PG and Schumann resonances (SRs) have been compared by Märcz et al. (1997). The authors found that an annual variation is present in both the SR and the PG data but with an opposite phase. Their diurnal variation is similar and the daily maximum and minimum in the case of the SR and PG data, respectively, are nearly in phase.
In 2003, a significant long-term (1961–2007) decrease in the NCK PG data was reported (Märcz and Harrison, 2003). The authors of this study associated this reduction (Fig. 7) with a global decrease in galactic cosmic-ray flux, although they acknowledged that the shielding effect of nearby trees at NCK may be responsible for a part of this trend (Märcz and Harrison, 2003). Recently, this question has been revisited and preliminary results, based on numerical modelling and on-site PG measurements, confirm that the reduction in PG can be attributed to the shielding effect of the local trees. Using correction factors derived from the numerical model, the shielding effect can be eliminated from the long-term PG datasets (Buzás et al., 2018).

Meteorological measurements and observations
For all kinds of AE measurements, it is of key importance to know the local meteorological conditions which have a significant effect on the recorded values. This is especially true for PG measurements where values recorded only in fair-weather conditions can be used to characterize global, large-scale properties of the GEC (Harrison and Nicoll, 2018). Therefore, observations of weather conditions have been made in the observatory from the beginning. The conditions were noted by the staff of the observatory subjectively and were attached to records of different measurements. These notes appeared also next to the published data (GOR, 2019).
A meteorological station was installed in 1996 at the observatory (Fig. 8, Fig. 2). It is based on a Campbell CR10X data logger and measures temperature and relative humidity (Vaisala Temperature and RH Probe, HMP35D), wind speed and direction (Young Wind Monitor, 05103-LC), rainfall (Campbell Tipping Bucket Raingauge, ARG100), and solar irradiance (Skye Instruments Pyranometer, SP1110). The station provided these data in a 10 min time resolution, and the records were collected manually in every month.
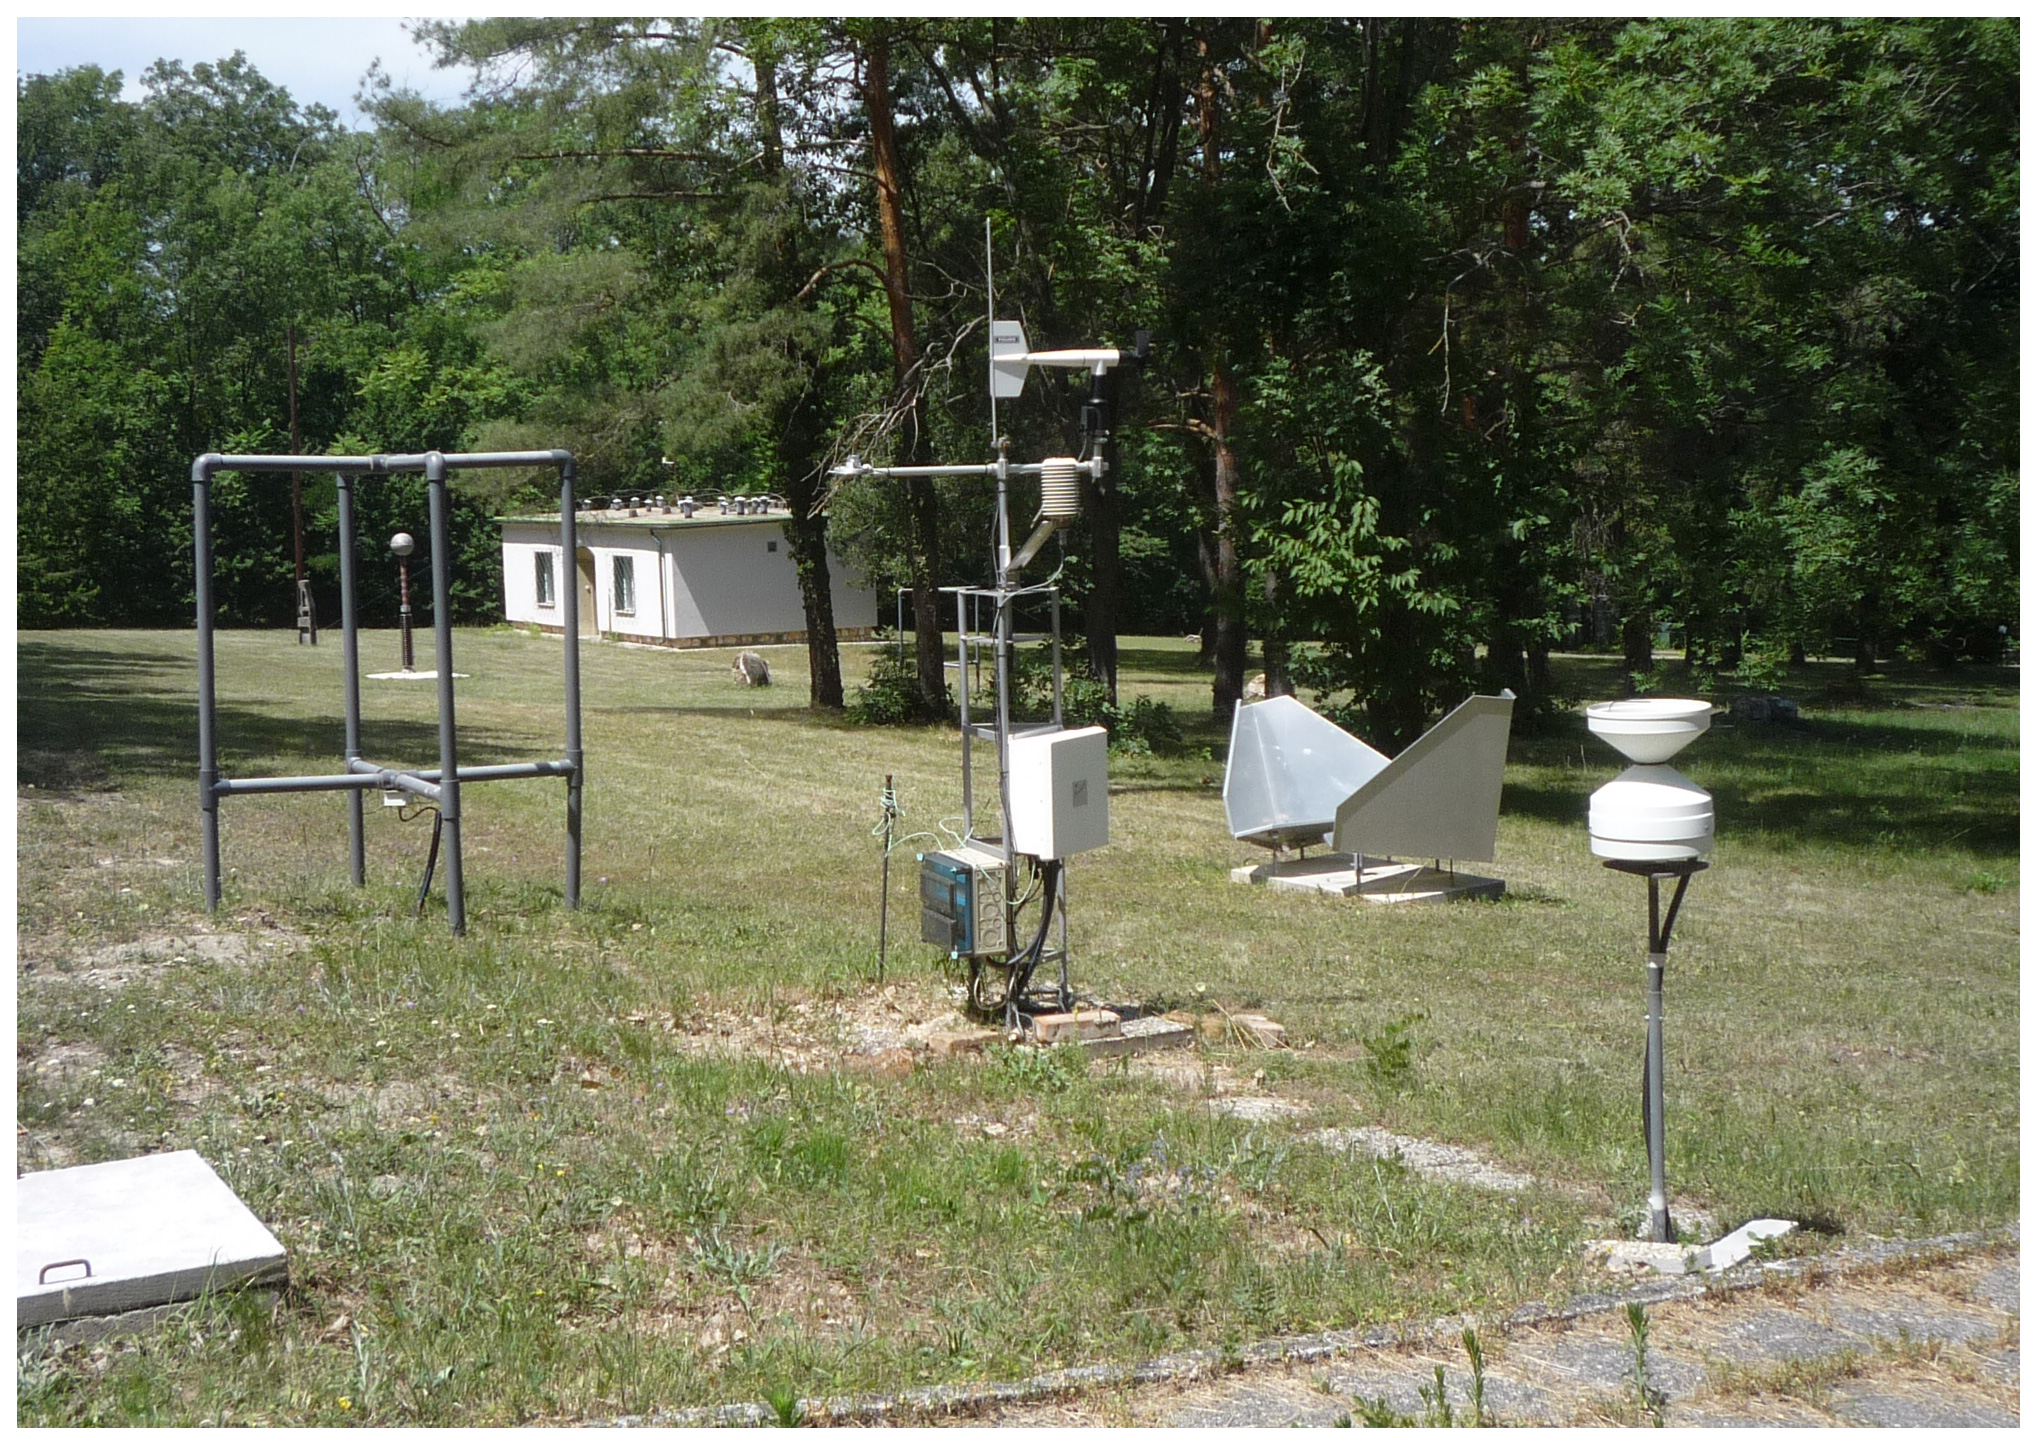
Figure 8The meteorological station with the tipping bucket (in the foreground) at NCK. The photo also shows one of the four receivers of the Lowell ionosonde (to the left) with the Schumann resonance electric ball antenna and the atmospheric-electricity house in the background and the SAR reflector (to the right).
The station requires regular supervision, cleaning, and maintenance; otherwise the logged data do not mirror real conditions. The rain gauge may be clogged because of dust, small particles from trees, etc. It may happen that the water that accumulates due to plugging freezes into the container in winter. Snow can accumulate on the instrument because it has no heating to melt the snow. It leads to the delayed measuring of precipitation. Outages in the measurement also happen due to events of power failure. Unfortunately, station data were lost in the interval 3 August 2012 to 23 August 2017, but observations by the staff were continuously recorded also during this period.
In 2017, the sensors of the station were re-calibrated, and since 2 November 2017, data sampling interval has been set to 5 min. This, however, resulted in the internal memory of the data logger filling up in 13 d. To ease data retrieval, remote access to the station and automatic data collection was implemented in April 2018.
2.3 SR measurements
2.3.1 The SR measuring system
Schumann resonances correspond to the AC (alternating-current) part of the GEC and can be interpreted as the electromagnetic resonance of the Earth–ionosphere cavity (Schumann, 1952). SRs are maintained by global lightning activity and can be observed at characteristic resonance frequencies at around 8, 14, 20, etc. Hz. The phenomenon was first observed by Balser and Wagner (1960) and is nowadays routinely measured at many observation sites around the globe. It is common to distinguish two fundamental parts of SRs. Most of the “common” lightning strokes (about 50–100 per second on average) produce a quasi-steady “background” field in which the overlapping pulses cannot be distinguished. On the other hand, SR transients (or Q bursts) generated by exceptionally large lightning strokes (Ogawa et al., 1966) can be identified on an individual basis from records in the time domain, as they can largely exceed the average background signal strength.
Antal Ádám and Pál Bencze made their first efforts to detect the signatures of SRs already in the 1960s at NCK using an L antenna, an amplifier built by Pál Bencze, and a studio tape recorder (Ádám and Bencze, 1963). At the end of the 1980s, Gabriella Sátori suggested that SRs could be observed continuously owing to the explosive development of computational capacities. Test measurements of the first SR mode of the vertical electric field begun in 1991. The old L antenna and amplifier was used with a new digital data collector developed at the technical university in Budapest. Gabriella Sátori reported on the first results in Hungary already in 1992 (Sátori, 1992) and also in 1993 at the International Association of Geomagnetism and Aeronomy (IAGA) conference in Buenos Aires (Sátori, 1993). Yet in 1993, a completely new recording system for SR measurements was installed with a mechanically more stable ball-antenna. This enabled the regular registration of SR spectral parameters from May in that year (Fig. 9a). The metal ball on the top of the antenna is an aluminium casting, weighs around 20 kg, and has a diameter of about 45 cm. It is placed on a 2.4 m high mount prepared from ceramics and a special insulating plastic material. Two large copper plates buried under the antenna assure the grounding of the system. The total weight of the antenna is quite large, around 200 kg, in order to attenuate its mechanical vibrations. The antenna was placed in an open flat area (Fig. 2) with well-kept grass, as far from the surrounding trees as was possible.

Figure 9(a) Electric ball antenna and (b) its calibration on 20 December, 2013 in the Széchenyi István Geophysical Observatory.
The preamplifier with an amplification coefficient of 700 can be found just at the bottom of the antenna inside a waterproof box. Here the power line frequency of 50 Hz and its third harmonic (150 Hz) are attenuated by 50 and 30 dB, respectively. The main amplifier is in the recording building with changeable settings, which makes it possible to increase the amplification further by 2 orders of magnitude. It assures an additional attenuation of 30 dB at 50 Hz which means altogether 80 dB suppression of the power line frequency. An analogue-to-digital converter transforms the signal into digital records with values between ±2.5 V. The effective bandwidth of the antenna is 5 to 30 Hz.
Complex demodulation (spectral method in the time domain) has been applied as an on-site data processing method to extract the modal frequency and the amplitude of the first three resonance modes on a quasi-continuous basis (Sátori et al., 1996). This spectral processing technique computes the spectral parameters with high time resolution using time windows of ∼40 s. From the high-time-resolution data, the computer code determines hourly averages and corresponding standard deviations which are more often used for scientific purposes. Retrieved parameters are rejected in the case of locally disturbed conditions. Such parameters are not included in the hourly average values. As the regular measurement has been running since 1993, to the best of the authors' knowledge this is the longest SR record anywhere in the world at the moment. In the first 10 years of operation, only the spectral parameters had been stored, and the time series were not kept due to the lack of enough storage capacity.
The electric antenna is calibrated using a wire gauze of 1 m2 area mounted 1 m over its top (Fig. 9b). Calibration signals include monochromatic excitations with a given frequency to determine the sensitivity of the instrument. The electric field of the calibrating net is not homogeneous due to its finite size, and therefore the field appearing at the position of the ball antenna is calculated theoretically and numerically. In addition, short duration peaks are also sent to the net to determine the amplitude and phase characteristics of the recording system from the recorded impulse responses in the full frequency range.
In November 1996, the system was upgraded with induction coil magnetometers to also record the two horizontal magnetic components of the atmospheric electric field in the geographic north–south and east–west directions. The coils are located in a non-magnetic building of the observatory and are buried about 1 m below the ground. In order to minimize the effect of microseismic activity on the measurements, they were placed in concrete channels partially filled with sand. The applied spectral technique for signal processing is the same as for the vertical electric field component. The effective bandwidth of the whole system is roughly in the 5–30 Hz frequency range (Fig. 10). Helmholtz coils in the “absolute house” of the observatory enable the calibration of the induction coils.
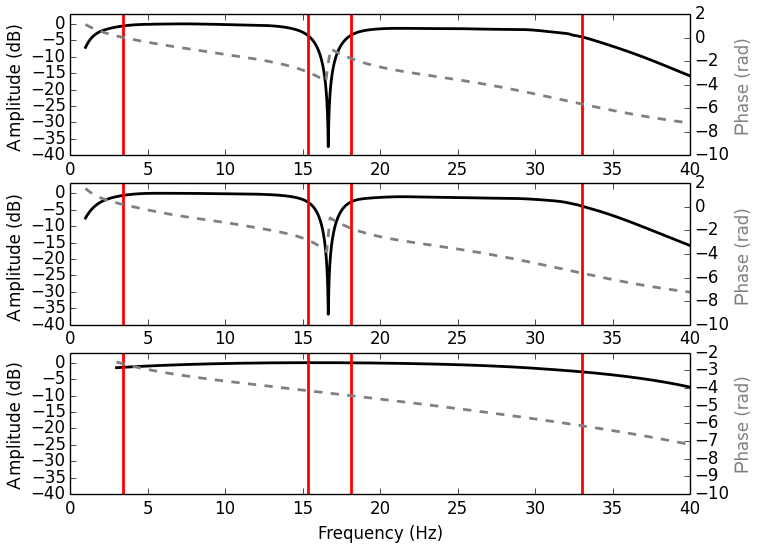
Figure 10Amplitude and phase response functions of the SR recording system in the observatory. Vertical lines mark the frequency bands within which the original signal amplitudes can be reconstructed. Notch filters at 16.66 () Hz are applied in the magnetic data channels to suppress the characteristic narrowband noise from Austrian railway lines which has very high amplitudes.
Judit Szendrői, software developer; János Pongrácz and János Horváth, electrical engineers; and Gyula Pálla, electrotechnician, played a key role in the development of the SR recording system in the Széchenyi István Geophysical Observatory. The software for the quasi-real-time data processing was improved by Judit Szendrői, and the electronics of the SR recording system was developed by János Pongrácz and János Horváth. The ball antenna was constructed by Gyula Pálla. Gabriella Sátori organized an international workshop on Schumann resonances in Sopron in 1998, where many experts in the field took part and visited the SR observation site (Fig. 11).
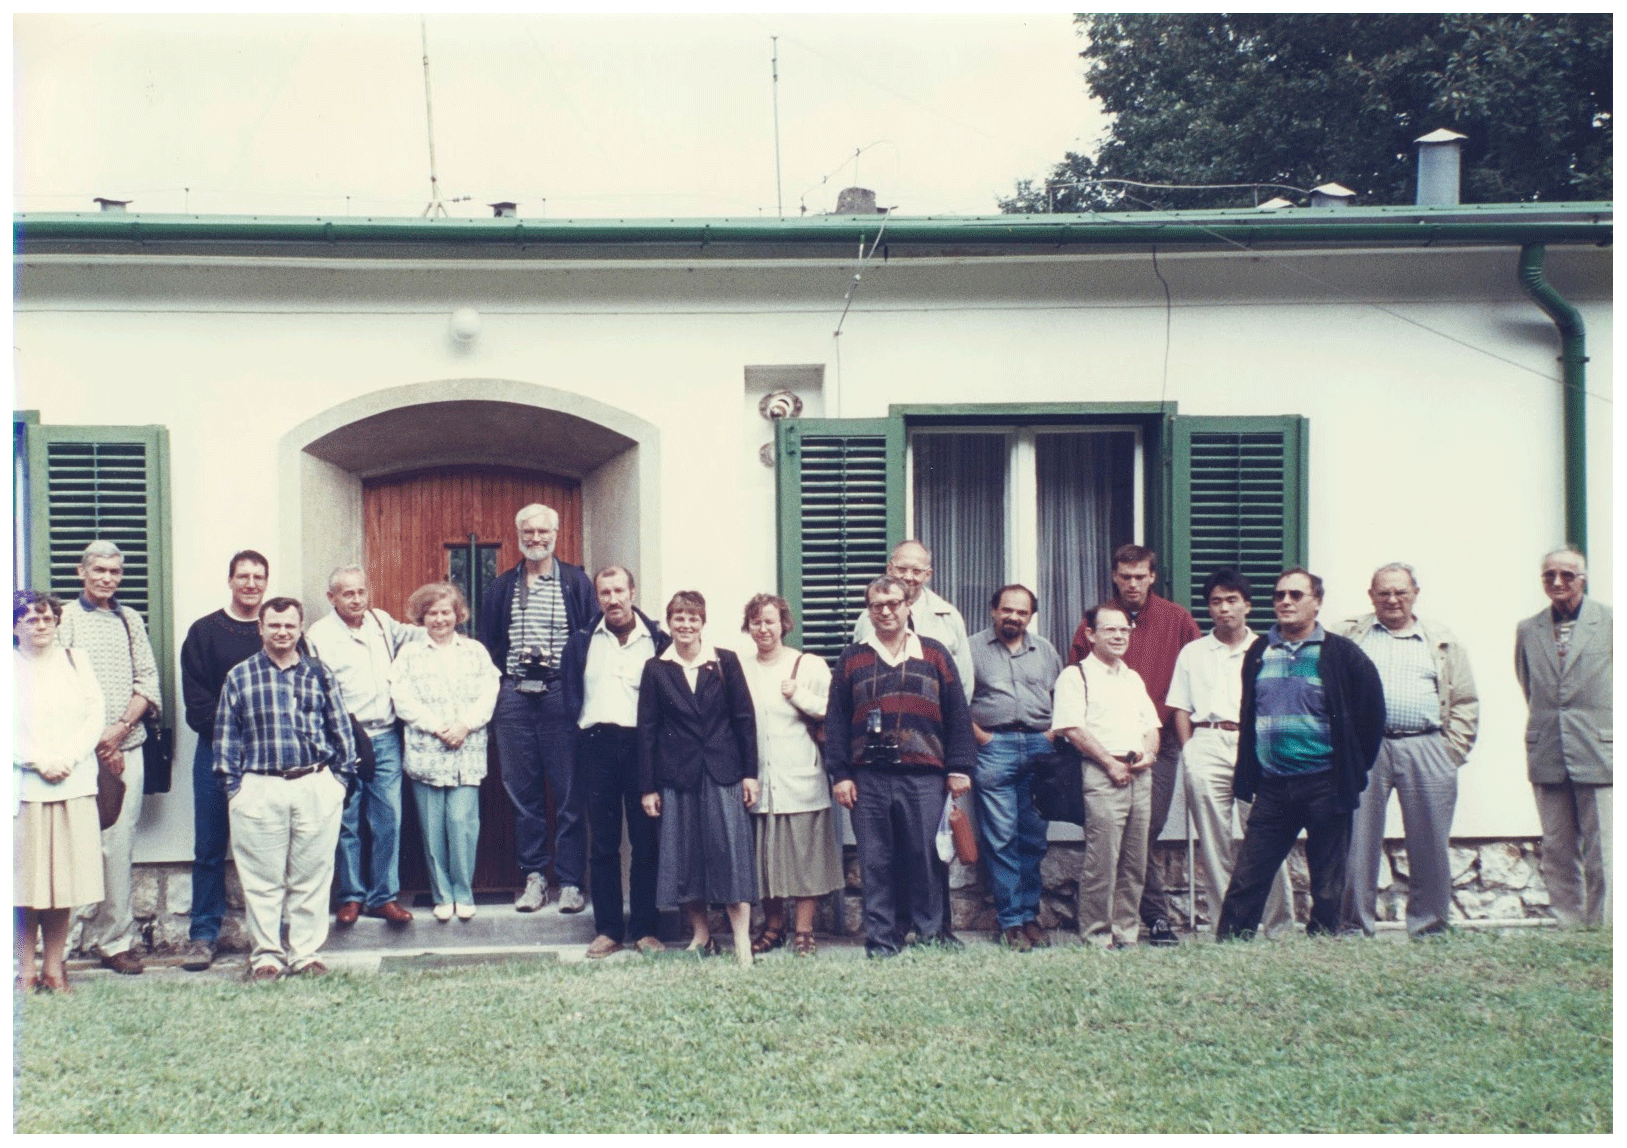
Figure 11The first international workshop on Schumann resonances in Sopron, 7–10 September 1998. Visiting the Nagycenk Observatory, standing from left to right, were Judit Szendrői, Vadim Mushtak, Colin Price, Robert Boldi, Ferenc Märcz, Gabriella Sátori, Earle Williams, Pavel P. Belyaev, Adriena Ondraskova, Dalia Buresova, Lubomir Tuma, Pavel Kostecky, Károly Kovács, Alexander P. Nickolaenko, Martin Füllekrug, Yasuhide Hobara, János Horváth, Ákos Wallner, and Pál Bencze.
Unfortunately, due to the strong disturbing effect of railway lines which run near the observatory and have been electrified after the establishment of the observatory, the quality of the magnetic measurements is not good enough to extract high-quality spectral parameters of SRs. Nevertheless, the magnetic measurements can still be utilized to investigate SR transients. Parallel registration of the two horizontal magnetic and the vertical electric components enables the calculation of the horizontal projection of the Poynting vector, which is an important property of transient signals. It is possible to estimate the location, polarity, and charge moment change of the source discharge from these measurements. From 1998, an additional unit receiving GPS signals provides timing information for the records (Symmetricom TrueTime XL-AK GPS clock with a PC interface card).
In addition to the quasi-real-time calculated SR peak parameters, the digitized raw time series of the measured field components have also been saved since 2003, thanks to enormous improvements in data storage technology. This important development enabled the investigation not only of background SRs but also of SR transients. Analogue signals are digitized and stored at about a 500 Hz sampling rate. This high rate of sampling enables fast processing of the data series in the time domain.
Because of the ageing of the system over the decades, occasional renovations were necessary. Grounding of the electric antenna was reinforced in 2012, and the insulating lower pillar of the antenna had to be replaced in April 2019. Recently, LEMI-120 type induction coils have been purchased to replace the old magnetic antennas, which were originally built at the institute and had been inherited from early magnetosonic experiments. The installation of the new coils is, however, not finished at the time of writing this review, because the coils have been in use in the meantime in various field experiments.
2.3.2 Scientific achievements based on SR measurements at the NCK observatory
The exceptionally long data series of SR parameters, as well as the high-time-resolution extremely low-frequency (ELF) time series of the horizontal magnetic and vertical electric field components enabled investigating various characteristics of the global thunderstorm activity, the Earth–ionosphere waveguide, and many phenomena that arise from electromagnetic coupling processes taking place in the near-Earth space. Numerous studies benefiting from SR observations mainly at Nagycenk were done in the frame of cooperation in this field with other institutions (Fig. 11). Some of the most important results are highlighted below.
Considering the SR in connection with the variations of the global lightning activity:
-
the semi-annual variation of tropical lightning activity was validated using SR observations at NCK (Nickolaenko et al., 1998);
-
meridional redistribution of global lightning during the super El Niño event of 1997–1998 was followed in SR records from NCK (Sátori and Zieger, 1999);
-
independent pieces of evidence were given for the meridional redistribution of global lightning with satellite lightning observations in the case of warm and cold El Niño–Southern Oscillation (ENSO) episodes (Sátori et al., 2009);
-
lightning, thermodynamic, and hydrological comparisons were made for the two tropical continental chimneys: the Congo and Amazon basins (Williams and Sátori, 2004);
-
special dynamics of north–south seasonal migration of global lightning were shown based on SR observations at NCK (Sátori et al., 2013);
-
an SR inversion code was developed for reconstruction of the global lightning activity (Prácser et al., 2019).
Regarding the utilization of SR in characterizing the state of the Earth–ionosphere waveguide:
-
The Earth–ionosphere cavity response for the 11-year solar cycle was disclosed based on multi-station SR observations (Sátori et al., 2005). Figure 12 shows the frequency variations of the first SR mode in case of the vertical electric field component for a time period longer than two solar cycles. This can be considered a fairly unique time series of SR spectral parameters. Variations on the diurnal and annual timescale are the manifestation of the zonal and meridional redistribution of global lightning with respect to the Nagycenk observer. The long-term changes with two frequency minima in 1996 and 2008–2009 and two frequency maxima at around 2002 and 2014–2015 indicate the Earth–ionosphere cavity response over the ∼ 11-year solar cycle. More details can be found in the citations in Sátori and Zieger (1999) and Sátori et al. (2005).
-
Signatures of the day–night asymmetry of the Earth–ionosphere cavity were identified in high-time-resolution SR records (Sátori et al., 2007).
-
Effects of energetic solar emissions were studied on the Earth–ionosphere cavity of SRs (Sátori et al., 2016).
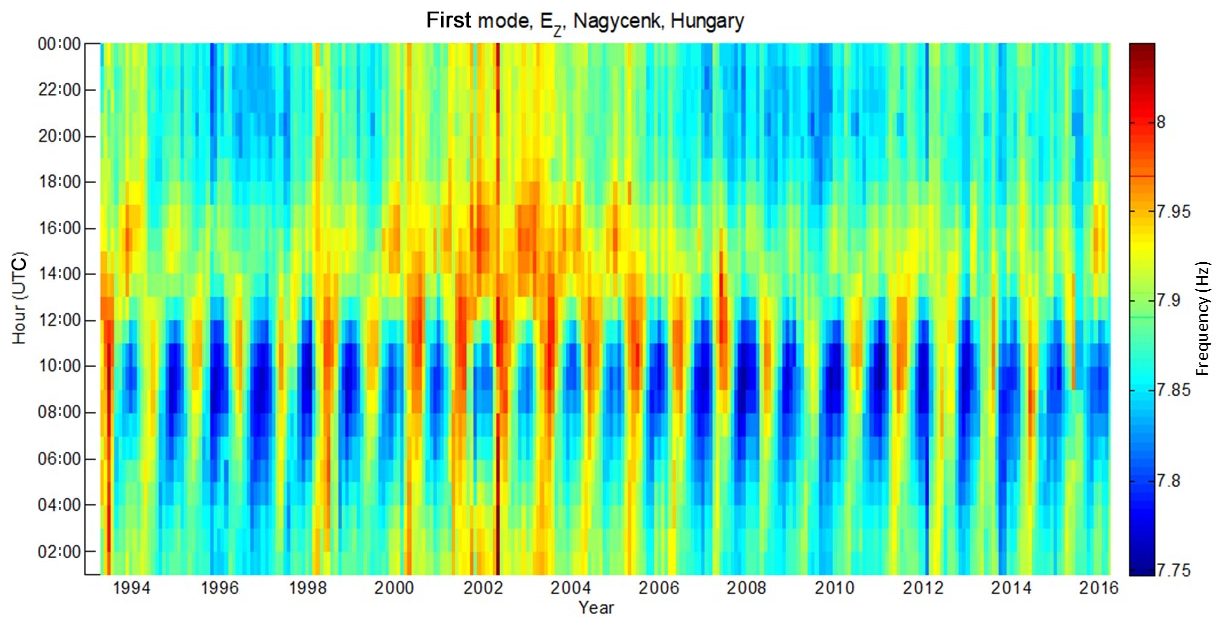
Figure 12SR frequency record of the vertical electric field component at Nagycenk between May 1993 and February 2016.
As for research benefiting from the detection and analysis of SR transients (Q bursts):
-
The response of the Earth–ionosphere waveguide to an extreme intensive and focused gamma burst radiation from a magnetar, a type of intense space weather event, has been investigated. The event resulted in transient excitation of the waveguide which was detected worldwide in the ELF band and could be well modelled by an accurately parameterized vertical current source (Nickolaenko et al., 2014).
-
The analysis of errors in the ELF data-based estimations of source direction of Q bursts detected at the NCK station supports the suggestion that regions of inhomogeneous conductivity in the waveguide boundary regions (also those in the Earth's crust which can affect the measured polarization of transient ELF signals) and source localization can be improved significantly if the corresponding effect is correctly taken into account (Bór et al., 2016).
-
The charge moment change (CMC) of lightning strokes capable of triggering the appearance of various types of transient luminous events (TLEs; e.g. red sprites or sprite halos) (Sátori et al., 2013, and references therein) or the CMC in gigantic jets, another type of TLE, have been estimated from transient signals detected at the NCK station (Soula et al., 2011). Statistics of the obtained CMC estimates were used (1) to characterize TLE producing thunderstorms in Europe and in the Mediterranean region, (2) to reveal the origin of apparent polarity asymmetry in parent strokes of red sprites (i.e. the sprite polarity paradox) (Williams et al., 2012), and (3) to describe the relationship between the brightness of sprites and the CMC in their parent lightning strokes (Nnadih et al., 2018).
2.4 Observations of the ionosphere
2.4.1 Absorption of radio waves in the ionospheric D layer
In the middle of 1960s, it was clarified that the atmospheric electric field cannot be considered the vertical component of the geoelectric field. On the other hand, the coupling between the state of the ionosphere and the geomagnetic field was revealed. The Geophysical Research Laboratory, therefore, made efforts to measure and quantitatively characterize properties of the ionosphere.
As a first step, the so-called A3 method was implemented to study the absorption of radio waves upon their reflection from the lower ionosphere. The method utilizes low-to-high-frequency-band (LF-to-HF, 0.03–30 MHz) commercial transmitters within a range of the receiving station so that the signals from the transmitter arrive at the receiver both along the surface (surface wave) and at most after one reflection from the lower ionosphere. The ground wave component can be filtered out from the received signal if a magnetic loop antenna is set so that the normal of the loop antenna is perpendicular to the direction of the transmitter. In this way, amplitude variations of the sky wave can be studied. These variations reflect changes of the height of the reflection point, which reflect changes in the electron density profile in the lower ionosphere. The height region in the ionosphere to which the obtained information corresponds depends on the carrier frequency of the transmitter, and thus the receiver must be tuned accurately to that frequency (Bencze, 2001, 2007).
The challenge of building an appropriate measuring device has been overcome and the instrument was implemented locally under the direction of Pál Bencze (Fig. 13). A heterodyne receiver was created with a crystal-controlled oscillator to achieve frequency stability of the device using analogue technology (Bencze, 2001). The recorder was supported by a three-stage amplifier for studying both stronger and weaker absorptions during the day and the night, respectively. The measurements started in 1966 with two receivers tuned to the Ceskoslovensko (272 kHz) and Budapest (539 kHz) transmitters. Experiments were carried out using the Bratislava transmitter (1098 kHz), too (Bencze and Märcz, 1981). The attenuation was given with respect to the power of the surface wave. The receiver, placed in the atmospheric-electricity house, was scaled regularly by turning the plane of the loop antenna in discrete steps.
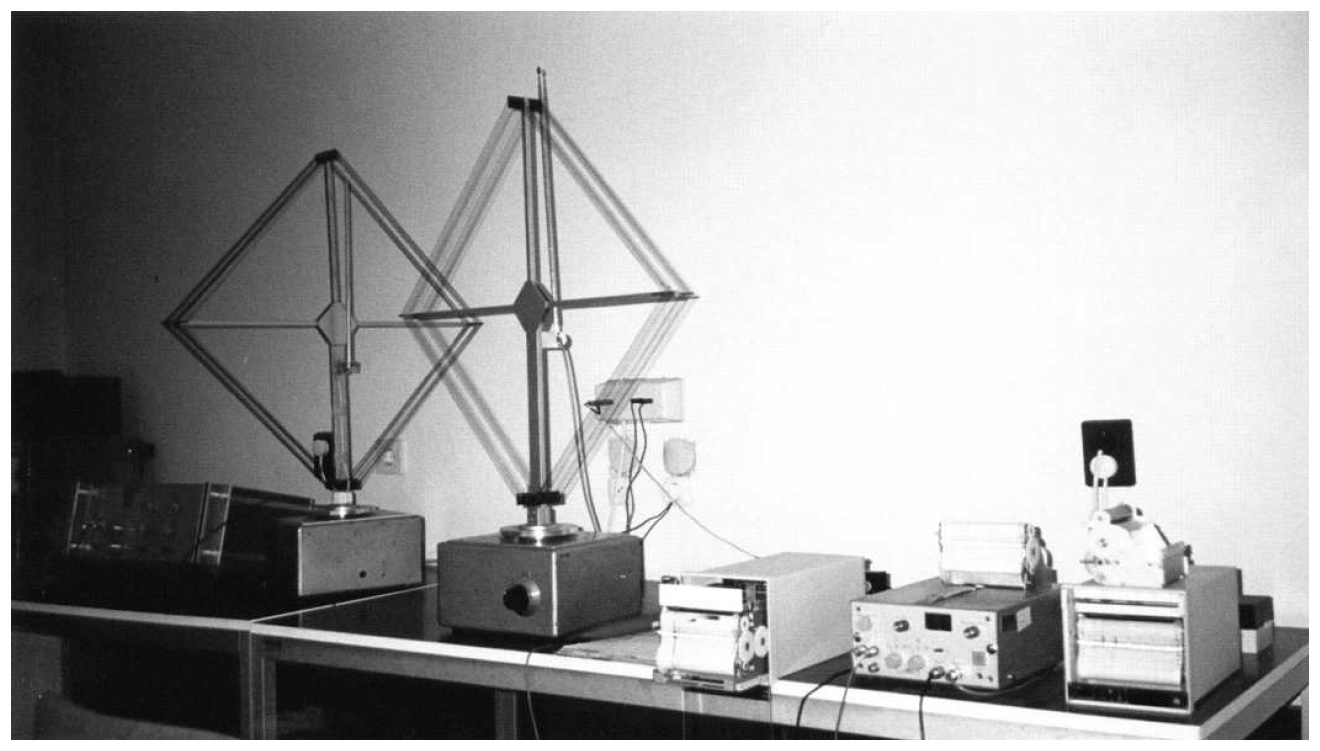
Figure 13Frame antennas and recording devices used for the measurement of the ionospheric absorption of radio waves. (Re-printed from Bencze, 2001, Fig. 11.)
A significant result of these observations was that presence of anomalously high ionospheric absorption could be detected during winter in spite of the low solar zenith angle even at the location of the NCK observatory, i.e. at middle latitudes. This phenomenon is known as the winter anomaly, and it is caused by wintertime thermospheric winds, which transport NO from higher atmospheric regions to the lower ionosphere. The anomaly is manifested in an enhancement in the absorption caused by the excess of NO which is easily ionized by ionizing radiations (Bencze and Szemerédy, 1973).
It was also observed that additional ionization due to aftereffects of geomagnetic storms can cause anomalous absorption in the lower ionosphere. The increase in PG values following the geomagnetic storm key day indicate the existence of links between the global electric circuit and ionospheric absorption due to extraterrestrial influences (Märcz, 1976)
Consistency of the measurements requires the transmitted power to be constant. This condition was broken first in the case of the Budapest transmitter, and later also for the Czech transmitter, where the power had been reduced because of financial issues. Thus, A3 type measurements were eventually stopped at NCK in 1999. Results of the observations as well as recorded data were published in the series of Geophysical Observatory Reports (GOR, 2019).
2.4.2 Ionospheric sounding
Vertical incidence sounding of the ionosphere in Hungary started at a meteorological station of the National Meteorological Institute (now the Hungarian Meteorological Service) in Békéscsaba in the International Geophysical Year, 1957–1958. The IPS-42 type ionosonde was transported to NCK in 1992 following the reduction of staff at the Hungarian Meteorological Service. The installation of this Australian ionosonde took a long time, since building the antenna system (transmitter and receiver) and upgrading the device to enable digital recording were necessary (Sátori et al., 2013).
Despite the efforts, the ionosonde could not produce ionograms with good quality in the high-frequency range. Nevertheless, the low-frequency part of the ionogram was suitable to study the detailed structure of sporadic E (Es) layers. A campaign measurement, when soundings were carried out every 3 min, revealed that the smallest distance between higher electron density patches of Es is about a few kilometres (Bencze et al., 2004).
Another study, which used the IPS-42 ionosonde data, focused on the behaviour of the ionosphere during the total solar eclipse of 11 August 1999. During the eclipse, the ionizing extreme ultraviolet (EUV) and X radiations were decreased compared to the usual values. The location of the NCK observatory was especially favourable for this study because it was situated within the zone of totality and the totality occurred just after local noon at 12:47 LT. The ionospheric soundings were again made every 3 min. While the change of the foF2 (the critical frequency of the F2 layer) was negligible, the critical frequency of the F1 layer (foF1) decreased by about 34 % during the eclipse (Fig. 14, Korte et al., 2001). Furthermore, a ∼1.3 MHz reduction was observed in the critical frequency of the E layer (foE) (Sátori et al., 2013).
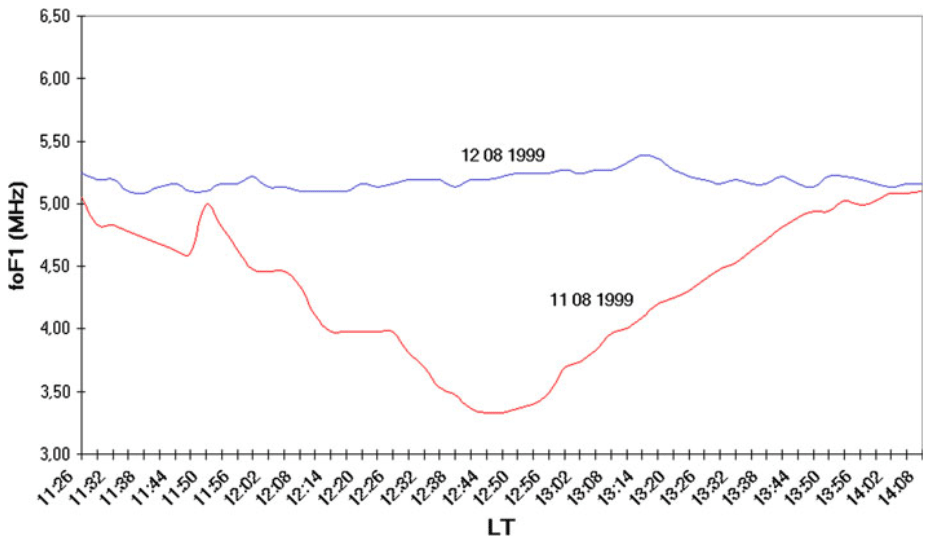
Figure 14Variation of the critical frequency of the F1 layer foF1 during the total solar eclipse of 11 August 1999 and in the same interval on the next day observed in the Geophysical Observatory Nagycenk, Hungary. (Re-printed from Sátori et al., 2013, Fig. 22.)
A VISRC2 type ionosonde manufactured by the Space Research Centre of the Polish Academy of Sciences was installed in the NCK observatory in 2007. The Polish ionosonde worked with two delta antennas perpendicular to each other because the transmitter and the receiver antenna were combined and was used both for transmission and reception. The ionograms were recorded in a digital form. However, they were not scaled automatically. Therefore, all the ionograms which were used for scientific purposes have been checked manually.
Thunderstorm activity effects on the overlying sporadic E layers have been studied by means of campaign measurements in central Europe during two night-time thunderstorms (Barta et al., 2017). Ionograms were measured at intervals of 1 min at Pruhonice and 2 min at NCK during the two campaign periods. Red sprites were observed above the thunderstorms in both cases. Furthermore, wave-like variations generated by the thunderstorm were detected by a 3.59 MHz five-point continuous HF Doppler system located in the western part of the Czech Republic. According to the results, the primary effect on the ionosphere occurred through atmospheric gravity waves produced by the thunderstorm which can destroy or sometimes reinforce Es layers (Fig. 15). However, no direct relation was determined between the sprite activity and the variation of the overlying Es layer.

Figure 15The reduction and disappearance of the ongoing Es layer activity detected at Pruhonice during part of the time of a traversing thunderstorm. Temporal variations of (a) h'ES, (b) foEs, (c) peak current and polarity of CG strokes within 200 km from Pruhonice with the sprite-parent discharges shown in red, and (d) the continuous Doppler sounding spectrogram. Doppler-shifted signals in the time interval 21:30–23:00 LT inside the red rectangular form S-like traces (as is magnified in the inset), which are attributed to a wave-like modulation caused by gravity waves. (Re-printed from Barta et al., 2017, Fig. 3.)
The effect of three strong geomagnetic storms on the F2 layer was analysed using the data from the VISRC2 ionosonde (Berényi et al., 2018). The local time of the sudden commencement (SC) was used to identify the type of the generated ionospheric storms. The authors observed a fade-out of the ionospheric layers at night during the geomagnetically disturbed periods.
The effects of solar flares on ionospheric absorption have been investigated via systematic analysis of ionograms measured at midlatitude and low-latitude ionosonde stations under different solar zenith angles (Barta et al., 2019). Variation of the lowest recorded ionosonde echo, i.e. the minimum frequency (fmin, a qualitative proxy for the “nondeviative” radio wave absorption occurring in the D layer), has been considered during eight X- and M-class solar flares in solar cycle 23. Total and partial radio fade-out was experienced at all ionospheric stations during intense solar flares (> M6). The results indicate that the fmin parameter is highly dependent on the X-ray radiation intensity, but it also depends on the solar zenith angle of the observation site.
A Lowell type ionosonde (DPS-4D Digisonde) has been installed at NCK in the framework of the project “Cosmic hazards and effects” (grant no. GINOP-2.3.2-15-2016-00003), and it has been operating since June 2018 (Fig. 16). Thanks to the installation, NCK joined the international ionosonde network, GIRO (Global Ionospheric Radio Observatory; GIRO Network, 2019). In the GIRO system more than 50 Digisonde DPS-4D ionospheric sounders provide real-time data from all over the globe (GIRO, 2019) in order to monitor the ionosphere on regional and global scales. Besides the regular ionograms, the new instrument is able to monitor the motion of the ionospheric plasma. Moreover, performing synchronized measurements with the same type of ionosondes provides the opportunity to investigate the occurrences and propagation of the so-called travelling ionospheric disturbances (TIDs).
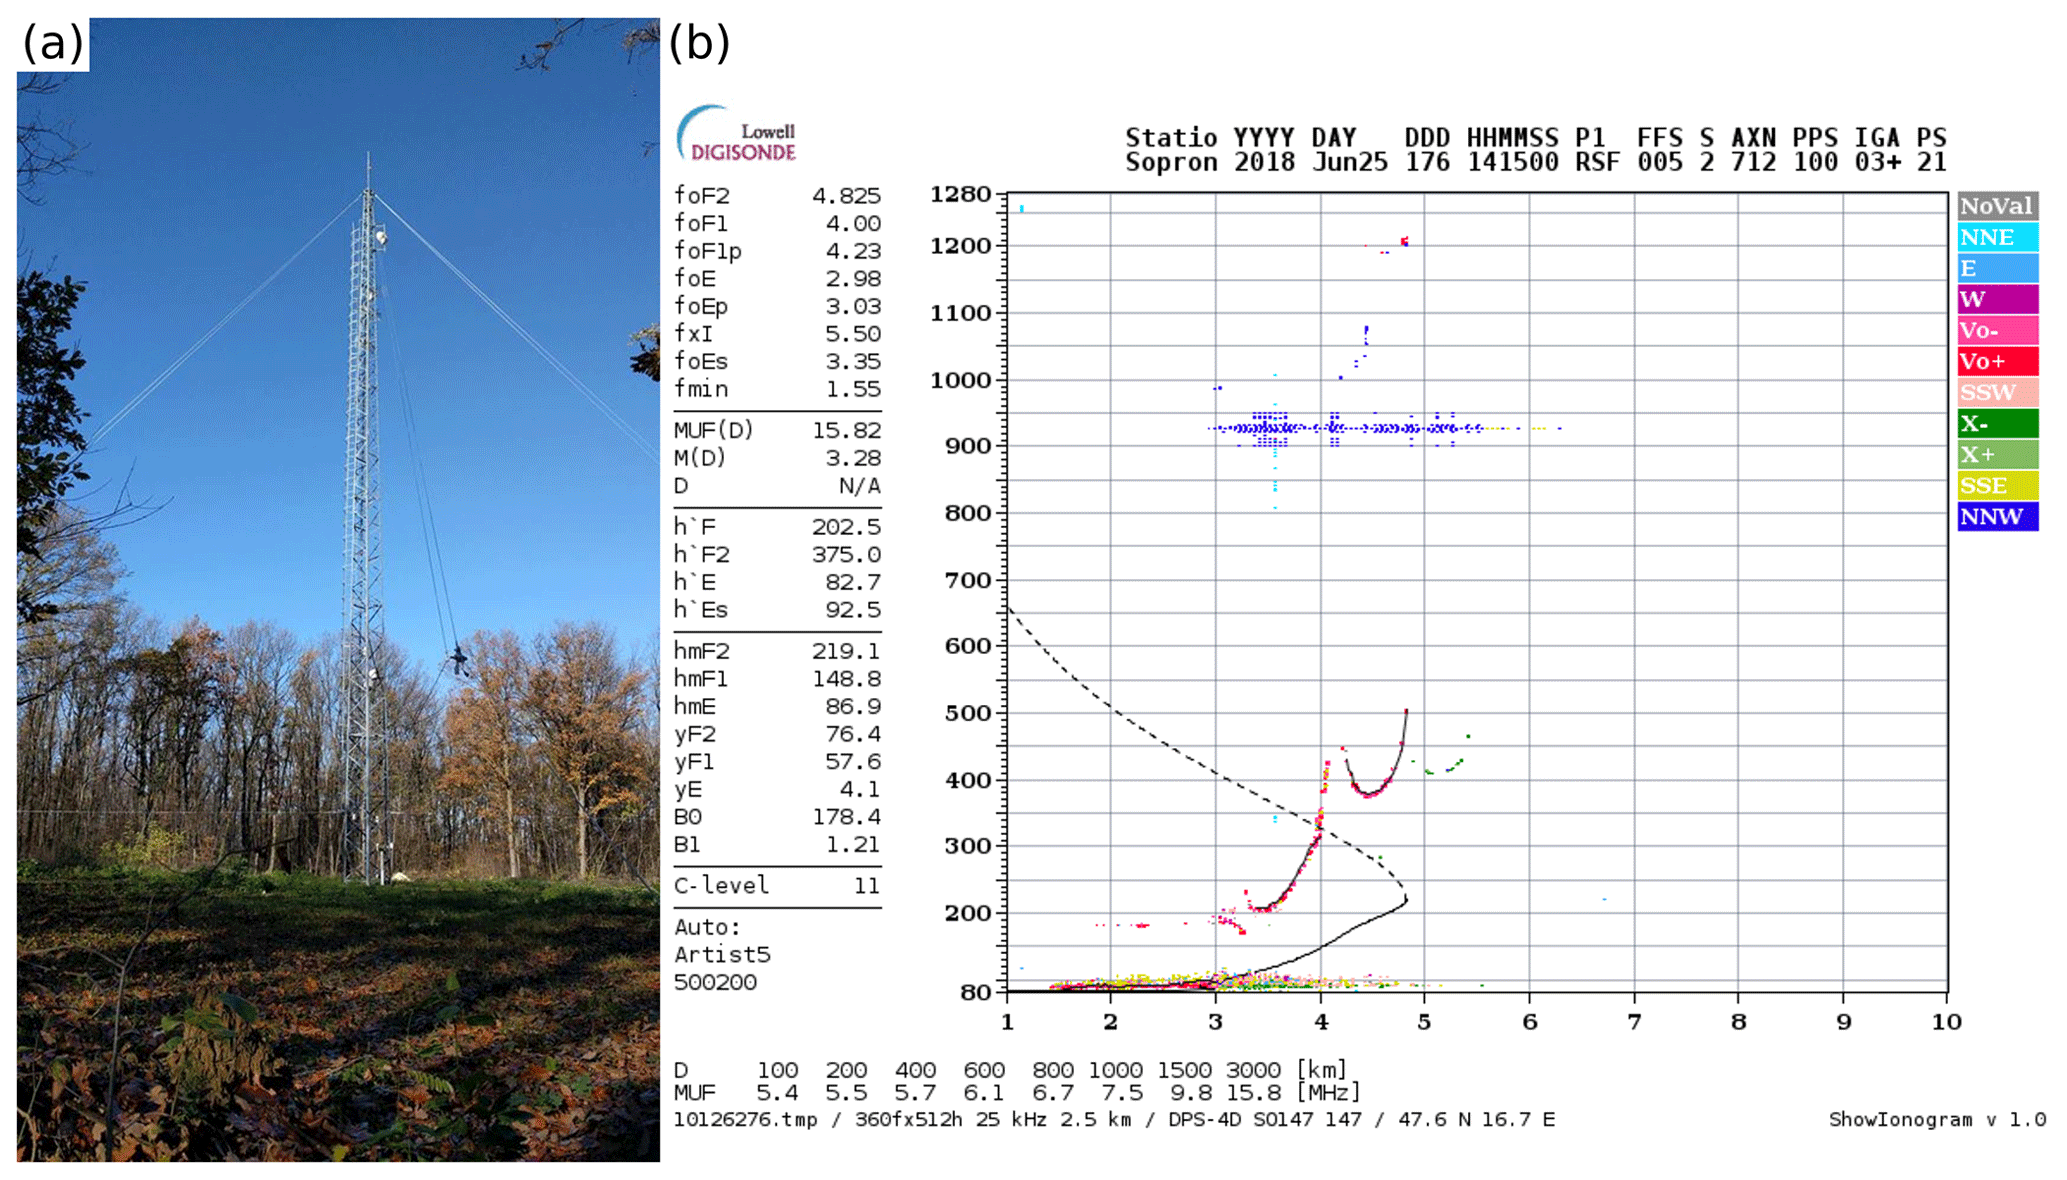
Figure 16(a) The transmitter antenna of the DPS-4D Digisonde at NCK and (b) one of the first ionograms detected by the system.
2.5 Measurements of the vertical electric current
Conductivity of the air, the vertical electric field, and the vertical current density are related by Ohm's law, so theoretically at least two of these quantities must be known for the local electric environment to be well characterized at a measuring site. Note that this equation is not always fulfilled in practice even for co-located measurements of all three parameters (Israel, 1973). This indicates that one should have thorough knowledge on the local conditions as well as full control over the measurement in order to be able to obtain accurate and reliable results. This is, however, rather difficult to achieve in practice.
From the three parameters, it is the vertical current which is less affected by local conditions, so, at least during fair-weather conditions, this quantity reflects best the global state of the GEC (Nicoll, 2012). This is why the measurement of the vertical current was implemented in the NCK observatory using a collector screen of 1 m2 surface mounted at ground level (Fig. 17). The current was registered by a picoamperemeter. Despite the promising start (Bencze et al., 1984), the instrument was not working properly. Attempts to make such measurements were made only in a couple of years in the 1980s (Bencze, 2007), and the records have not been published.
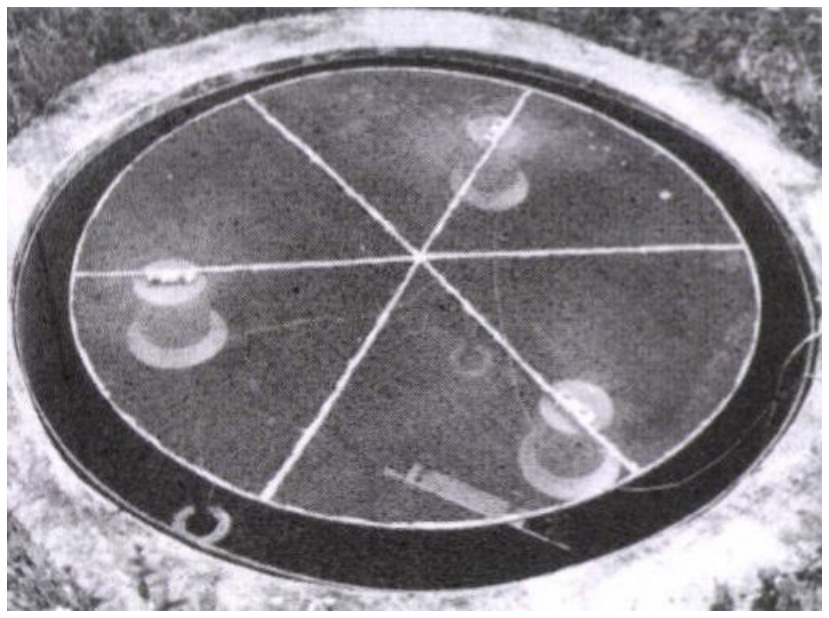
Figure 17Collector screen for the measurement of the vertical current. (Re-printed from Bencze, 2007, Fig. 3.)
2.6 Lightning detection
Lightning plays a key role in maintaining the AC part of the GEC (Rycroft et al., 2012). CSFK has been supporting the reliable detection of lightning strokes by hosting a sensor of the LINET lightning detection network (Betz et al., 2008, 2009) since 2006. LINET sensors are operating in the VLF/LF (very-low-frequency/low-frequency) band. The network provides a GPS-based accurate time of occurrence, geographical location, peak current (uncertainty is less than 10 %), polarity and type (CG/IC) of lightning strokes, and a height estimation for IC lightning.
The hosted sensor of the network was moved from Sopron to the NCK observatory in 2017. Signals detected by the magnetic loop antenna (Fig. 18) are automatically sent to a central processing unit in Germany on the internet. Lightning data can be obtained from Nowcast GmbH that manages the network.
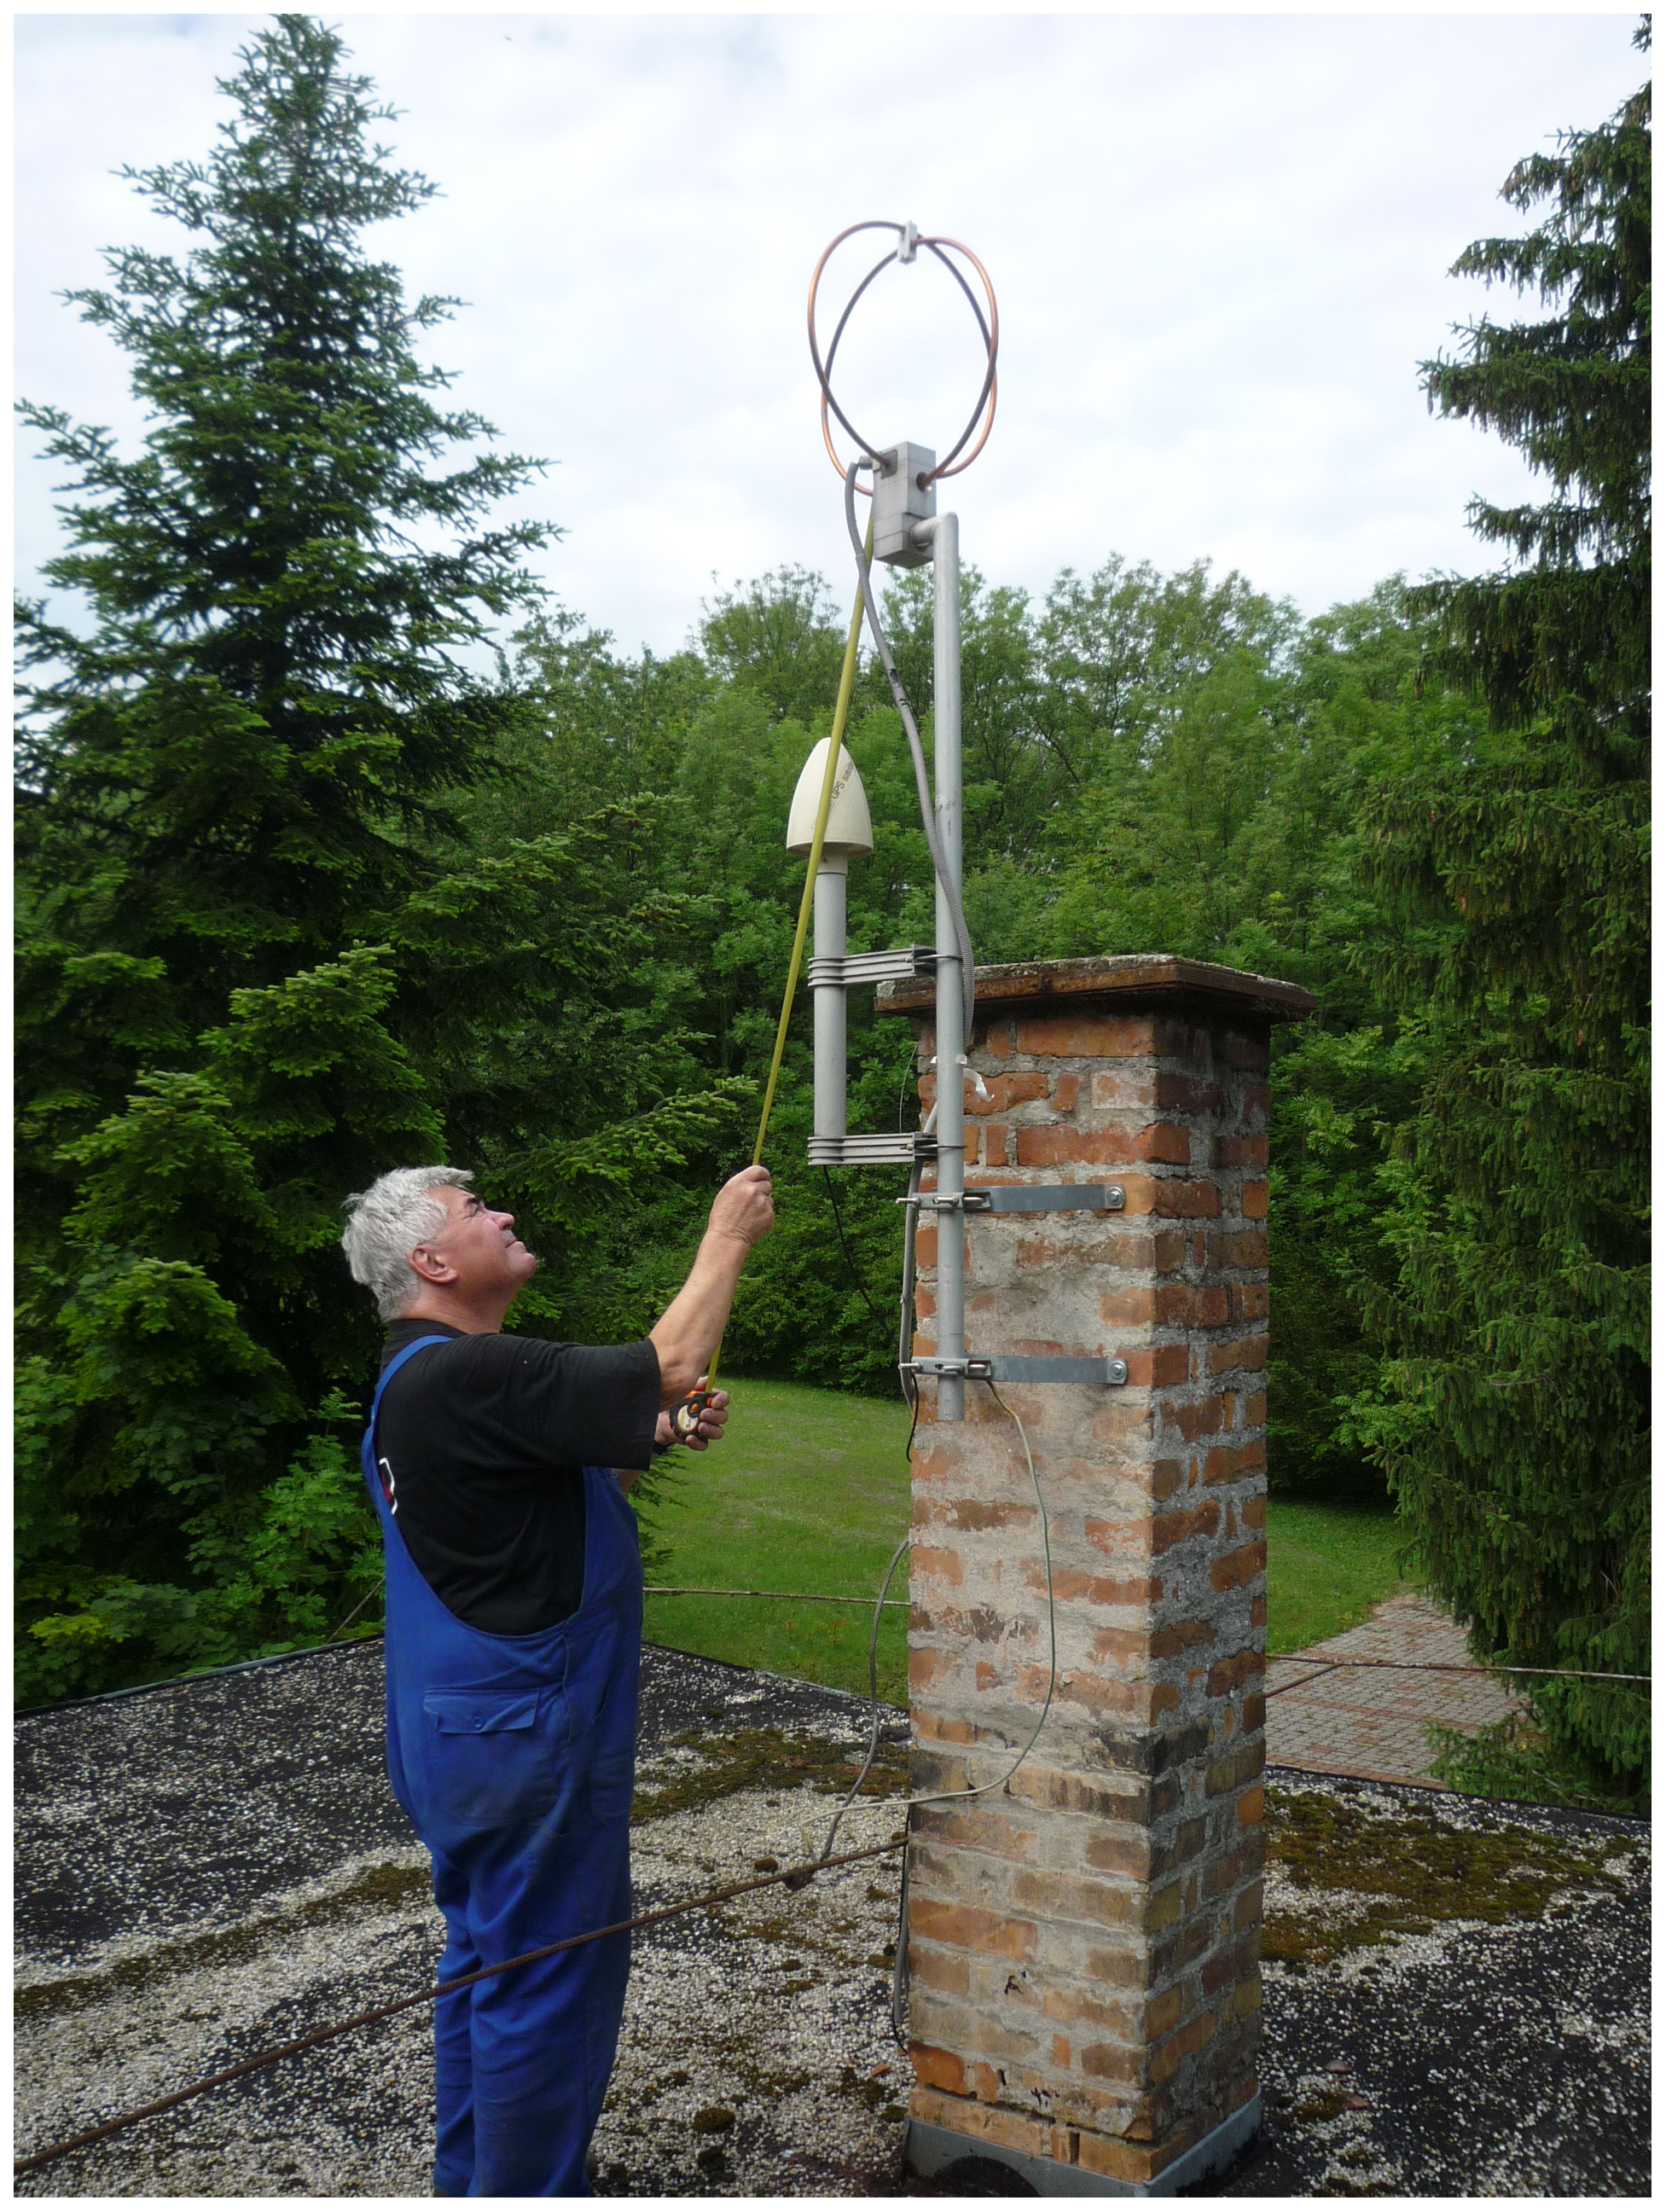
Figure 18Gyula Pálla is adjusting the loop antenna of the LINET station on the roof of the office building at the NCK observatory. Note that the chimney is not functioning.
2.7 VLF measurements
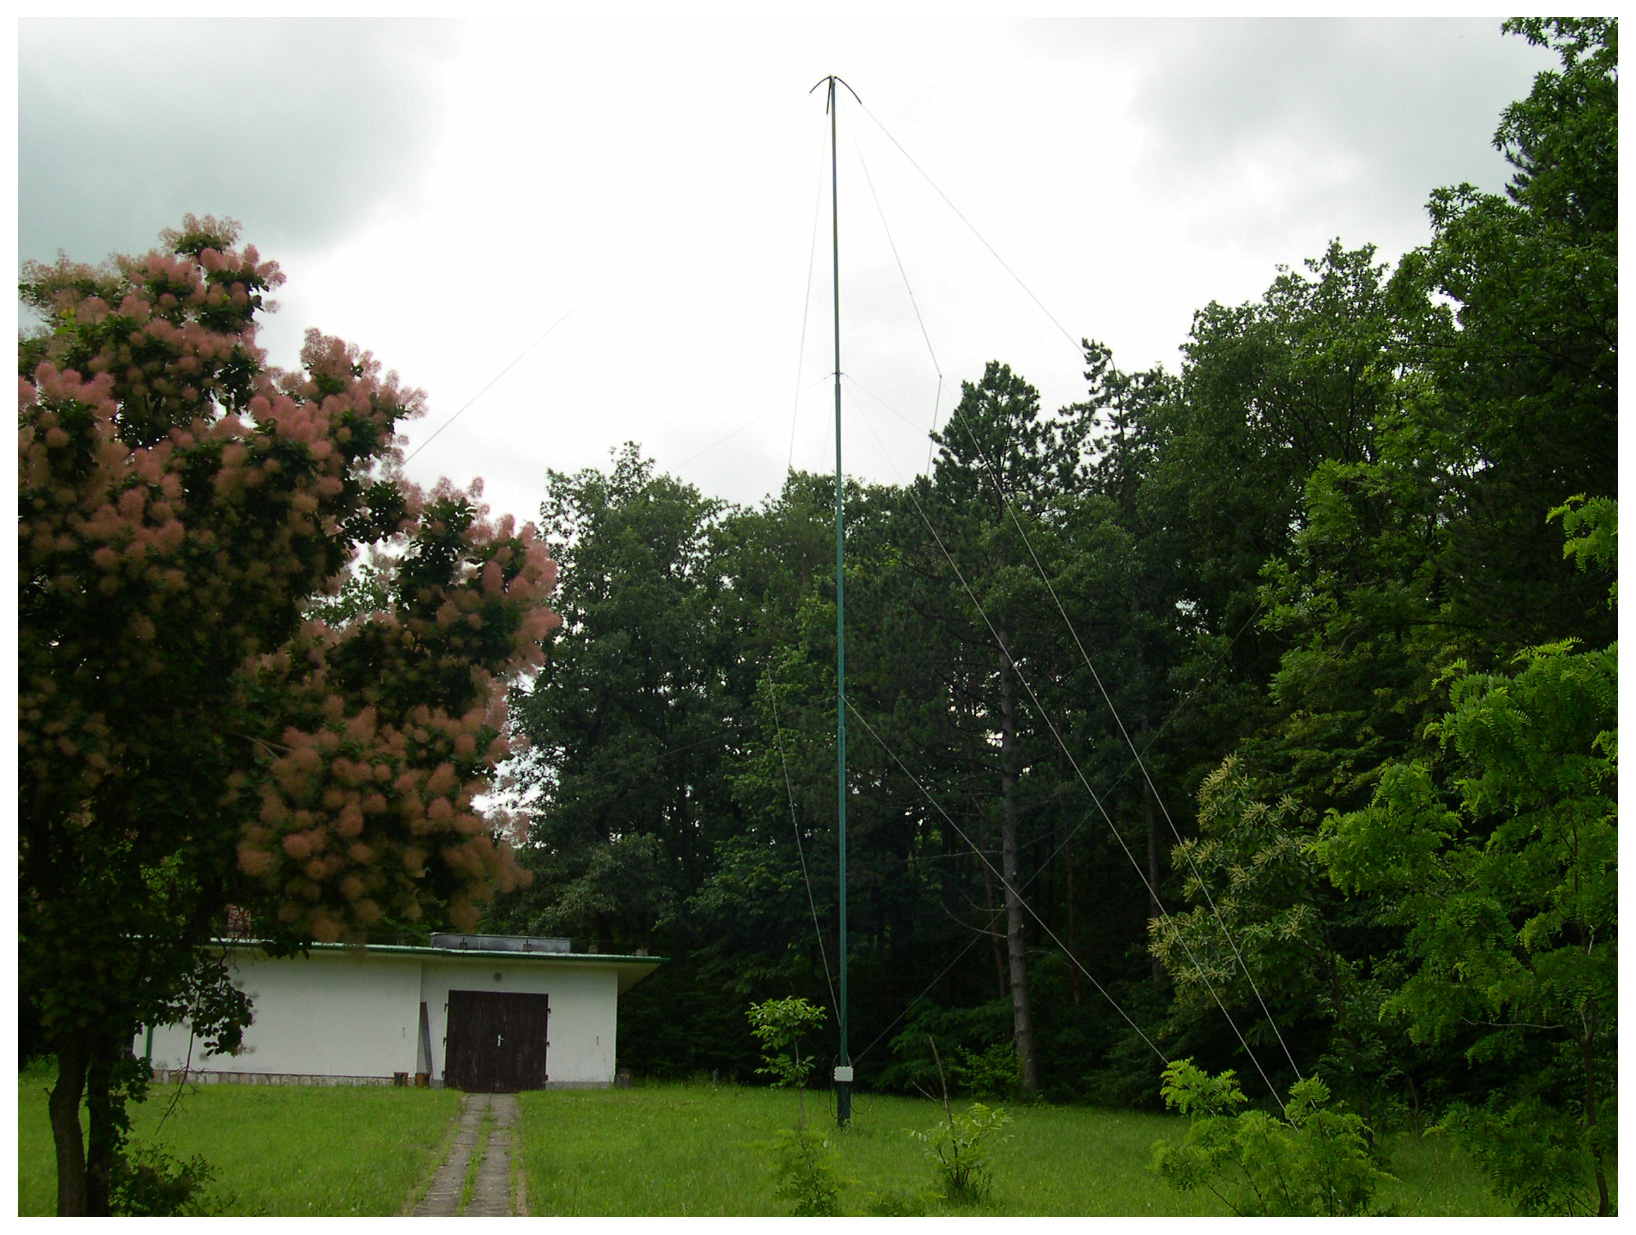
Between the ionosonde house and the meteorological station (Fig. 2) a VLF antenna has been operating since 2003 as part of the AWDA (Automatic Whistler Detector and Analyzer) network (Lichtenberger et al., 2008, 2010) (Fig. 19). The broadband VLF measurement targets mainly the detection and analysis of VLF whistlers, providing a cheap and effective way to routinely infer the cold plasma distribution of the inner magnetosphere. The antenna consists of two large, diamond-shaped perpendicular magnetic loops supported by a ∼16–17 m tall mast. The loops are oriented towards the geomagnetic north–south and east–west directions. This apparatus allows the arrival azimuth of a signal to be detected. The measured signal is pre-amplified, digitized, and finally sent to a PC in the ionosonde house where it is analysed. The AWDA station at Nagycenk was the second installation of its kind in the network. As such, it has been a site subject to continuous development with major upgrades. In 2006, the PC sound card used as a digitizer unit was replaced by a dedicated sampler called VR1 (Lichtenberger et al., 2008), and the timing accuracy has been increased from 10 ms to 80 ns by installing a GPS receiver. This development was necessary to improve the processing algorithms for signals recorded simultaneously at several measuring stations. In 2008, the receiver has been updated again to model VR2 (Lichtenberger et al., 2008), which has a reduced level of internal electronic noise and is capable of a maximal sampling rate of 200 kHz. This latter capability can be utilized in campaign measurements, while the receiver is operated normally at 40 kHz. As part of the PLASMON (monitoring of the plasmasphere) FP7 (7th Framework Programme of the European Commission) project in 2014, the site was upgraded for real-time analysis of whistlers using a PC equipped with high-performance graphical processing unit (GPU) cards (Lichtenberger et al., 2013). Results of the whistler analysis, including data from Nagycenk, have been published by Koronczay et al. (2019).
Apart from wideband measurements, narrowband VLF signals are collected as well by means of the UltraMSK receiver (ULTRAMSK, 2019). The analysis of arrival azimuths and amplitudes of sub-ionospheric signals can be used to detect electron precipitation in the lower ionosphere, as well as transient changes in the ionization due to other effects, e.g. earthquakes and solar eclipses (Clilverd et al., 2001). Narrowband measurements at Nagycenk became part of the AARDDVARK (Antarctic–Arctic Radiation-belt (Dynamic) Deposition – VLF Atmospheric Research Konsortium) network looking for particle precipitation events (Clilverd et al., 2008).
Noise in the lower VLF band (below 10 kHz) has increased over the years. It was experimentally determined to originate from outside of the observatory. This noise significantly hampered the capability of the system at NCK to detect whistlers (Fig. 20). As a consequence, maintenance of the VLF experiment at NCK was temporarily suspended in 2015, and a broadband receiver with a smaller antenna was installed at a site 20 km from the observatory, at Muck in the Sopron Mountains. Narrowband VLF observations, nevertheless, continued at NCK because the fully digitized system at the new site has been designed specifically for whistler detection, and it lacks narrowband detection functionality. Archive data and access to real-time VLF records from NCK and Muck in the Sopron Mountains are available upon request from author Dávid Koronczay.
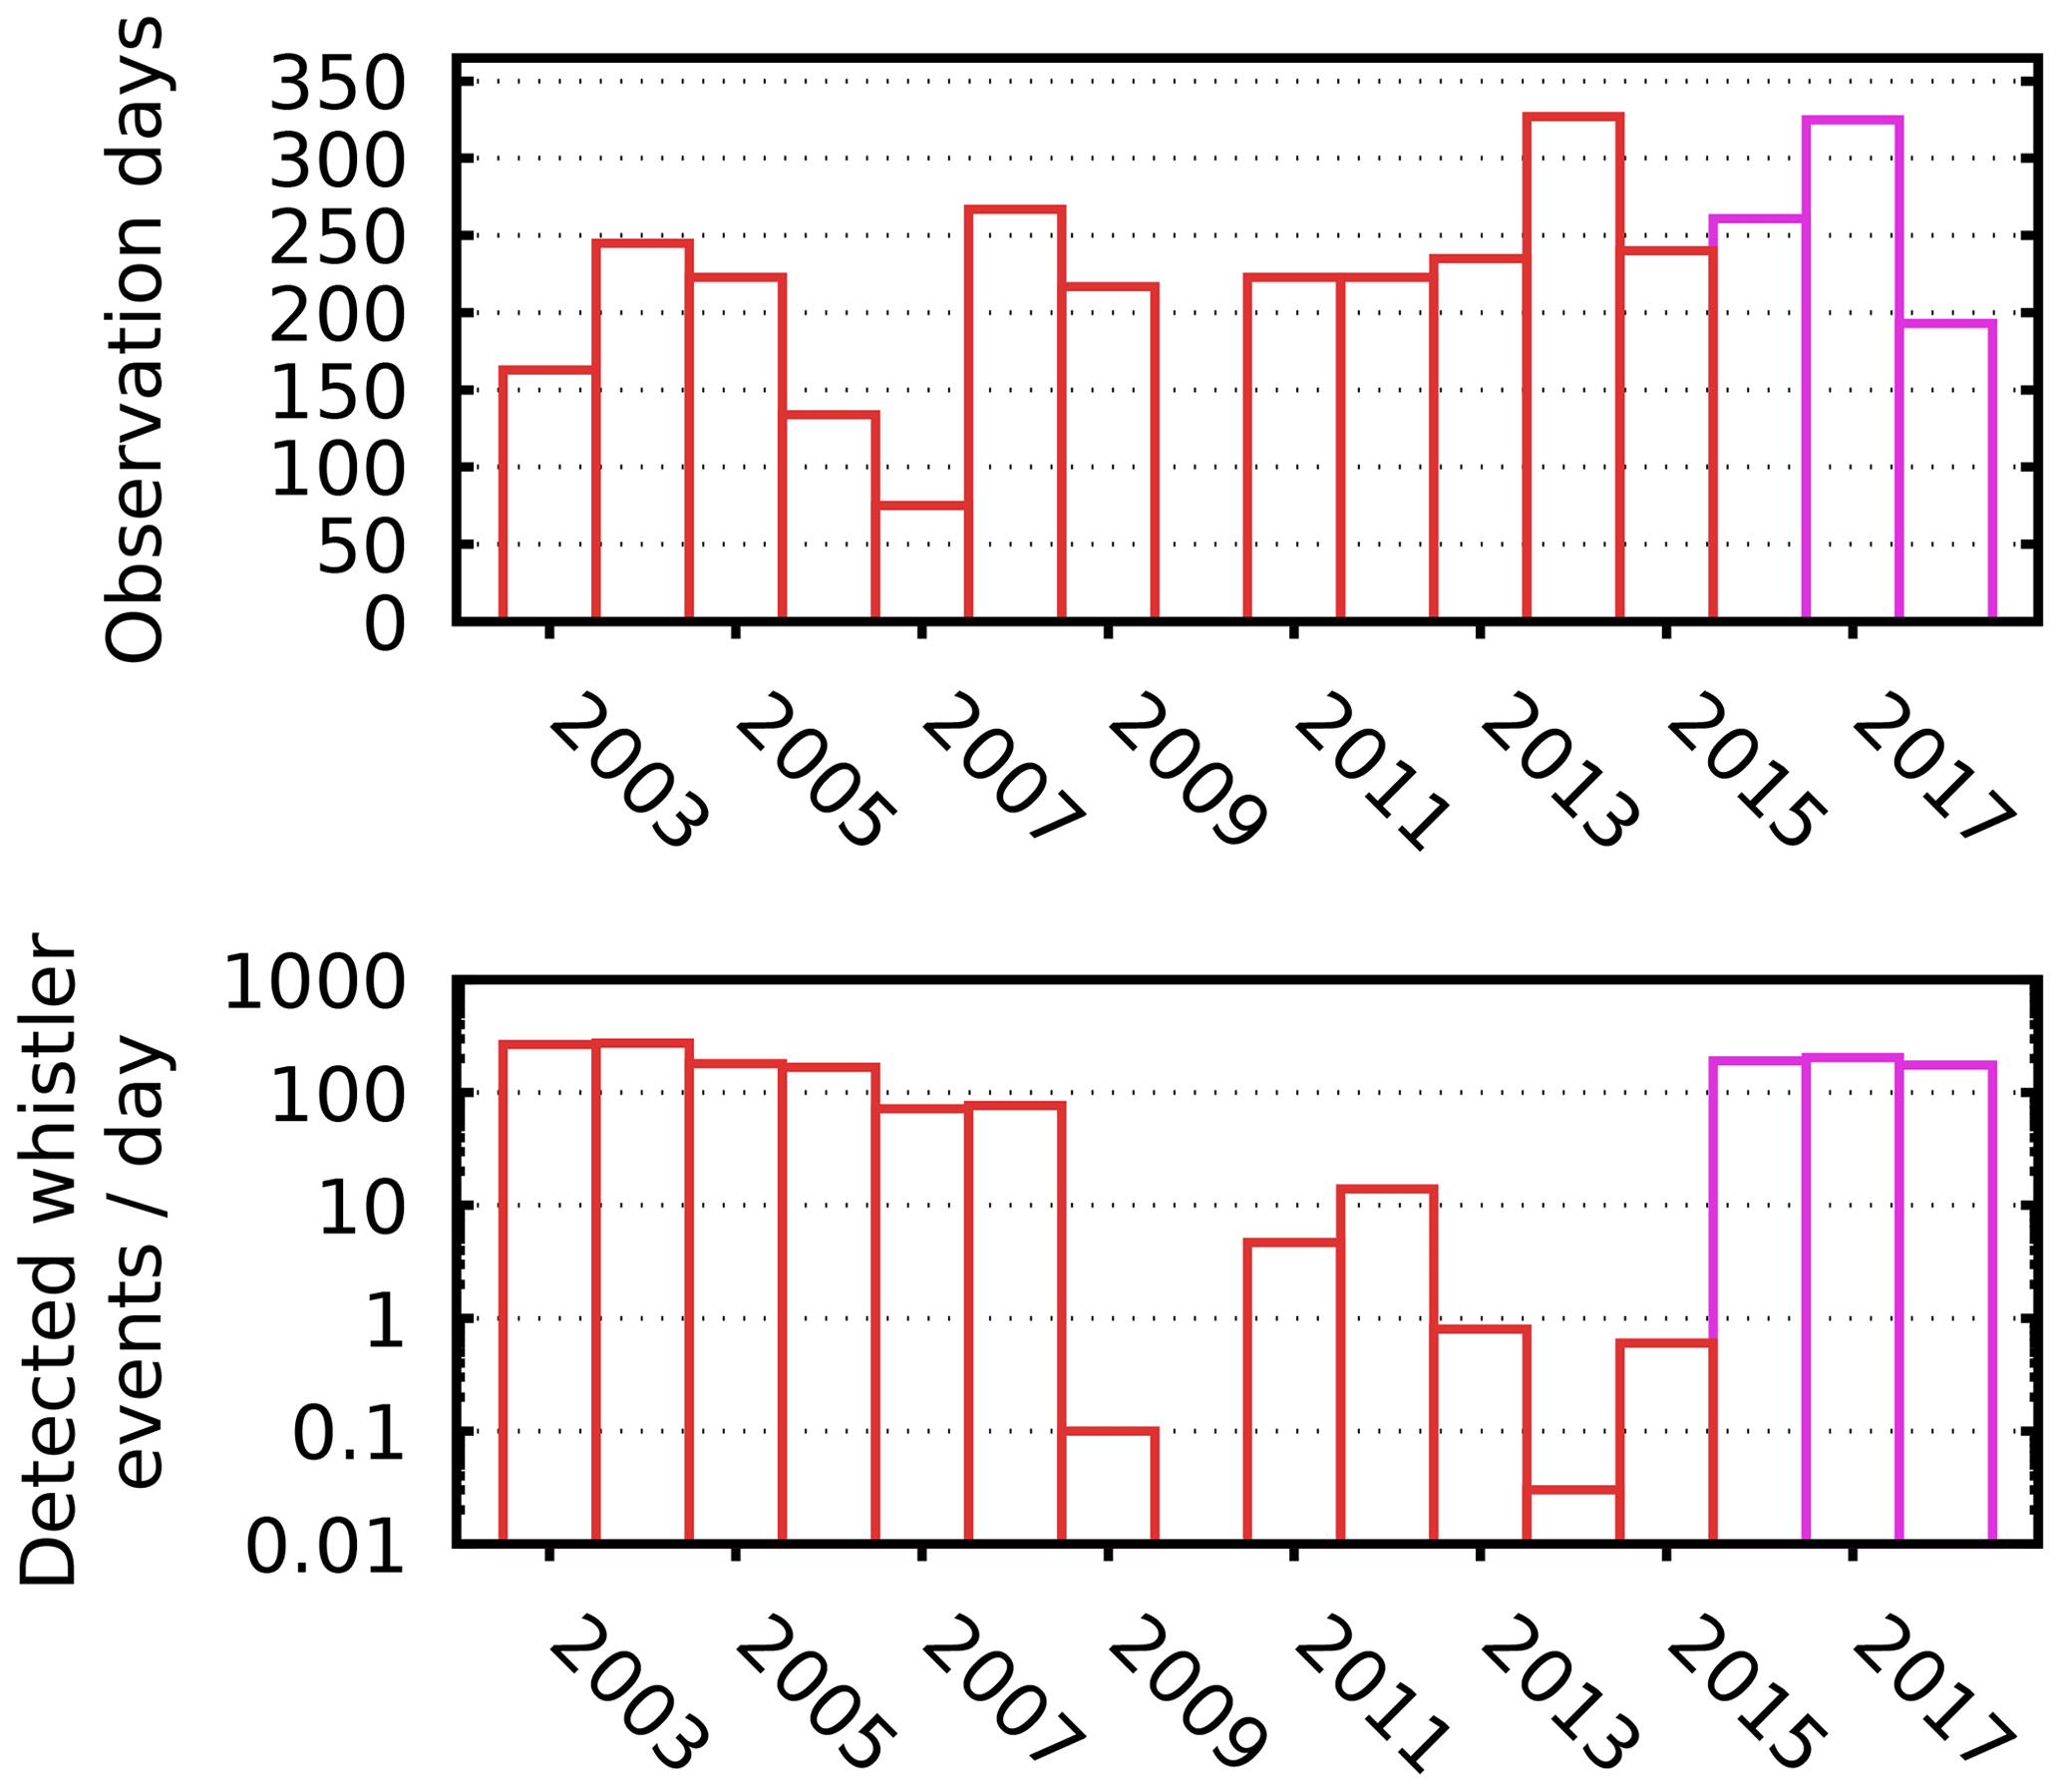
Figure 20Number of days the AWDA whistler detector was active in a given year (top) and the average daily rate of detected whistler events (singular or group whistlers) at Nagycenk (2003–2015, in red) and at the temporary station at Muck in the Sopron Mountains (2016 onwards, in magenta). The drop in the daily rate of detections (from a maximum of around 260) is due to increasing electromagnetic noise originating outside of the observatory's premises.
3.1 Earth currents
At NCK, the registration of Earth (telluric) currents began in 1957 (Wesztergom, 2001). It was the first regular measurement of the newly established observatory. Potential differences in the north–south and east–west directions are measured by polarization lead plate electrodes which are buried about 2 m below the surface in a distance of 500 m in the woods surrounding the closed area of the observatory. The sampling interval of the registration is 1 and 10 s.
3.2 Geomagnetic measurements
Regular observation of the Earth's geomagnetic field with control of the absolute observations started in 1961 at NCK (Bencze, 2001). From 1993 the observatory has part in the Intermagnet collaboration (Rasson, 2007). The observatory is equipped with three sets of triaxial fluxgate magnetometers aligned in the X, Y, and Z directions. Samples of 10 s are used to provide minute average values for the Intermagnet data service. Recorded data are published in the Geophysical Observatory Reports (GOR, 2019).
3.3 SAR reflector
Microwave synthetic aperture radar (SAR) systems provide a modern tool for high-precision monitoring of surface deformation via the interferometric processing technique (Rosen et al., 2000). Based on the parameters of the Sentinel-1 SAR satellite (C-band, λ=5.55 cm), the Geodetic and Geophysical Institute, in collaboration with the Department of Broadband Infocommunications and Electromagnetic Theory of the Budapest University of Technology and Economics, developed an optimal artificial passive reflector that was installed at the NCK observatory in 2014 (Fig. 8).
The Széchenyi István Geophysical Observatory has a privileged position within the field of geophysical research in Hungary, hosting the widest range of atmospheric electricity measurements in the country. During its operation of more than 60 years at the time of writing this review, the site has always been a centre of pioneering experiments in and beyond the field of atmospheric electricity. Fulfilling the hopes and justifying the hard work of its founders and later maintainers, data collected in the observatory are well recognized internationally and serve geophysical research worldwide.
Datasets from NCK are available pertaining to Earth current measurements (since 1957), geomagnetic field measurements (since 1961), meteorological observations (1996–2012 and from 2017 onwards), ionospheric absorption monitoring (1966–1999), and ionospheric sounding (campaign measurements after 1992 and regular observations since June 2018). Specifically, available datasets on DC and AC components of the GEC contain measurements of point discharge current (1961–2003), atmospheric electric potential gradient (since 1961), Schumann resonances (amplitudes and frequencies of the first three resonance modes: since 1993 in the vertical electric field and since 1996 in the horizontal magnetic field and raw time series of both field components since 2004), and VLF records (wideband/whistlers from 2003 to 2015 and narrowband since 2003).
Records before 2007 have been published as data tables in the series of Geophysical Observatory Reports (GOR, 2019). Recently, measured data have been archived in digitized form in state-of-the-art storage facilities of the mother institution of the observatory and, in some cases, in databases corresponding to international projects and measuring campaigns. Access to recently collected data can be requested from the authors or via the options provided by the coordinators of international co-operations, i.e. Intermagnet for geomagnetic data (Rasson, 2007), LINET/Nowcast GmbH for lightning data (Betz et al., 2008, 2009), the GIRO network for ionospheric sounding data (GIRO Network, 2019), the PLASMON project (Lichtenberger, 2013) and the AARDDVARK network (Clilverd, 2008) for VLF data, and GloCAEM for PG (Nicoll et al., 2019).
JB conceptualized the project and contributed to all sections. GS contributed to Sect. 2.2 and 2.3 and validated the content. TB contributed to Sects. 2.3, 2.7, and 3. VB contributed to Sect. 2.2 and 2.4.2. AB contributed to Sect. 2.2. DK contributed to Sect. 2.7. KSA contributed to Sect. 2.2.1, visualized the data, and formatted and validated the content. JS visualized the data. VW validated the content.
The authors declare that they have no conflict of interest.
The authors would like to thank János Lichtenberger and István Bozsó for providing additional information on various measurements running in the observatory. The authors thank Karen Aplin, Michael Rycroft, and the reviewers of this paper for their encouraging and helping comments and suggestions. This work was supported by the National Research, Development and Innovation Office, Hungary (NKFIH; grant no. K115836). The installation of the DPS-4D Digisonde at the NCK has been carried out in the framework of the project “Cosmic hazards and effects” (grant no. GINOP-2.3.2-15-2016-00003).
This research has been supported by the Nemzeti Kutatási, Fejlesztési és Innovációs Hivatal (grant no. K115836) and the Economic Development and Innovation Operational Programme (grant no. GINOP-2.3.2-15-2016-00003).
This paper was edited by Karen Aplin and reviewed by Michael J. Rycroft and one anonymous referee.
Ádám, A. and Bencze, P.: Study of natural energy sources in the low frequency band, Magyar Geofizika, 4, 29–35, 1963 (in Hungarian).
Ádám, A., Vero, J., Miletits, L., Hollo, J. C., and Wallner, A.: The geophysical observatory near Nagycenk. I. Electromagnetic measurements and processing of data, Acta Geod. Geoph. Mont. Hung., 16, 333–351, 1981.
Balser, M. and Wagner, C.: Measurement of the spectrum of radio noise from 50 to 100 c/s, J. Res. Natl. Bur. Stand., 64D, 415–418, https://doi.org/10.6028/jres.064d.050, 1960.
Barta, V., Haldoupis, C., Sátori, G., Buresova, D., Chum, J., Pozoga, M., Berényi, K. A., Bór, J., Popek, M., Kis, A., and Bencze, P.: Searching for effects caused by thunderstorms in midlatitude sporadic E layers, J. Atmos. Sol-Terr. Phy., 161, 150–159, https://doi.org/10.1016/j.jastp.2017.06.006, 2017.
Barta, V., Sátori, G., Berényi, K. A., Kis, Á., and Williams, E.: Effects of solar flares on the ionosphere as shown by the dynamics of ionograms recorded in Europe and South Africa, Ann. Geophys., 37, 747–761, https://doi.org/10.5194/angeo-37-747-2019, 2019.
Bencze, P.: The annual variation of the ratio of the quantities of negative to positive charge transported by point discharge, Acta Geod. Geoph. Mont. Hung., 1, 93–105, 1966.
Bencze, P.: History (The beginnings and the IGY), in: Geophysical Observatory reports of the Geodetic and Geophysical Research Institute of the Hungarian Academy of Sciences, Year 1994–1998, Nagycenk Geophysical Observatory, edited by: Wesztergom., V., publisher Dr. József Závoti director, Sopron, Hungary, pp. 9–23, available at: http://real-j.mtak.hu/1105/ (last access: March 2020), 2001.
Bencze, P.: Atmospheric electric and ionospheric measurements in the geophysical observatory Nagycenk: some earlier and recent results, in: Geophysical Observatory reports of the Geodetic and Geophysical Research Institute of the Hungarian Academy of Sciences, Year 2005–2006, Nagycenk Geophysical Observatory, edited by: Wesztergom., V., publisher Dr. József Závoti director, Sopron, Hungary, pp. 161–170, available at: http://real-j.mtak.hu/1108/ (last access: March 2020), 2007.
Bencze, P. and Märcz, F.: The geophysical observatory near Nagycenk II. Atmospheric electric and ionospheric measurements, Acta Geod. Geoph. Mont. Hung., 16, 353–357, 1981.
Bencze, P. and Szemerédy, P.: Variation of the level of atmospheric radio noise after geomagnetic disturbances, Acta Geod. Geoph. Mont. Hung., 8, 251–257, 1973.
Bencze, P., Szemerey, I., and Märcz, F.: The measurements of the air-earth current in the Geophysical Observatory near Nagycenk, Acta Geod. Geoph. Mont. Hung., 19, 347–352, 1984.
Bencze, P., Buresova, D., Lastovicka, J., and Märcz, F.: Behaviour of the F1 region, and Es and spread-F phenomena at European middle latitudes particularly under geomagnetic storm conditions, Ann. Geophys., 47, 1131–1143, https://doi.org/10.4401/ag-3290, 2004.
Berényi, K. A., Barta, V., and Kis, A.: Midlatitude ionospheric F2-layer response to eruptive solar events-caused geomagnetic disturbances over Hungary during the maximum of #24 solar cycle: a case study, Adv. Space Res., 61, 1230–1243, https://doi.org/10.1016/j.asr.2017.12.021, 2018.
Betz, H. D., Schmidt, K., and Oettinger, W. P.: LINET – An international VLF/LF lightning detection network in Europe, in: Lightning: Principles, instruments and applications, edited by: Betz, H. D., Schumann, U., and Laroche, P., Springer, Dordrecht (NL), 115–140, https://doi.org/10.1007/978-1-4020-9079-0_5, 2008.
Betz, H. D., Schmidt, K., Laroche, P., Blanchet, P., Oettinger, W. P., Defer, E., Dziewit, Z., and Konarski, J.: LINET-An international lightning detection network in Europe, Atmos. Res., 91, 564–573, https://doi.org/10.1016/j.atmosres.2008.06.012, 2009.
Boltek: http://www.boltek.com/downloads/efm-100/, last access: 29 October 2019.
Bór, J., Ludván, B., Attila, N., and Steinbach, P.: Systematic deviations in source direction estimates of Q-bursts recorded at Nagycenk, Hungary, J. Geophys. Res.-Atmos., 121, 5601–5619, https://doi.org/10.1002/2015JD024712, 2016.
Buzás, A., Horváth, T., Barta, V., and Bór, J.: Revisiting the decreasing trend of atmospheric electrical potential gradient measured in Central Europe at Nagycenk, Hungary, Geophys. Res. Abstracts, 20, EGU2018-6723, 2018.
CEDA: https://catalogue.ceda.ac.uk/uuid/5db074ddfc7945e9813b4308f8a03420, last access: 29 October 2019.
Clilverd, M. A., Rodger, C. J., Thomson, N. R., Lichtenberger, J., Steinbach, P., Cannon, P., and Angling, M. J.: Total solar eclipse effects on VLF signals: Observations and modeling, Radio Sci., 36, 773–788, https://doi.org/10.1029/2000RS002395, 2001.
Clilverd, M. A., Rodger, C. J., Thomson, N. R., Brundell, J. B., Ulich, T., Lichtenberger, J., Cobbett, N., Collier, A. B., Menk, F. W., Seppälä, A., Verronen, P. T.,, and Turunen, E.: Remote sensing space weather events: Antarctic-Arctic Radiation-belt (Dynamic) Deposition-VLF Atmospheric Research Konsortium network, Space Weather, 7, 1–15, https://doi.org/10.1029/2008SW000412, 2008.
GIRO: http://www.digisonde.com/, last access: 29 October 2019.
GIRO Network: http://giro.uml.edu/, last access: 29 October 2019.
GOR: http://real-j.mtak.hu/view/journal/Geophysical_Observatory_Reports.html, last access: 29 October 2019.
Harrison, R. G.: The Carnegie Curve, Surv. Geophys., 34, 209–232, https://doi.org/10.1007/s10712-012-9210-2, 2013.
Harrison, R. G. and Nicoll, K. A.: Fair weather criteria for atmospheric electricity measurements, J. Atmos. Sol.-Terr. Phys., 179, 239–250, https://doi.org/10.1016/j.jastp.2018.07.008, 2018.
Hejda, P.: Observatories in East and Central Europe, in: Encyclopedia of Geomagnetism and Paleomagnetism, edited by: Gubbins, D. and Herrero-Bervera, E., 728, Springer, Dordrecht, https://doi.org/10.1007/978-1-4020-4423-6_236, 2007.
Israel, H.: Atmospheric Electricity Vol. 2., Israel Program for Scientific Translations, Jerusalem, 1973.
Koronczay, D., Lichtenberger, J., Clilverd, M. A., Rodger, C. J., Lotz, S. I., Sannikov, D. V., Cherneva, N. V., Raita, T., Darrouzet, F., Ranvier, S., and Moore, R. C.: The source regions of whistlers, J. Geophys. Res.-Space Phys., 124, 5082–5096, https://doi.org/10.1029/2019JA026559, 2019.
Korte, M., Lühr, H., Förster, M., Haak, W., and Bencze, P.: Did the solar eclipse of August 11, 1999 show a geomagnetic effect?, J. Geophys. Res., 106, 18563–18575, https://doi.org/10.1029/2001JA900006, 2001.
Lichtenberger J., Ferencz, C., Bodnár, L., Hamar, D., and Steinbach, P.: Automatic Whistler Detector and Analyzer system: Automatic Whistler Detector, J. Geophys. Res., 113, A12201, https://doi.org/10.1029/2008JA013467, 2008.
Lichtenberger, J., Ferencz, C., Hamar, D., Steinbach, P., Rodger, C. J., Clilverd, M. A., and Collier, A. B.: The Automatic Whistler Detector and Analyzer (AWDA) system: Implementation of the Analyzer Algorithm, J. Geophys. Res., 115, A12214, https://doi.org/10.1029/2010JA015931, 2010.
Lichtenberger, J., Clilverd, M. A., Heilig, B., Vellante, M., Manninen, J., Rodger, C. J., Collier, A. B., Jorgensen, A. M., Reda, J., Holzworth, R. H., and Friedel, R.: The plasmasphere during a space weather event: first results from the PLASMON project, J. Space Weather Space Clim., 3, A23, https://doi.org/10.1051/swsc/2013045, 2013.
Märcz, F.: Links between atmospheric electricity and ionospheric absorption due to extraterrestrial influences, J. Geophys. Res., 81, 4566–4570, https://doi.org/10.1029/JA081i025p04566, 1976.
Märcz, F.: Atmospheric electricity and the 11-year solar cycle associated with QBO, Ann. Geophys., 8, 525–530, 1990.
Märcz, F.: Short-term changes in atmospheric electricity associated with Forbush decreases, J. Atmos. Sol-Terr. Phy., 59, 975–982, https://doi.org/10.1016/S1364-6826(96)00076-4, 1997.
Märcz, F.: Curriculum vitae Pál Bencze, Acta Geod. Geoph. Mont. Hung., 34, 227–237, 1999.
Märcz, F. and Bencze, P.: Variations of the atmospheric electric potential gradient at Nagycenk Observatory, Acta Geod. Geoph. Mont. Hung., 16, 415–422, 1981.
Märcz, F. and Bencze, P.: Surplus of negative charge flow in point-discharge current as shown by variations on different time scales at Nagycenk station, J. Atmos. Sol.-Terr. Phys., 60, 1435–1443, https://doi.org/10.1016/S1364-6826(98)00083-2, 1998.
Märcz, F. and Harrison, R. G.: Long-term changes in atmospheric electrical parameters observed at Nagycenk (Hungary) and the UK observatories at Eskdalemuir and Kew, Ann. Geophys., 21, 2193–2200, https://doi.org/10.5194/angeo-21-2193-2003, 2003.
Märcz, F., Sátori, G., and Zieger, B.: Variations in Schumann resonances and their relation to atmospheric electric parameters at Nagycenk station, Ann. Geophys., 15, 1604–1614, https://doi.org/10.1007/s00585-997-1604-y, 1997.
Märcz, F., Horváth, J., Bencze, P., Sátori, G., and Bór, J.: Simultaneous measurements of the atmospheric electric potential gradient at Nagycenk by means of two individual equipments, Acta Geod. Geoph. Mont. Hung., 36, 269–278, https://doi.org/10.1556/AGeod.36.2001.3.3, 2001.
Nickolaenko, A. P., Sátori, G., Zieger, B., Rabinowicz, L. M., and Kudintseva, I. G.: Parameters of global thunderstorm activity deduced from long-term Schumann resonance records, J. Atmos. Sol.-Terr. Phys., 60, 387–399, https://doi.org/10.1016/S1364-6826(97)00121-1, 1998.
Nickolaenko, A. P., Schekotov, A. Y., Hayakawa, M., Hobara, Y., Sátori, G., Bor, J., and Neska, M.: Multi-point detection of the elf transient caused by the gamma flare of december 27, 2004, Radiophysics and Quantum Electronics, 57, 125–140, https://doi.org/10.1007/s11141-014-9498-5, 2014.
Nicolet, M.: The International Geophysical Year (1957–1958): Great achievements and minor obstacles, GeoJournal, 8, 303–320, https://doi.org/10.1007/bf00185934, 1984.
Nicoll, K. A.: Measurements of atmospheric electricity aloft, Surv. Geophys., 33, 991–1057, https://doi.org/10.1007/s10712-012-9188-9, 2012.
Nicoll, K. A., Harrison, R. G., Barta, V., Bor, J., Brugge, R., Chillingarian, A., Chum, J., Georgoulias, A. K., Guha, A., Kourtidis, K., Kubicki, M., Mareev, E., Matthews, J., Mkrtchyan, H., Odzimek, A., Raulin, J.-P., Robert, D., Silva, H. G., Tacza, J., Yair, Y., and Yaniv, R.: A global atmospheric electricity monitoring network for climate and geophysical research, J. Atmos. Sol.-Terr. Phys., 184, 18–29, https://doi.org/10.1016/j.jastp.2019.01.003, 2019.
Nnadih, S., Kosch, M., Martinez, P., and Bor, J.: First ground-based observations of sprites over southern Africa, South Afr. J. Sci., 114, 4272, https://doi.org/10.17159/sajs.2018/4272, 2018.
Ogawa, T., Tanaka Y., Miura. T., and Yasuhara, M. I.: Observations of natural ELF and VLF electromagnetic noises by using ball antennas, J. Geomag. Geoelectr., 18, 443–454, https://doi.org/10.5636/jgg.18.443, 1966.
Prácser, E., Bozóki, T., Sátori, G., Williams, E., Guha, A., and Yu, H.: Reconstruction of global lightning activity based on Schumann resonance measurements: Model description and synthetic tests, Radio Sci., 54, 254–267, https://doi.org/10.1029/2018RS006772, 2019.
Rasson, J. L.: Observatories, Intermagnet, in: Encyclopedia of Geomagnetism and Paleomagnetism, edited by: Gubbins, D. and Herrero-Bervera, E., 715, Springer, Dordrecht, https://doi.org/10.1007/978-1-4020-4423-6_227, 2007.
Rosen, P. A., Hensley, S., Joughin, I. R., Li, F. K., Madsen, S. N., Rodriguez, E., and Goldstein, R. M.: Synthetic aperture radar interferometry, Proceedings of the IEEE, 88, 333–382, https://doi.org/10.1109/5.838084, 2000.
Rycroft, M. J., Nicoll, K. A., Aplin, K. L., and Harrison, G. R.: Recent advances in global electric circuit coupling between the space environment and the troposphere, J. Atmos. Sol.-Terr. Phys., 90–91, 198–211, https://doi.org/10.1016/j.jastp.2012.03.015, 2012.
Sátori, G.: Preliminary results on the studies related to Schumann resonance observations (in Hungarian), in: A XVII. és a XVIII. Ionoszféra- és Magnetoszféra-fizikai Szeminárium előadásaiból, edited by: Bencze, P., Magyar Asztronautikai Társaság, Budapest, Magyarország, 165–170, 1992.
Sátori, G.: Schumann resonances and geomagnetic activity, in: On the Automatic Classification of Transient Geomagnetic Variations, edited by: Wesztergom, V. and Steiner, T., IAGA 7th Sci. Assembly, IAGA Bull. No. 55/B: 201, 206, 1993.
Sátori, G. and Zieger, B.: El Niňo-related meridional oscillation of global lightning activity, Geophys. Res. Lett., 26, 1365–1368, https://doi.org/10.1029/1999GL900264, 1999.
Sátori, G., Szendrői, J., and Verő, J.: Monitoring Schumann resonances – I. Methodology, J. Atmos. Terr. Phys., 58, 1475–1481, https://doi.org/10.1016/0021-9169(95)00145-X, 1996.
Sátori, G., Williams, E., and Mushtak, V.: Response of the Earth-ionosphere cavity resonator to the 11-year solar cycle in X-radiation, J. Atmos. Sol.-Terr. Phys., 67, 553–562, https://doi.org/10.1016/j.jastp.2004.12.006, 2005.
Sátori, G., Neska, M., Williams, E., and Szendrői, J.: Signatures of the non-uniform Earth-ionosphere cavity in high-time resolution Schumann resonance records, Radio Sci., 42, RS2S10, https://doi.org/10.1029/2006RS003483, 2007.
Sátori, G., Williams, E., and Lemperger, I.: Variability of global lightning activity on the ENSO time scale, Atmos. Res., 91, 500–507, https://doi.org/10.1016/j.atmosres.2008.06.014, 2009.
Sátori, G., Rycroft, M., Bencze, P., Märcz, F., Bór, J., Barta, V., Nagy, T., and Kovács, K.: An Overview of Thunderstorm-Related Research on the Atmospheric Electric Field, Schumann Resonances, Sprites, and the Ionosphere at Sopron, Hungary, Surv. Geophys., 34, 255–292, https://doi.org/10.1007/s10712-013-9222-6, 2013.
Sátori, G., Williams, W., Price, C., Boldi, R., Koloskov, A., Yampolski, Y., Guha, A., and Barta, V.: Effects of Energetic Solar Emissions on the Earth–Ionosphere Cavity of Schumann Resonances, Surv. Geophys., 37, 757–789, https://doi.org/10.1007/s10712-016-9369-z, 2016.
Schumann, W. O.: Über die strahlungslosen Eigenschwingungen einer leitenden Kugel, die von einer Luftschicht und einer Ionosphärenhülle umgeben ist, Zeitschrift für Naturforschung, A7, 149–154, https://doi.org/10.1515/zna-1952-0202, 1952.
Soula, S., van der Velde, O., Montanya, J., Huet, P., Barthe, C., and Bór, J.: Gigantic jets produced by an isolated tropical thunderstorm near Réunion Island, J. Geophys. Res., 116, D19103, https://doi.org/10.1029/2010JD015581, 2011.
ULTRAMSK: http://ultramsk.com/, last access: 29 October 2019.
Wesztergom, V.: Description of the Observatory, in: Geophysical Observatory reports of the Geodetic and Geophysical Research Institute of the Hungarian Academy of Sciences, Year 1994–1998, Nagycenk Geophysical Observatory, edited by: Wesztergom, V., publisher Dr. József Závoti director, Sopron, Hungary, 5–7, available at: http://real-j.mtak.hu/1105/ (last access: March 2020), 2001.
Wesztergom., V. (Ed.): Geophysical Observatory reports of the Geodetic and Geophysical Research Institute of the 580 Hungarian Academy of Sciences, Year 2005–2006, Nagycenk Geophysical Observatory, publisher Dr. József Závoti director, Sopron, Hungary, available at: http://real-j.mtak.hu/1108/ (last access: March 2020), 2007
Williams, E. R. and Sátori, G.: Lightning, thermodynamic and hydrological comparison of the two tropical continental chimneys, J. Atmos. Sol-Terr. Phys., 66, 1213–1231, https://doi.org/10.1016/j.jastp.2004.05.015, 2004.
Williams, E., Kuo, C.-L., Bór, J., Sátori, G., Newsome, R., Adachi, T., Boldi, R., Chen, A., Downes, E., Hsu, R. R., Lyons, W., Saba, M. M. F., Taylor, M., and Su, H.-T.: Resolution of the sprite polarity paradox: The role of halos, Radio Sci., 47, RS2002, https://doi.org/10.1029/2011RS004794, 2012.