the Creative Commons Attribution 4.0 License.
the Creative Commons Attribution 4.0 License.
 | 11 Sep 2020
Behind the curve: a comparison of historical sources for the Carnegie curve of the global atmospheric electric circuit
R. Giles Harrison
The “Carnegie curve” describes the diurnal variation of the global atmospheric electric circuit. It was originally found from atmospheric electric potential gradient (PG) measurements made on the Carnegie, effectively a floating atmospheric electrical observatory, which undertook global cruises between 1915 and 1929. These measurements confirmed that the single diurnal cycle PG variation, previously obtained in both polar regions, was global in extent. The averaged diurnal PG variation, represented by derived harmonic fits, provides a characteristic variation known as the “Carnegie curve”, against which modern measurements are still compared. The ocean air PG measurements were extensively described in reports of the Carnegie Institution of Washington (CIW) but widely used secondary sources of the Carnegie curve contain small differences, arising through approximations and transcription errors. Investigations using the historical CIW data show that the original harmonic fit coefficients are reproducible. Despite the inconsistencies, the secondary sources nevertheless mostly yield diurnal variations which fall within the variability of the original historical data.
- Article
(404 KB) - Full-text XML
- BibTeX
- EndNote


In the early 20th century, the Carnegie Institution of Washington (CIW) pioneered new methods for atmospheric electricity measurements in oceanic air. The CIW's geophysical survey ship, Carnegie, became a floating atmospheric electricity observatory, following many of the approaches already well established at the land-based atmospheric electrical observatories central to this special issue (Aplin, 2020). The Carnegie's equipment provided an important series of measurements of the electric potential gradient1 (PG), on four worldwide cruises made between 1915 and 1929. Through these measurements, it was found that the PG in fair weather showed a daily variation linked to Universal Time, independent of the ship's location. This regular variation has even been referred to as a “heartbeat” of the global circuit (Benningfield, 2020), and historical aspects of it are explored further here. This diurnal variation is now known as the “Carnegie curve”, which was an important confirming idea in establishing the concept of the global atmospheric electric circuit (Aplin et al., 2008) and still provides a reference variation against which modern measurements are compared (Harrison, 2013). The discovery of the Carnegie curve provided a major contribution to resolving the fundamental question, which extends back to Benjamin Franklin, of why the Earth is negatively charged in fair weather.
During the intervening century, multiple descriptions of the Carnegie curve have emerged from secondary sources. Because of the Carnegie curve's central importance in fair weather atmospheric electricity, and the ever-increasing significance, for climate studies, of having reliable reference measurements against which subsequent changes can be evaluated, the different historical sources are investigated here.
2.1 Background
The Carnegie was a brigantine yacht launched in 1909, intended for geomagnetic survey work and constructed from nonmagnetic materials, mostly wood. The ship made seven cruises, the last of which ended catastrophically on 28 November 1929, with the loss of the ship and two deaths. The Carnegie was rapidly destroyed by fire in Apia harbour, following a petrol explosion, killing the Captain, James P. Ault, and a cabin boy, Tony Kelar.
Four of the Carnegie's major voyages, namely cruises IV (March 1915 to March 1917), V (December 1917 to June 1918), VI (October 1919 to November 1921), and VII (August 1928 to August 1929) carried atmospheric electricity measurement apparatus designed specifically by the CIW. Of the wide range of atmospheric electricity instruments carried, the PG data obtained have received the most attention. The Carnegie's air conductivity measurements, however, because of their close relationship with particulate pollution, have also been used for the evaluation of long-term change in oceanic air aerosol loading (Cobb and Wells, 1970).
After the completion of cruises IV, V, and VII, a preliminary analysis by CIW scientist Samuel J. Mauchly indicated a single maximum diurnal PG variation which was independent of the yacht's measurement position (Mauchly, 1921a, b). Further analysis (Mauchly, 1923a, b, 1926; Parkinson and Torreson, 1931) confirmed the initial findings, and Mauchly's obituary (Anonymous, 1929) recognises his major contribution to this discovery. Despite Mauchly's death, the Carnegie tragedy, and the death of the CIW's Department of Terrestrial Magnetism's founding director, Louis Bauer2 in 1932, the data from the final voyage (cruise VII), were ultimately demonstrated by Torreson et al. (1946) to show similar diurnal variations to those of the earlier cruises3.
2.2 Context
A long-standing and fundamental question in atmospheric electricity from the time of Benjamin Franklin (e.g. Canton, 1753) was explaining why, in fair weather conditions, an electric field is always present in the atmosphere. (The direction of the electric field implies a negative charge on the Earth's surface, and the question is therefore equivalently described as the problem of the maintenance of the Earth's negative charge). Drawing on physical reasoning and results from his many atmospheric measurements, Charles Thomas Rees Wilson4 (always known as “C. T. R.”) suggested that charge separation in shower clouds and thunderstorms, coupled through the conductive layers of the upper atmosphere, provided the explanation needed (Wilson, 1921). Wilson made his own measurements (see, for example, a recently identified picture of his experimental hut in Cambridge)5, which strongly influenced him, such as his first measurements of the vertical current in the atmosphere (Wilson, 1906). Referring to these measurements in reminiscences written shortly before he died, Wilson said the following:
I remember the satisfaction I had when my work led to the fulfilment of my dream of isolating a portion of the earth's surface and measuring the charge upon it and the current flowing into it from the atmosphere. (Wilson, 1960)
When receiving the Franklin Medal in 1929, Wilson expressed his idea of the distribution of electricity around the atmospheric system as follows:
I have long held that we must look to showers and thunderstorms as the main agents in the maintenance of the negative charge on the earth in fine weather regions; that they act as electric generators which remove positive electricity from the earth and supply it to the conducting upper atmosphere by which it is distributed over the whole earth. (Wilson, 1929)
Whilst Wilson's hypothesis was supported by estimates of approximately balanced current flow in the disturbed and fair weather regions, difficulties arose from the limited understanding of the charge structure in thunderstorms. Wilson's hypothesis required an upper positive thundercloud charge, as suggested from his measurements of corona currents beneath clouds and field changes after lightning. In contrast, after analysing many sets of measurements of raindrop charge at the surface, George (later Sir George) Simpson6 had concluded that the opposite case was more likely. The difficulty this caused in the direction of current flow for the Wilson hypothesis led Simpson to argue that new observational evidence would be needed to resolve the matter (Simpson, 1924).
2.3 Global circuit corroboration
Without conclusive data on the thunderstorm polarity, exploring the relationship between the daily variations of global thunderstorms and the PG offered a separate line of evidence for the connection suggested by Wilson. The absence of local solar influence on the daily variation in PG was already suspected through analysing surface measurements from the Arctic and Antarctic (Hoffman, 1923). Strong diurnal variability in equatorial thunderstorms as the possible cause of the PG variations in these and the early Carnegie data was suggested by Edward (later Sir Edward) Appleton (Appleton, 1924). This occurred at an evening meeting (“Discussion on ionisation in the atmosphere and its influence on propagation of wireless signals”) held at Imperial College, London, on 28 November 1924, where Appleton, Wilson, and Simpson contributed with other significant scientists working in closely related areas, namely Charles Chree, Robert Watson-Watt, Sydney Chapman, and William Eccles.
Further investigation of this possibility was facilitated by the significant undertaking of compiling global thunderstorm data by Charles Brooks (Brooks, 1925). The relationship with global thunderstorms was pursued by Francis Whipple7 navigating an interesting path within the disagreement between Simpson, his boss, and Wilson, a recent Nobel Prize winner (Williams, 2009). Using Brooks' data, Whipple (1929) concluded that there was a close similarity between the daily PG variations and the thunderstorm timing. However, in the discussion following Whipple's paper (Whipple, 1929), Simpson said that “…the problem of the maintenance of the Earth's negative charge is of such fundamental importance that every attempt to solve it is to be welcomed” but added that the agreement in phase between the curves presented was “… good but not perfect… and alone it does not mean much”.
Whipple persevered with this work and, following analysis of the diurnal variation of a thunderstorm-related quantity – the point discharge current – at Kew Observatory, made a direct comparison of the diurnal PG variation from the Carnegie and the diurnal variation in thunderstorm land area. In a landmark paper (Whipple and Scrase, 1936), plots of the diurnal variations of the two quantities were plotted immediately above each other with their time of day axes aligned8, strongly emphasising the consistency between them. At the end of their paper, Whipple and Scrase (1929) said the following:
The agreement between these diagrams confirms Appleton's explanation of the Hoffmann–Mauchly phenomena and provides support for Wilson's theory.
This recognised that the common diurnal cycle in PG variations found in polar regions by Karl Hoffman, and over the oceans by Mauchly from the Carnegie, could be interpreted as arising from thunderstorm variations as proposed by Appleton. Furthermore, the discovery of a similar single diurnal cycle in global thunderstorms and the PG provided strong corroborating evidence for the connection suggested by C. T. R. Wilson (Aplin et al., 2008).
Subsequently, Simpson became highly involved in obtaining the thunderstorm polarity data, which he had argued in 1924 was necessary, through experimental work at Kew Observatory using balloon-carried instruments released during thunderstorms. From 91 useable balloon measurements made between July 1933 and August 1939 by balloons carrying a recording detector suggested by Simpson and developed with Frederick Scrase – namely, the alti-electrograph – it was concluded that thunderclouds did have a positive upper charge and negative lower charge, as Wilson's theory required (Simpson, 1949).
The data values obtained during the Carnegie's cruises are fully tabulated in the reports published by the CIW. Because of the continual improvements in the instrumentation and techniques used, and their separation in time, data from the first three atmospheric electrical cruises (i.e. cruises IV, V, and VI; 1915–1921) have conventionally been considered separately from those from the final cruise (cruise VII; 1928–1929). cruises IV, V, and VI reported manual measurements whereas cruise VII employed an automatic recorder, and the absolute calibrations for the ship and its instruments were different (Harrison, 2013). Individual values from cruises IV, V, and VI were published in the Carnegie Institution of Washington's publication 175, volume V (hereafter CIW175), by Ault and Mauchly (1926), and from cruise VII in CIW publication 568 (hereafter CIW568) by Torreson et al. (1946). Both of these CIW publications were fully scanned in 2012 and are now available digitally9.
Table 1Annual harmonic coefficients from Carnegie PG data: relative variation.
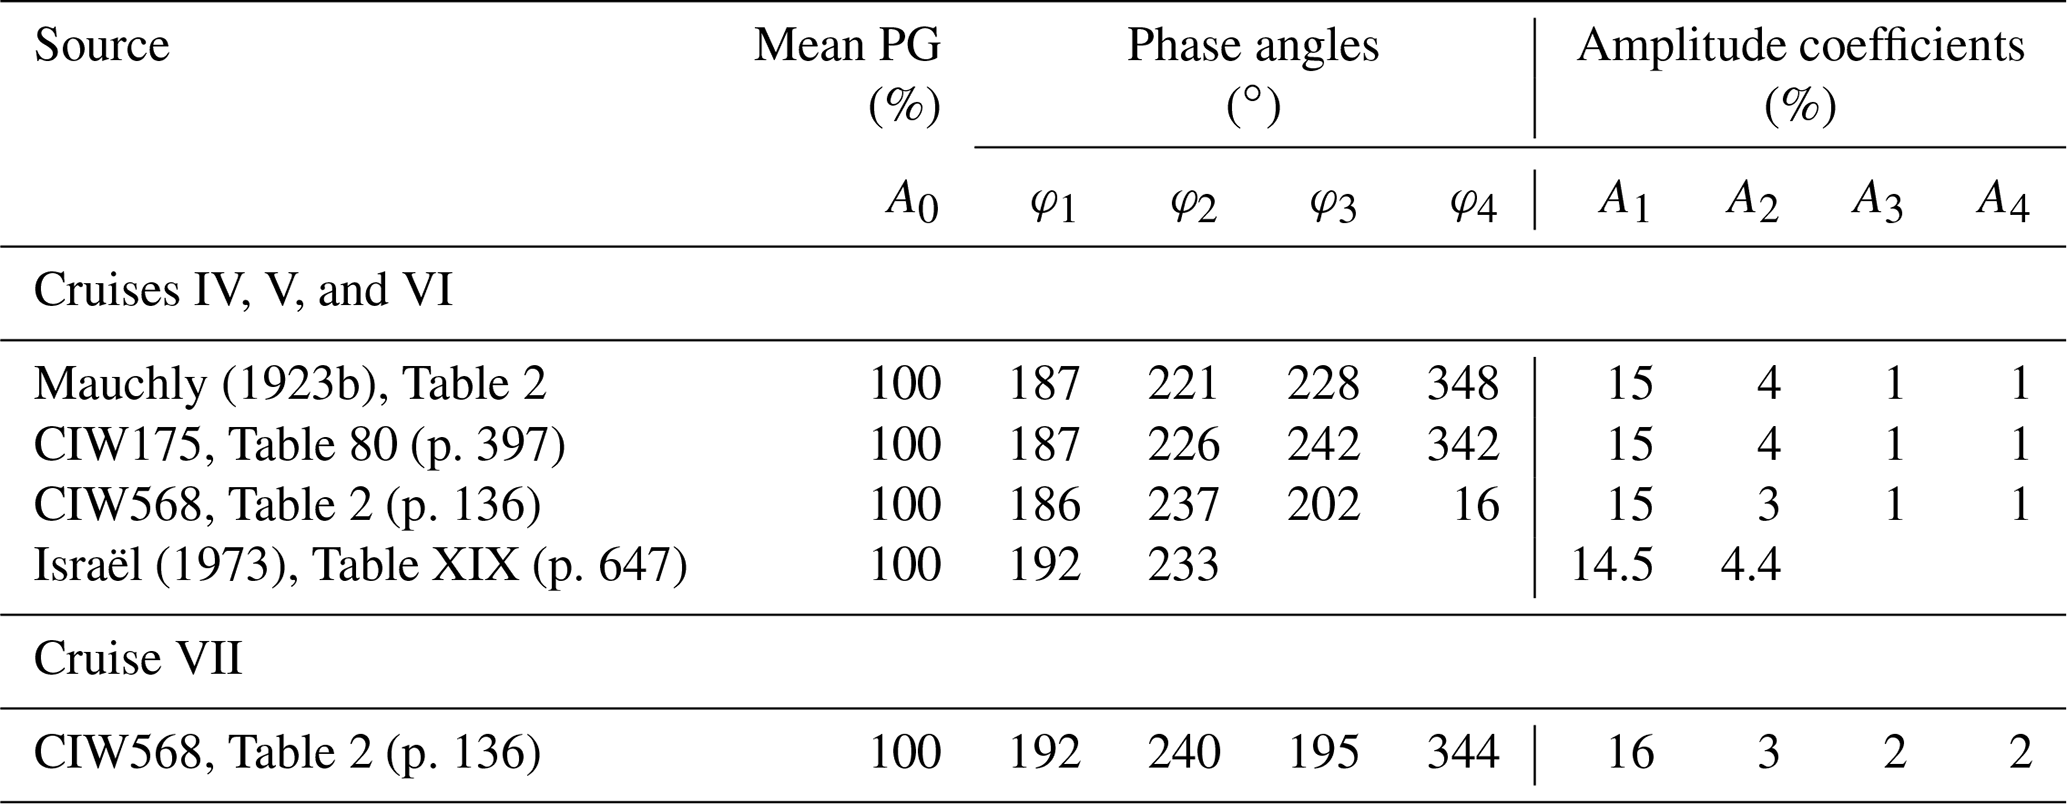
A Fourier series representation of the CIW data, which smooths the diurnal cycle of PG variation as a continuous function, has been of considerable importance in the enduring practical usefulness of the data. In the absence of the full data set and the ability to process it, the data reduction achieved by such an approach of harmonic fitting essentially provides the “Carnegie curve” in a useable form.
The functional form fitted by the CIW scientists was as follows:
where F is the PG at time t (for t in hours coordinated universal time – UTC). Here, A0 represents the mean PG, and A1 to A4 are the amplitudes of the 24, 12, 8, and 6 h harmonic contributions, respectively, with φ1 to φ4 their associated phase angles (in degrees). Different harmonic fits were generated for the earlier and later cruises, with the derived coefficients primarily provided in the two CIW publications. The later publication, CIW568, also provided updated versions of the coefficients originally presented in the earlier one (CIW175).
Prior to the wide availability facilitated through the CIW reports' recent digitisation, a frequently cited secondary source for the Carnegie curve was the textbook by Hans Israël10 (Israël, 1973). This included tabulated harmonic coefficients, hourly values of PG, and thunderstorm area in Reference Tables given at the end of volume 2. For example, Table XVIII of Israël (1973) lists Fourier coefficients for Eq. (1), for the earlier three cruises and the last cruise separately, divided into seasonal and annual versions. Additionally, Israël's Tables XIX and XX provide lists of hourly PG values and hourly thunderstorm areas, respectively, transcribed from Whipple and Scrase (1936). As remarked on previously (Harrison, 2013), the annual Fourier coefficients in Table XVIII of Israël (1973) differ slightly from the final values given for both sets of data in CIW568. These differences are now considered further.
After the three earlier atmospheric electricity cruises, Mauchly provided initial calculations of the harmonic terms (Mauchly, 1923a, b) because of the immediate importance of evaluating the ratio of the 24 and 12 h terms in demonstrating the dominance of the single diurnal oscillation. The coefficients were presented with an improved absolute calibration11 in CIW175 (Mauchly, 1926). The succession of coefficients generated by continuing progressing studies are summarised in Tables 1 and 2. Table 1 provides relative values (i.e. expressed as a percentage of the mean value), and Table 2 shows the absolute values.
Table 2 includes recalculations of the harmonic fits from the original hourly values. For cruise VII, this was carried out in Harrison (2013), and the same coefficients as presented originally in CIW568 were found. For the earlier cruises, recalculation of the coefficients has been made here using the original hourly values contained in CIW175. This confirms Mauchly's harmonic coefficients presented in CIW175.
Table 2Annual harmonic coefficients from Carnegie PG data: absolute variation.
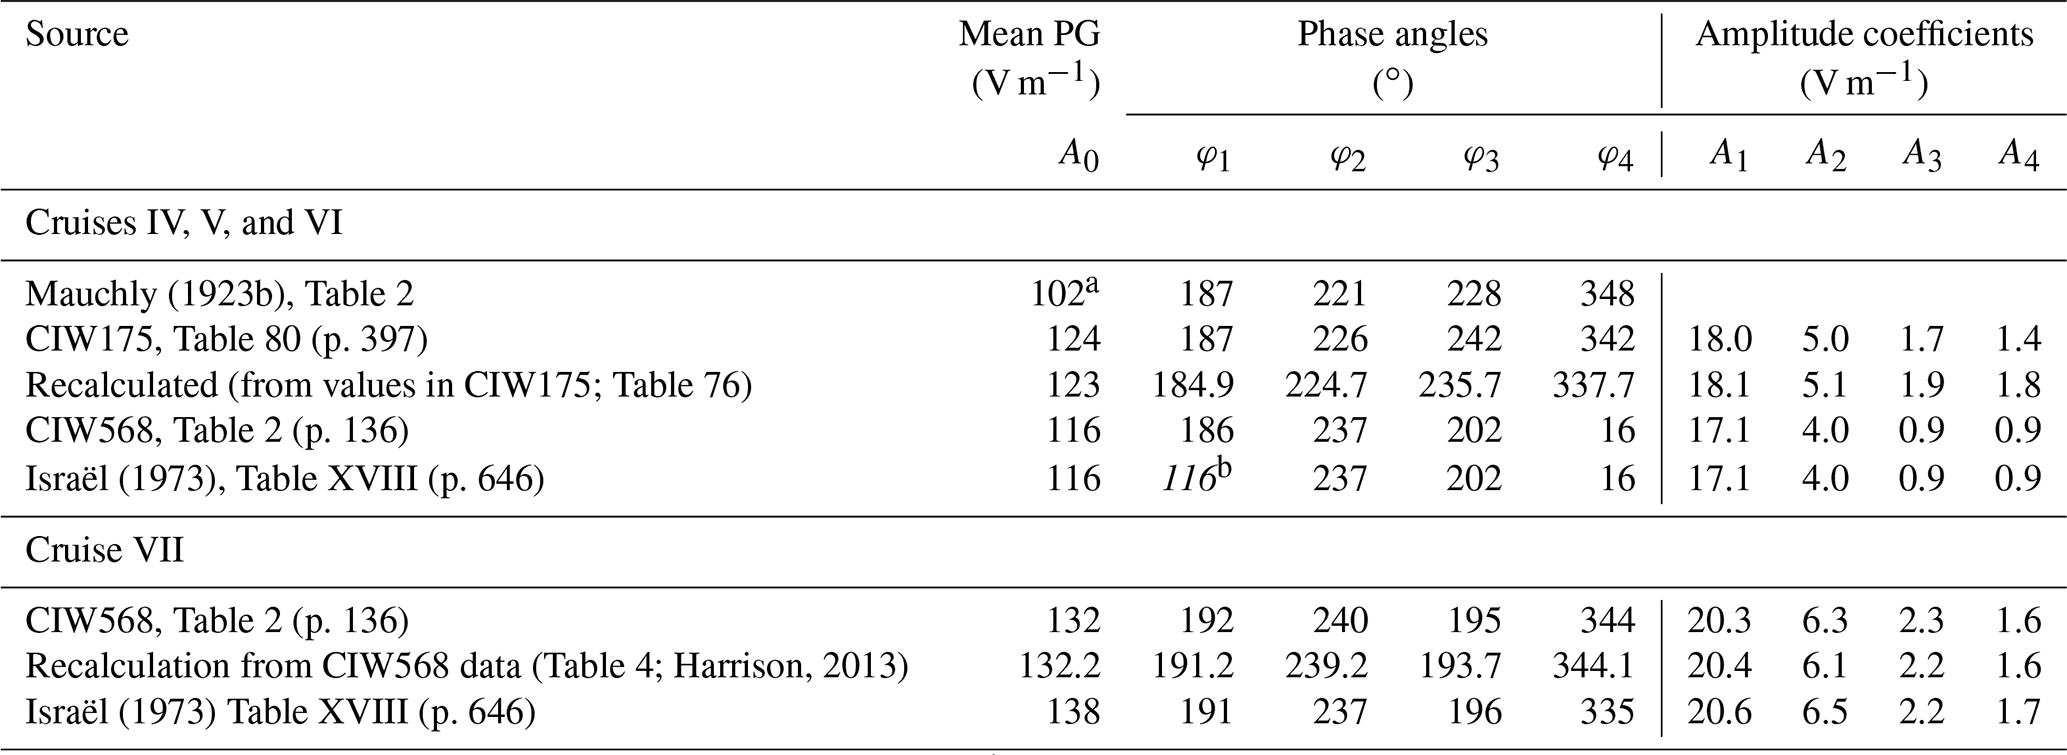
a Mauchly (1923b) noted that the absolute value should be increased by about 20 %. b This clearly anomalous φ1 value may have been incorrectly carried across from the A0 value.
A further set of updated values was provided in CIW56812, including a modification to the absolute calibration through a change in A0 from 124 to 116 V m−1. These final revised coefficients of CIW568 for the early cruises were copied into Table XVIII of Israël (1973), although, as evident in Table 2, with an anomalous value of φ1. The values for cruise VII in Israël's Table XVIII are also not entirely consistent with CIW568. The cruise VII A0 value given by Israël is 138 V m−1 compared to 132 V m−1, and φ4 differs between the two sources by 9∘ although it is the least of the harmonic terms in its proportional contribution (∼1 %).
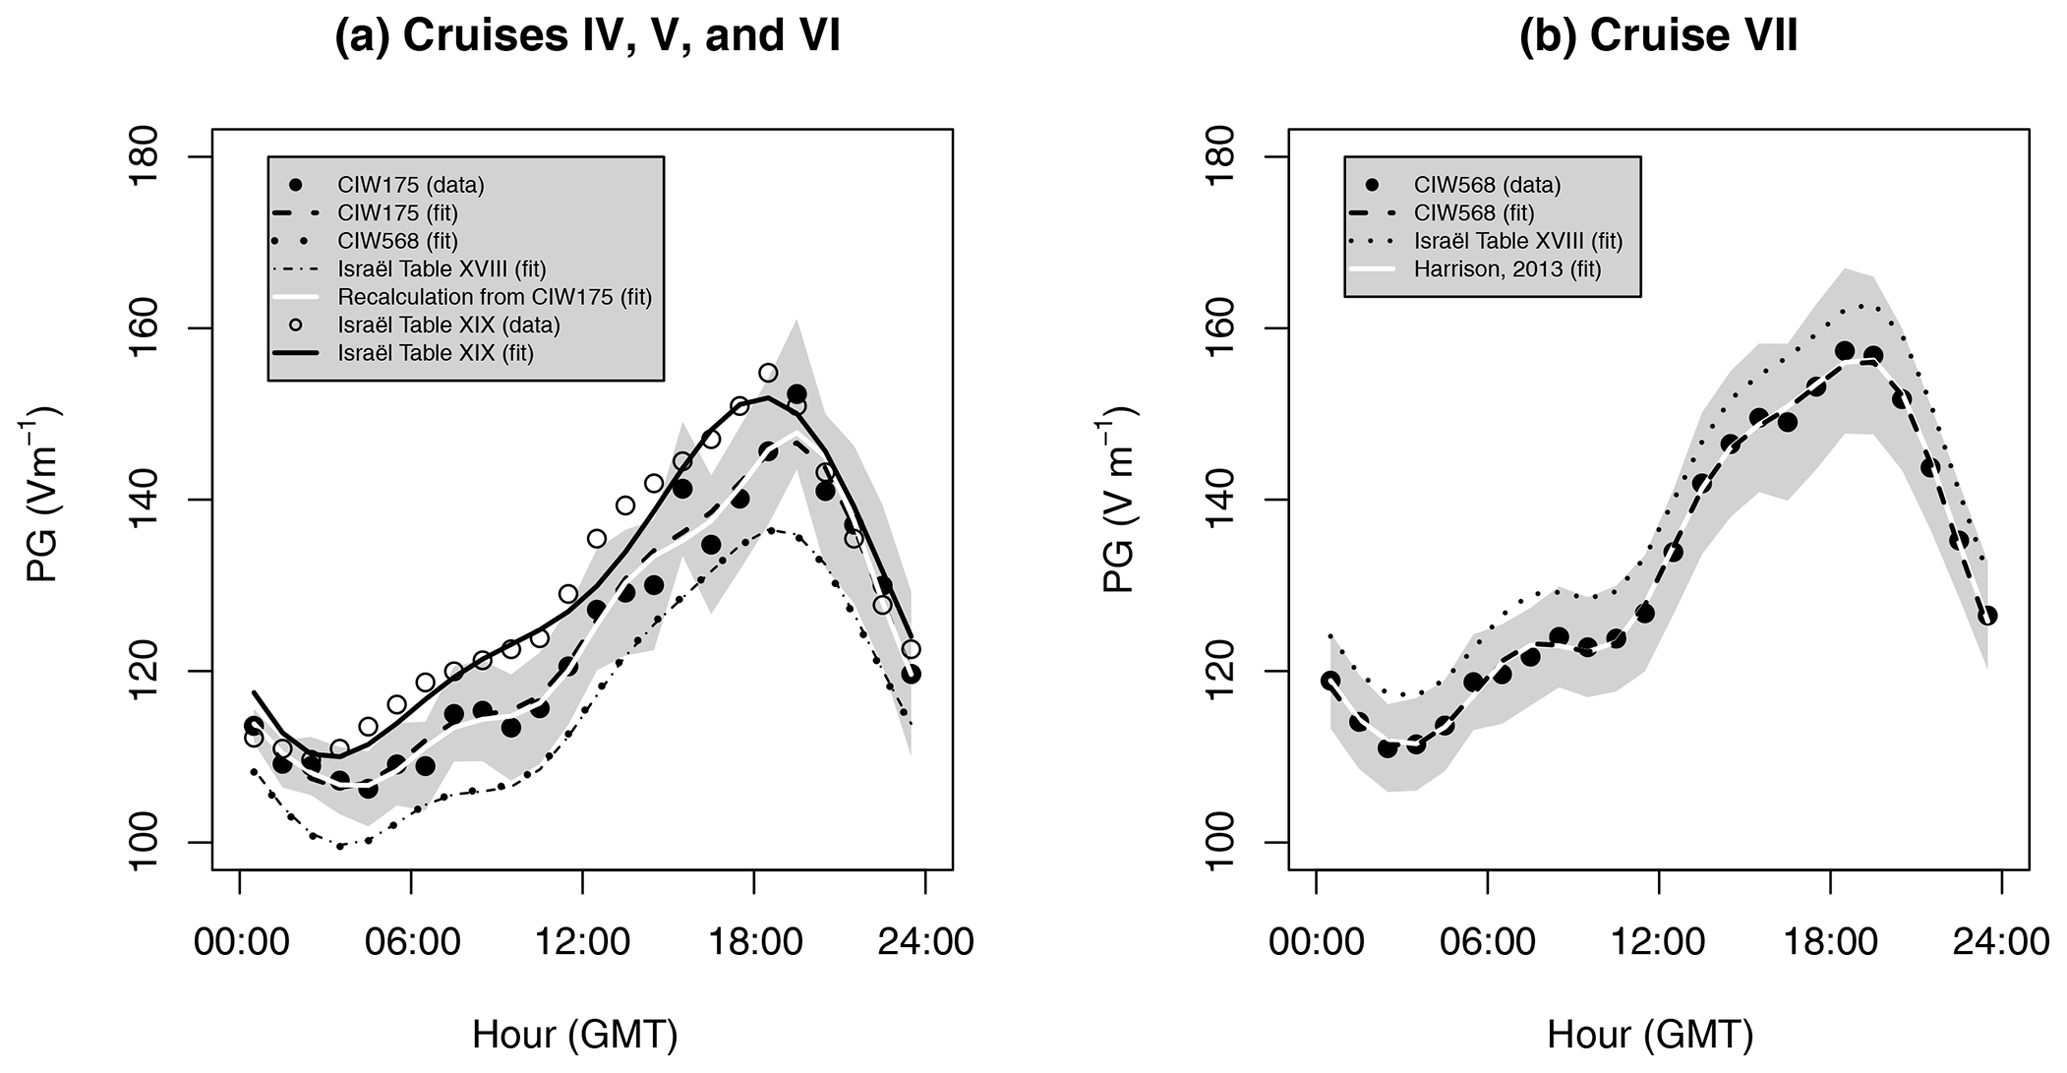
Figure 1Data from the Carnegie measurements of (a) cruises IV, V, and VI and (b) cruise VII as hourly mean values, with 95 % confidence limits shown as a grey band, for data from Carnegie Institution of Washington (CIW) publications 175 and 568. For each hourly value, the number of days of data used varies from 48–56 d (median 52 d) for (a) and is 82 d for (b). Different fits to the data are provided from CIW publications 175 and 568, Tables XVIII and XIX in the textbook of Hans Israël (Israël, 1973), and direct recalculation from the original CIW data. (For a, the φ1 coefficient of Israël's Table XVIII has been assumed to be 185∘).
In a later table, Table XIX, Israël (1973) provides hourly values of PG, cited from Whipple and Scrase (1936), and a further harmonic fit is given, but as this is used13 primarily to illustrate the significance of the 12 and 24 h terms, only the values for A1, A2, φ1, and φ2 are given which, as Table 1 shows, are consistent with those from the harmonic fit containing the further terms. However, the mean value A0 for this truncated harmonic fit is stated as 129 V m−1. It is possible that the values for this fit were read from the % variation of Fig. 9 of Whipple and Scrase (1936) with the hourly values calculated afterwards, but the origin of the A0 value used is unclear and does not correspond to the any of the other A0 values provided in Israël's Table XVIII14. In fact, the source for their plotted curve is not actually explicitly provided by Whipple and Scrase (1936), but, as Whipple (1929) cites CIW175, it seems very likely that the earlier cruises' measurements were used.
Taken together, it appears that none of the annual harmonic coefficient values in Table XVIII of Israël (1973) is entirely consistent with the original source which CIW568 represents; for the cruises IV, V, and VI data the φ1 value differs, and for the cruise VII data the A0 and φ4 values differ. Furthermore, the truncated two-term harmonic fit given in Israël's Table XIX introduces yet another value of A0 for the earlier cruises.
Figure 1 compares curves calculated from these disparate versions of the coefficients. In Fig. 1a, for the earlier cruises, curves are shown from the coefficients available from the initial (CIW175) and final (CIW568) analyses. Further curves have been generated from the coefficients of Israël's Table XVIII and Table XIX. The data values of CIW175 have also been re-averaged and the original CIW175 fit recalculated. An additional benefit of the recalculation is to generate the confidence range on the mean values, which has not previously been presented. Figure 1b shows curves calculated from the CIW568 coefficients for cruise VII, which were recalculated by Harrison (2013) from the original data, with good agreement. The curve from the coefficients of Israël's Table XVIII differs, however, due to the changed value of A0 from that of CIW568.
The “Carnegie curve” is now a well-known feature of the global atmospheric electric circuit, although, as this analysis shows, there has been some variation in its quantitative presentation. In part, this is likely to have arisen from the considerable international interest in the shape of the curve, requiring immediate distribution of the relative values (Table 1), whilst the absolute values from the Carnegie's earlier cruises emerged in stages as the calibrations improved (Table 2). The values from the last cruise, benefitting from improvements made steadily through the sequence of cruises and automatic recording technology, are likely to be the most reliable in absolute terms. However, the data from the earlier cruises shaped the major discussions of the 1920s, which culminated in the highly influential Fig. 9 of Whipple and Scrase (1936), and hence retain their own importance too.
Prior to the modern practice of electronic transfer of large data sets and analysis at the computers of each investigator, the exchange of summarising coefficients and/or transcribing data values from published graphs was a primary method of communicating quantitative results. The circulation of similar, but not identical, sets of data values of unknown heritage makes it unsurprising that inaccuracies and inconsistencies arose. It should also not be overlooked that the original data itself provided a range of values rather than just a single mean value, as demonstrated in Fig. 1a and b by the new calculations of confidence limits from the original data. With that perspective, many of the alternative descriptions of the Carnegie data available are not necessarily wholly at odds with the original data. Much as returning to the primary original data is always of central importance historically, minor anomalies in the secondary sources may not be inconsistent with the primary sources if the statistical variability is considered. This does not diminish the importance of the primary sources, which are still needed to provide the statistical context.
Overall, this work demonstrates that there are several representations of the harmonic coefficients describing the daily variation of the PG which have had, or have, some claim to be regarded as the Carnegie curve. However, as Fig. 1b shows, there is least disagreement if considerations are restricted to the data from cruise VII. This version of the Carnegie curve is well summarised by the original harmonic coefficients of CIW568 (and in Table 2) and was documented so effectively by the Carnegie scientists that it can be exactly regenerated from the original data (Harrison, 2013).
The data sources are public and access to them is described in the text, given specifically in the first columns of Tables 1 and 2 and in footnote 9.
The author declares that there is no conflict of interest.
This article is part of the special issue “Atmospheric electrical observatories”. It is not associated with a conference.
I am grateful to Shaun Hardy, librarian at the Carnegie Institution for Science, for encouragement and permission to reuse material.
This paper was edited by Kristian Schlegel and reviewed by two anonymous referees.
Anonymous: Dr S.J. Mauchly, Nature 123, 215, https://doi.org/10.1038/123215a0, 1929.
Aplin, K. L.: Introduction to the special issue “Atmospheric electrical observatories”, Hist. Geo Space. Sci., 11, 137–138, https://doi.org/10.5194/hgss-11-137-2020, 2020.
Aplin, K. L., Harrison, R. G., and Rycroft, M. J.: Investigating Earth's atmospheric electricity: a role model for planetary studies, Space Sci. Rev., 137, 11–27, https://doi.org/10.1007/s11214-008-9372-x, 2008.
Appleton, E. V.: Replies to the General Discussion, Proc. Phys. Soc. London, 37, 49D, https://doi.org/10.1088/1478-7814/37/1/317, 1924.
Ault, J. P. and Mauchly, S. J.: Atmospheric electric results obtained aboard the Carnegie, 1915–1921, in: Ocean magnetic and electric observations, 1915–1921, Researches of the Department of Terrestrial Magnetism, Carnegie Institution of Washington Publication 175, 5, Carnegie Institution of Washington, January 1926, 195–285, 1926.
Benningfield, D.: Studying Earth's double electrical heartbeat, EOS T. Am. Geophys. Un., 101, https://doi.org/10.1029/2020EO143519, 2020.
Brooks, C. E. P.: The distribution of thunderstorms over the globe, London, Geophys. Mem. Met. Off., 24, His Majesty's Stationery Office, London, 1925.
Canton, J.: Electrical experiments, with an attempt to account for their several phaenomena; together with some observations on thunder-clouds, Philos. T. R. Soc. Lond., 48, 350–358, https://doi.org/10.1098/rstl.1753.0053, 1753.
Cobb, W. E. and Wells, H. J.: The electrical conductivity of oceanic air and its correlation to global atmospheric pollution, J. Atmos. Sci., 27, 814–817, https://doi.org/10.1175/1520-0469(1970)027<0814:TECOOA>2.0.CO;2, 1970.
Dolezalek, H.: Obituary of Hans Israël, Pure Appl. Geophys., 100, 5–7, https://doi.org/10.1007/BF00880223, 1972.
Harrison, R. G.: The cloud chamber and CTR Wilson's legacy to atmospheric science, Weather, 66, 276–279, https://doi.org/10.1002/wea.830, 2011.
Harrison, R. G.: The Carnegie Curve, Surv. Geophys., 34, 209–232, https://doi.org/10.1007/s10712-012-9210-2, 2013.
Hoffmann, K.: Bericht über die in Ebeltofthafen auf Spitzbergen in den Jahren 1913–14 durchgeführten luftelectrishchen Messungen, Beitr. Phys. frei. Atmos., 11, 1–19, 1923.
Israël, H.: Atmospheric electricity (Vol. 2, Fields, charges, currents, Problems of cosmic physics 29), Israel Program for Scientific Translations, Jerusalem, 1973.
Mauchly, S. J.: Recent results derived from the diurnal variation observations of the atmospheric electric potential gradient on board the Carnegie, EOS T. Am. Geophys. Un., 2, 73–77, 1921a.
Mauchly, S. J.: Note on the diurnal variation of the atmospheric electric potential gradient, Am. Phys. Rev., 18, 161–162, 1921b.
Mauchly, S. J.: On the diurnal variation of the potential gradient of atmospheric electricity, EOS T. Am. Geophys. Un., 4, 131–135, 1923a.
Mauchly, S. J.: On the diurnal variation of the potential gradient of atmospheric electricity, Terr. Magn. Atm. Elect., 28, 61–81, 1923b.
Mauchly, S. J.: Studies in atmospheric electricity based on observations made on the Carnegie, 1915–1921, in: Ocean magnetic and electric observations, 1915–1921, Researches of the Department of Terrestrial Magnetism, Carnegie Institution of Washington Publication 175, 5, 385–423, 1926.
Parkinson, W. C. and Torreson, O. W.: The diurnal variation of the electric potential of the atmosphere over the oceans, UGGI (Sect. Terr. Magn. Atmos. Elect.) Bulletin, 8, 340–345, 1931.
Simpson, G. C.: General discussion, P. Phys. Soc. Lond., 37, 46D, https://doi.org/10.1088/1478-7814/37/1/316, 1924.
Simpson, G. C.: Atmospheric electricity during the last 50 years – Part 2 Wilson's theory of the normal electric field, Weather, 5, 135–140, 1949.
Torreson, O. W., Parkinson, W. C., Gish, O. H., and Wait, G. R.: Ocean atmospheric-electric results (Scientific Results of Cruise VII of the Carnegie during 1928–1929 under command of Captain J.P. Ault, Vol. 3), Researches of the Department of Terrestrial Magnetism, Carnegie Institution of Washington Publication 568, Washington DC, 1946.
Whipple, F. J. W.: On the association of the diurnal variation of electric potential gradient in fine weather with the distribution of thunderstorms over the globe, Q. J. Roy. Meteor. Soc., 55, 1–18, 1929.
Whipple, F. J. W. and Scrase, F. J.: Point discharge in the electric field of the Earth, Geophys. Mem. Met. Off., 68 His Majesty's Stationery Office, London, available at: https://digital.nmla.metoffice.gov.uk/download/file/IO_efb7fd62-a542-4266-aac6-cbdeae3311b6 (last access: 9 September 2020), 1936.
Williams, E. R.: C.T.R. Wilson versus G.C. Simpson: fifty years of controversy in atmospheric electricity, Atmos. Res., 91, 259–271, 2009.
Wilson, C. T. R.: On the measurement of the earth-air current and on the origin of atmospheric electricity, P. Camb. Philos. Soc., 13, 363–382, 1906.
Wilson, C. T. R.: Investigations on lightning discharges and on the electric field of thunderstorms, Philos. T. R. Soc. S.-A, 221, 73–115, https://doi.org/10.1098/rsta.1921.0003, 1921.
Wilson, C. T. R.: Some thundercloud problems, J. Franklin Inst., 208, 1–12, https://doi.org/10.1016/S0016-0032(29)90935-2, 1929.
Wilson, C. T. R.: Reminiscences of my early years, Notes Rec. Roy. Soc., 14, 2, 163–173, https://doi.org/10.1098/rsnr.1960.0029, 1960.
The atmospheric electric potential gradient (PG) is the difference in voltage between two points separated vertically by 1 m; i.e. having the magnitude of the vertical electric field but opposite sign. Near the surface, the voltage difference is measured between a point 1 m above the surface and the surface itself.
Louis Agricola Bauer (1865–1932); international geophysicist and founder of Terrestrial Magnetism and Atmospheric Electricity (now Journal of Geophysical Research) and director of the Carnegie Institution's Department of Terrestrial Magnetism from 1904.
CIW publication 568 (hereafter CIW568); Fig. 1, p. 163.
Charles Thomas Rees Wilson (1869–1958). Atmospheric physicist and Jacksonian Professor at the University of Cambridge (1925–1935). Nobel Prize winner in 1927. See also Harrison (2011).
https://cudl.lib.cam.ac.uk/view/PH-CAVENDISH-P-01728/1, last access: 9 September 2020
George Clarke Simpson (1878–1965), meteorologist to Robert Falcon Scott's Tera Nova Expedition and director of the Meteorological Office, 1920–1938. Knighted in 1935. Returned to work after retirement, initially through volunteering for war service, as director at Kew Observatory, 1939–1947.
Francis John Welsh Whipple (1876–1943), meteorologist and superintendent of Kew Observatory (1925–1939). President of the Royal Meteorological Society, 1936–1937.
Figure 9 of Whipple and Scrase (1936).
CIW175 (Ault and Mauchly, 1926) is available at http://archive.org/details/oceanmagneticele00carn and CIW568 (Torreson et al., 1946) at https://archive.org/details/oceanatmospheric00carn (last access: 9 September 2020)
Hans Israël (1902–1970), a researcher in atmospheric electricity and geophysical radioactivity working at Potsdam, Bad Nauheim, Bachau am Federsee, and Tübingen. Variously was the director of Buchau and Aachen Observatories and the Aachen Institute of Geophysics and Meteorology (see Dolezalek, 1972).
The absolute value of the PG on the ship was found by deriving a “reduction factor”, by comparing the ship's PG measurement, distorted by the position of the sails and the masts, with the PG obtained simultaneously at a flat and undisturbed site.
These are described (CIW568, p. 136) as “…finally revised values…”, correcting the values published in CIW175.
Figure 334, p. 649, in Israël (1973).
It seems possible that this A0 was chosen to be approximately midway between the earlier cruises (A0=116 V m−1) and the later cruise (A0=138 V m−1), although their mean value would be 127 V m−1.
Carnegie curvehelped answer a fundamental question, from the time of Benjamin Franklin, about the origin of Earth's negative charge. The Carnegie curve still provides an importance reference variation, and the original data, explored further here, have new relevance to geophysical change.