the Creative Commons Attribution 4.0 License.
the Creative Commons Attribution 4.0 License.
The early history of the Jicamarca Radio Observatory and the incoherent scatter technique
Ronald F. Woodman
Donald T. Farley
Ben B. Balsley
The purpose of these historical notes is to present the early history of the Jicamarca Radio Observatory (JRO), a research facility that has been conducting observations and studies of the equatorial ionosphere for more than 50 years. We have limited the scope of these notes to the period of the construction of the observatory and roughly the first decade of its operation. Specifically, this period corresponds to the directorships under Kenneth Bowles, Donald Farley, and Tor Hagfors and the first period of Ronald Woodman, i.e., the years between 1960 and 1974. Within this time frame, we will emphasize observational and instrumental developments which led to define the capabilities of the Jicamarca incoherent scatter (IS) radar to measure the different physical parameters of the ionosphere. At the same time, we partially cover the early history of the IS technique which has been used by many other observatories built since. We will also briefly mention the observatory's early and most important contributions to our understanding of the physical mechanisms behind the many peculiar phenomena that occur at the magnetic Equator. Finally, we will put special emphasis on the important developments of the instrument and its observing techniques that frame the capabilities of the radar at that time.
- Article
(14150 KB) - Full-text XML
- BibTeX
- EndNote
In 1957, the Soviet Union had launched Sputnik (Fig. 1) and with it the beginning of the Space Age (e.g., Tikhonravov, 1994). At the beginning, satellites like Sputnik, the US Explorer, and others to follow were dedicated to studying the region of Earth space where they were flying: the ionosphere, a region of the upper atmosphere, which was used to propagate and reflect radio signals beyond the horizon. In those days, radio broadcasting and radio communication were much more important than it is today. Since the ionosphere can reflect radio waves, there was a need to properly characterize its properties. Today, especially for young people, satellites mean broadband communications, including TV broadcasting of sporting events, remote sensors, meteorological maps, GPS navigation, and men in space, all of which are applications that would not have been possible if we did not know the characteristics of the environment where they fly. The study of the ionosphere, fortunately, was the most important function of the early satellites (and it is still the function of some of the current ones).
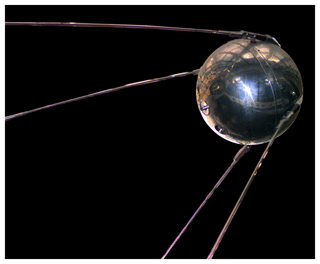
Figure 1A replica of Sputnik 1 at the US National Air and Space Museum. Sputnik 1 was launched by the Soviet Union on 4 October 1957.
One year after the launching of Sputnik, a US scientist, Bill Gordon (1918–2010; see Fig. 2a), a professor at Cornell University, proposed, in a paper published in the Proceedings of the IRE (Gordon, 1958), that the most important characteristics of the free-electron gas that conformed the ionosphere could be measured from the ground, competing in this way with the measurements that were performed by satellites. The technique was based on the scattering of radio waves by free electrons, i.e., by those electrons that were detached from the few atoms that constitute the atmosphere at these altitudes. If they were to be “illuminated” from the ground by a strong beam of radio waves, Gordon proposed, a small part of the energy would be scattered in all directions, including those going back to Earth. Thus, if one built a very powerful radar, with a powerful transmitter and a large antenna, one could get echoes from these electrons in the same way that a radar obtains an echo from an airplane. The larger the number of electrons in the radar beam, the larger the power received. Furthermore, the moving electrons would impose a shift in the transmitter frequency by the well-known Doppler effect. By measuring the power of the return, one could determine the number of electrons contributing to the echo, and, by measuring the spread of frequency shifts imposed by the different velocities of the different electrons, one could measure their velocity distribution and hence the temperature of the electron gas. The technique described is now known as the incoherent scatter technique, since it is based on the scattering of electromagnetic waves by electrons, as discovered by Joseph J. Thomson (1856–1940) about half a century before; it has also been described as the Thomson scattering technique.
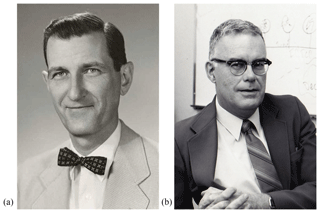
Figure 2(a) William E. Gordon (1918–2010), physicist and astronomer. He proposed the incoherent scatter technique in 1958. (b) Kenneth L. Bowles (1929–2018), electrical engineer and computer scientist. He conducted successfully the first incoherent scatter radar observations in the same year the theory was proposed.
At the same time as William E. Gordon's efforts to publish and promote his idea, Ken Bowles (1929–2018; see Fig. 2b), a former student at Cornell and scientist of the Central Radio Propagation Laboratory of the National Bureau of Standards (NBS), was gathering support to experimentally obtain echoes from the ionospheric electrons using the technique. He learned about the existence of a powerful 41 MHz transmitter at a NBS facility at Long Branch, Illinois. He quickly designed and built a 1024-dipole array antenna for this transmitter and published his first experimental results (see Fig. 3) in a paper in the Physical Review Letters in December 1958 (Bowles, 1958). A crucial finding in these first incoherent scatter (IS) radar observations was that the bandwidth of the echo signals was much smaller than expected; Doppler broadening was more of the order of the ion thermal velocities than of the order of the electron ones.
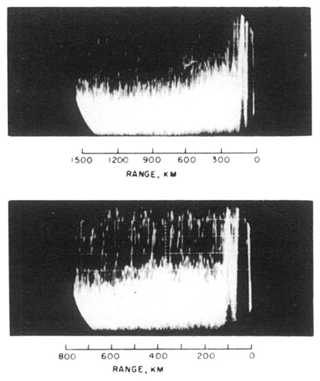
Figure 3First incoherent scatter radar measurements conducted in October 1958 (adapted from Bowles, 1958). The top panel corresponds to power measurements obtained using a pulse width of 140 µs (21 km) and a bandwidth of 10 kHz. In the bottom panel, the measurements were obtained using a pulse width of 120 µs (18 km) and a bandwidth of 15 kHz.
The fact that the bandwidth of the IS signals was controlled by the ions implied new possibilities for the technique. One could determine the ion composition of the ionized gas in the ionosphere, since different ion weights would produce different bandwidths. Moreover, since the ions in the magnetic field of the Earth gyrate around the field lines, and different ions gyrate with different periods, one should be able to detect the periodicity of the gyrations in the autocorrelation of the IS signals and thereby determine the ion composition with high accuracy (Bowles, 1959). This was an important hypothesis and led to the selection of the site of what eventually became the Jicamarca Radio Observatory, since in order to detect these periodicities in the IS signals, the radar needed to be pointed in a direction close to perpendicular to the magnetic field lines. The most economical way to achieve this was to build an antenna at the magnetic Equator that rested flat on the ground. At any other latitude this geometrical constraint would require a much more expensive tilted structure. All of these ideas were put by Bowles into a proposal to the NBS in August 1959 to build a radar close to the magnetic Equator. The proposal had two alternatives with different power levels. The most ambitious one was approved. It consisted of a 5 MW–50 MHz transmitter and a huge antenna composed of 18 432 half-wave dipoles, with a collecting area of close to 90 000 m2 (300 m×300 m). The cost of the project was about USD 1 000 000 in those years.
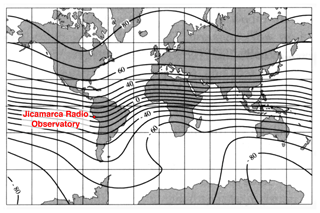
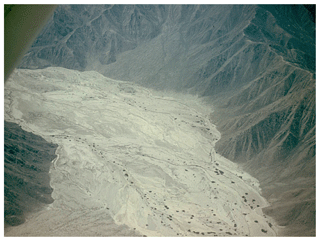
Having decided to build the radar at the magnetic Equator, the next decision to make was where. Bowles had been in Peru during the IGY (International Geophysical Year), in 1957, with a trans-equatorial radio propagation experiment (Bowles and Cohen, 1960) and had close contact with the Instituto Geofísico del Perú (IGP) and its directors, Alberto Giesecke (1918–2016) and Mateo Casaverde (1920–2016). This successful experience and the fact that the magnetic Equator was close to Lima (see Fig. 4) – with good logistic support, good housing, and schools for the US scientists and their families and an international airport and harbor (Callao) nearby – led Bowles to decide to build the facility in its vicinity. The site chosen was about 25 km northeast of the center of Lima, in an unpopulated dry quebrada that gave the name to the observatory, the Quebrada of Jicamarca. The selected site was surrounded by hills that provided an additional shield from any man-made interference that could come from the city and vice versa (see Fig. 5 for a picture of the site before construction).
The purpose of these historical notes is to tell the early history of the Jicamarca Radio Observatory (JRO) that has been conducting observations and studies of the equatorial ionosphere for more than 50 years. The scope of these notes is roughly the first decade of its existence. It is the period in which most of the authors had the privilege to experience direct contact with the observatory, which could easily have been lost if we were to delay our testimonies. Specifically, we cover the period under the directorships of Ken Bowles (1960–1963), Don Farley (1964–1967), and Tor Hagfors (1967–1969) and the first period of the directorship of Ron Woodman (1969–1974). For the first few years of the 1960s, we relied heavily on Ken Bowles' reports to the National Bureau of Standards, a sequence of internal publications not easily available today (see Bowles, 1961a, b, 1963b). Within this time frame, from 1960 to 1974, we will emphasize observational and instrumental developments which led to the formation of Jicamarca capabilities to measure the different state parameters of the ionosphere. By doing so, we also partially cover the early history of the incoherent scatter technique used by many other observatories built since. We will also briefly mention the early and most important contributions of the observatory to our understanding of the physical mechanisms behind the many peculiar phenomena that occur at the magnetic Equator. This is certainly not a review paper of all the scientific and technical contributions of the observatory. More than 700 papers in prestigious scientific journals were published during its first 50 years. Just enumerating the titles of these would take as many pages as these notes. Nevertheless, we will cite those publications that are related to the important developments of the instrument and its observing techniques. We leave the more recent developments and scientific contributions to a future publication, which will complement the full history of the observatory (many more years in comparison).
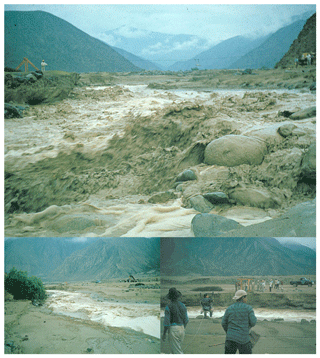
By August 1960, Ken Bowles had arrived in Lima, accompanied by Gerry Ochs, John Green, and Glen Miller, to start the project. Gerry Ochs and Glen Miller were to be in charge of the antenna construction, and John Green was to be in charge of the powerful transmitter. Bob Cohen came later to contribute to the scientific issues of the project, but he also helped Ken Bowles earlier with the selection of the site. For the processing electronics, Ken Bowles had the assistance of Ben Balsley, who arrived a few months later. Ben Balsley and Bob Cohen had worked with Ken Bowles earlier in Peru during the IGY propagation experiment. Construction started with heavy Earth-moving activities in October 1960, just about a year after the incoherent scatter idea matured and was formally proposed for financial support, an example used today to compare how quickly some ambitious scientific projects progressed in the past versus the time they take today. From the very beginning, the project utilized the help of Peruvian engineers and technicians, hired by the Instituto Geofísico del Perú to support the US personnel with the project: Hector Cabada, Douglas Llense, Jorge Ghersi, Max Távara, Herbert Gholler, Antonio Arévalo, Gerardo Vera, and two young recently graduated engineers, Jorge Heraud and Carlos Romero. At its peak of activity, the project additionally employed close to 200 Peruvian workers, out of which about a dozen stayed with the project and later became, with additional training, key technicians in the operation and maintenance of the observatory, an interesting social aspect of its history. It is of interest to note that the site selected was a relatively flat area of alluvial dry mud sediment, criss-crossed with natural drainage ditches as shown in the aerial picture of Fig. 5. Huge boulders, buried in the hard pan, were evidence that the area had been exposed to mud flash floods. In fact, elderly locals had mentioned that mud flash floods, called “huaycos” in Peru, had occurred in the past but infrequently (every 25 years or so). The years mentioned were 1912 and 1925, which were well known along the Peruvian coast for unusual torrential rains and which we know now correspond to strong events of El Niño. As a precaution, along with the heavy Earth-moving required to flatten the antenna area, a diversion dam, 10 m wide at its base and 4 m high, was built to protect the people and equipment at the site. It turned out that the building of the dam was not an exaggerated precaution; during the first rainy season that followed its construction, six huaycos occurred. On two occasions these prevented 80 people working on the project from going back home at the end of the day (see Fig. 6).
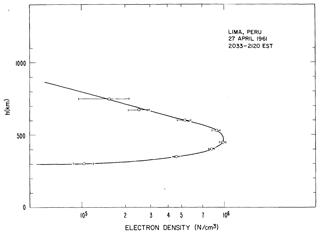
Progress with the construction of the gigantic antenna, and the relatively large building required to house the powerful transmitter, continued in parallel with efforts to obtain the first scientific results. At the end of April 1961, the first incoherent scatter echoes were obtained and recorded, using one-eighth of the final antenna and a modified Collins transmitter that had been left in Peru, by Ken Bowles himself, at the end of his IGY trans-equatorial radio propagation project. One of the first successful electron density profile measurements is shown in Fig. 7. Echoes were obtained to altitudes close to 1000 km. The results showed experimentally, for the first time at equatorial latitudes, the exponential decay of the electron density above the F-region peak (Bowles, 1961a). It came as a surprise that the exponential slope varied so much from day to day and with the time of day. The profiles also showed the very low density, less than 1000 electrons cm−3, existing during the early hours of the night at altitudes between the F and the E region (250 km altitude). Most importantly, it showed the world that the project was on the road to success even before it was finished.
In what follows, we will ignore for the moment the scientific experiments that were carried out simultaneously, as the construction of the radar progressed, and concentrate first on the overall construction activities of the project, divided into four lines of construction: the antenna, the central building, the powerful transmitter, and the receiving and processing electronics. We will describe later the scientific achievements.
We have already mentioned that by April 1961, one-eighth of the antenna was completed, confirming that the design was satisfactory. By then, the area for the full antenna had been flattened. By June of the same year, half of the antenna was completed. The second half was finished with a golden anodized dipole officially and with a celebration that took place on 27 April 1962 (see Fig. 8). It was the last of 18 432 dipoles mounted on 9216 wooden poles (pine imported from Oregon in the US). As an anecdote, the golden dipole was stolen several times until it was finally replaced with an ordinary aluminum dipole. Half of the dipoles were oriented (polarized) in the NW–SE direction, and the other half were oriented orthogonally in the NE–SW direction.
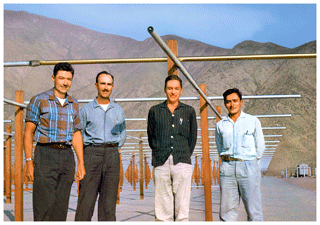
Figure 8Installation of the last ceremonial golden array element in April 1962. In the picture are Gerard Ochs, Hector Cabada, Gerardo Vera, and Antonio Arévalo (picture provided by Gerry Ochs).
The whole antenna was divided into 64 square modules. Each module, consisting of 288 dipoles, was cleverly connected internally so that all of the linearly polarized set of 144 dipoles were in phase. Relative phasing between the modules and/or the two linearly polarized sets could be changed by changing cable lengths at the center of the modules (e.g., Ochs, 1965). This was a tedious process but allowed the beam to be steered slightly (∼3∘ in the N–S and E–W directions). The combined signals, for both transmission and reception, came into the main building in eight separate 6 in. coaxial lines, corresponding to eight sub-antennas, and two for each quarter, corresponding to the two linear polarizations but allowing any other polarization to be synthesized by properly phasing their excitation. Dipoles and transmission lines were made with aluminum irrigation pipes, manufactured locally. The antenna, when finished, had the largest collecting area in the world (see Fig. 9).
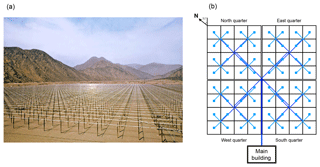
Figure 9(a) A picture of the main antenna array at JRO, which is one of the largest antennas in the world (picture taken by Ken Bowles). (b) A diagram of the antenna connections. The main array is divided into quarters, and each of them is composed of 16 antenna modules, making a total of 64 modules.
The 5 MW (peak power), 50 MHz transmitter consisted of two main parts: a power supply and plate modulator and the 50 MHz power amplifier itself. The first was designed around the power supply and plate modulator of a surplus 400 MHz, 10 MW Air Force radar, an AN/FPT2. The design for the second part, the amplifier itself, which was compatible with the AN/FPT2 power supply, was based on an existing design made in the Physics Department of Yale University. The required parts were manufactured in Boulder, partly by contract and mainly in the shops of the NBS. The design consisted of four identical sub-units, built around a Radio Corporation of America (RCA) triode: model 6949, the most powerful triode in the world, which is capable of delivering, continuously, 1.25 MW each and can certainly deliver that much in peak power in a pulsed radar mode (limited to 5 % duty cycle at Jicamarca because of power supply limitations). The approval for the transfer of the AN/FPT2 surplus parts from Hampton Roads, Virginia, came early in the project. The selection of the parts was made by John Green and Ben Balsley in September 1960, but the parts did not arrive in Callao until December of the same year, and not without incident: the main 20 MW pulse transformer, weighing several tons and costing USD 80 000 (USD 1960), fell back into the hold of the ship and was ruined as it was being unloaded because of improper handling (Bowles, 1961a). Replacement did not take long, fortunately; by March 1961, a replacement unit was delivered to the site (Bowles, 1961b). The manufactured parts for the 50 MHz transmitter came to the site in October 1961, and one of the four sub-units was assembled and placed in operation a couple of months later but without the plate modulation. It was permanently connected, instead, to the high-voltage DC supply (20 kV). It would not deliver quite as much power as the intended plate modulated design, but it was a much simpler solution to implement. The original worry that a permanent connection would produce undesired noise while the radar was in the receive mode turned out to be unimportant as long as the transmit–receive switches and the hybrid combiners used to connect the transmitter with the antenna were properly calibrated. The three other sub-units were connected the same way by the end of 1961. This was supposed to be a provisional solution until the plate modulation was implemented, but it worked so well that it is still the mode of operation today.
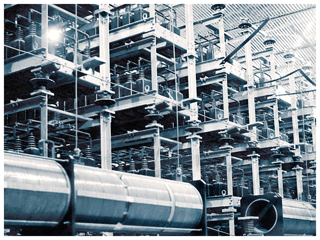
Figure 10Bank of high-voltage (25 kV) capacitors at the Jicamarca Radio Observatory; the bank can store enough energy to permit transmitting 5 MW pulses up to several milliseconds long, at a rate of roughly 100 pulses per second (picture taken by Ben Balsley).
Visitors to the site are impressed to see the size of the bank of hundreds of high-voltage capacitors and the heavy copper coils, all part of a lumped element transmission line (see Fig. 10), and the size of the pulse plate transformer mentioned before, which are all elements of the original design but have never been used. The price paid for the small loss in peak power with this alternative solution has been more than compensated for by the simplicity and flexibility of the control of the pulsed output of the transmitters, all done now at a low-power digital level; 27 April 1962 marked also the beginning of regular operation with the full antenna and the four transmitter units.
The construction of the main building was delayed for a few months with respect to the original plan because of an unexpected delay in obtaining detailed information on the parts of the transmitter that were coming from Hampton Roads. As explained by Bowles in one of his progress reports (Bowles, 1961a), the building acted as the “chassis” of the big transmitter, and it could not be built unless the dimensions and connections between the different parts were known. The construction finally started in early February 1961. By the end of April, two-thirds of it was completed, and it was practically finished when the transmitters were installed at the end of the year.
The date when the installation of the last antenna dipole was made, 27 April 1962, is considered to be the date on which the project was completed. It should be mentioned that the receiving and processing equipment used at this stage, and during the early life of the observatory, did not differ much from the equipment used by Bowles in the Illinois experiment. Reception was done with modified Hammarlund 600 receivers. Range gating and integration depended on a unit called the mercury jet commutator (MJC). Why did we need to integrate anyway? The reason is that the scattering is a random process, and all the information is contained in the statistics of the scattered signal. There is essentially no useful information at all in the echo from one transmitted pulse, even if the signal-to-noise ratio is very large. If we neglect noise entirely, the standard deviation in the received power level, for example, is proportional to the inverse of the square root of the number of samples, and so we needed to average the echoes from 10 000 pulses to achieve 1 % accuracy.
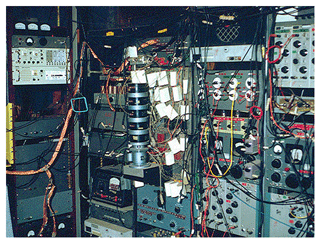
Figure 11Original reception and integration system at the Jicamarca Radio Observatory. Reception was done with modified Hammarlund 600 receivers. Range gating and integration depended on a mercury jet commutator (picture taken by Granger Morgan).
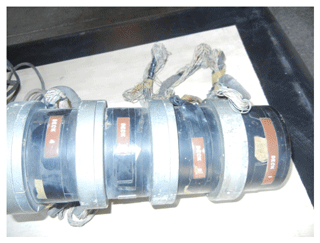
Integration was performed by 124 high-quality capacitors, with one for each altitude connected via a high-ohmic resistor to one of 124 outputs of the MJC. It is of interest, especially for the young electronic engineers and technicians, to briefly describe this last device, including its picture shown in Fig. 12, so that they can contrast it with the much more powerful and space-efficient solutions possible now.
The MJC consisted of a synchronous motor driving a rotating shaft at the center of cylindrical decks where 124 contacts, corresponding to the 124 outputs (inputs) of the commutator, were placed. Each deck was effectively a different commutator. Switching between the center shaft and each of the outputs (inputs) was done by a jet of mercury coming radially out from the center shaft, impacting sequentially each of the output (input) contacts. One of the decks was used for transmission. The commutator would initiate a cycle every transmitter pulse and switch sequentially the receiver output to each of the 124 integrating circuits corresponding to 124 delays (ranges).
A similar deck was used to read the integrated voltages stored in each of the integrating capacitors except for the central rotating shaft that was connected to an oscilloscope input. The oscilloscope showed the integrated voltage of each of the capacitors, in sequence, producing an amplitude profile as a function of range (delay). The image shown on the oscilloscope, after sufficient integration time, was photographed with a Polaroid camera and subsequently scaled by hand to produce an electron density profile. Figure 13 shows an example of one of these pictures.
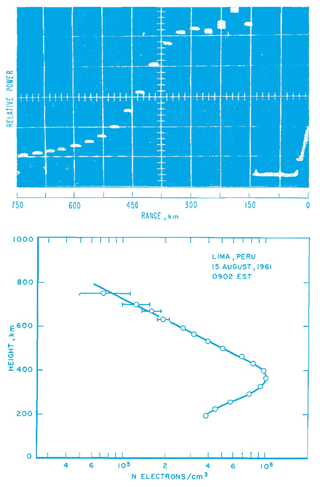
Figure 13In the top panel is an oscilloscope photograph taken on 15 August 1961 at 09:02 EST after sufficient integration time. In the bottom panel is the corresponding estimated electron density profile (adapted from Bowles et al., 1962).
The capacitors were of the highest quality available. They all needed to have the same capacity and the same high intrinsic parallel resistance, within the smallest tolerance possible, to guarantee the same proportionality between their charge and the amplitude of the signal received.
Some efforts were made to “modernize” this analog-range gate integration. Ben Balsley worked on a new design, using the state-of-the-art method – tube electronics at the time – that would have removed many of the limitations of the mercury integrator, namely a fixed radar interpulse period and the limited number of altitudes sampled. It was actually built, but it did not work properly. It used diode switching. The diodes had unpredictable back resistance and hence lacked consistency in the integration constants for the different ranges. When it was ready to function, a transistorized digital integrator and correlator arrived at the site, making it obsolete. This is a common story – then and now – with electronic processing: as one finishes a development, new technologies become available and make it obsolete. We will return to describe the “correlator” later on.
We have mentioned that, at the same time as the construction of the site, efforts were made to do some scientific work with the equipment that was available at the time on a non-interference basis. After half of the antenna had been built, several power profiles were obtained between the months of June and August 1961, still with the use of the 150 kW Collins transmitter (Bowles, 1961a). Careful computations were carried out, with an equally careful derivation of the radar equation taking into account all possible instrumental parameters that relate the effective scattering cross section of the electrons with the power received. The motivation was the claim made public by Pineo in the April 1961 URSI (International Union of Radio Science) meeting in Washington (Pineo and Briscoe, 1961), where he stated that the effective cross section of the electron, as measured by the Lincoln Laboratory radar in Massachusetts using the incoherent scatter technique, was an order of magnitude weaker than the one predicted by theory.
It turned out that the biggest problem with the agreement of the theory with Pineo's first results was the fact that the theorists were calculating the scattering cross section per unit of solid angle, whereas the experimenters were calculating what they called the “radar cross section”. As a result, the two definitions differ by a factor of 4π – a rather significant difference (Bowles et al., 1962).
We should mention that almost immediately after Ken Bowles' finding that the backscattered spectra were controlled by the ions in his Long Branch, Illinois, experiment in 1958, several scientists worked out the proper plasma theory to explain the observations. Papers published in the early 1960s by Fejer (1960, 1961), Hagfors (1961), Dougherty and Farley (1960), Farley et al. (1961), and Salpeter (1960, 1961) explained the observations using quite different mathematical approaches. They not only predicted a spectrum that was indeed controlled by the ions but also showed that the electrons did not act completely independently, i.e., incoherently. One had to take into account, instead, the collective interaction among the electrons as well as with the ions. The name for the technique, incoherent scatter, prevailed nevertheless. The theory also showed that the effective cross section of the electron, as seen from a radar in the frequency range used by Jicamarca, was usually half that of a single electron. If one were to have any trust in the validity of the theory, one would have to obtain an experimental value for the cross section that would conform to the theory, especially after Pineo's claim that they differed by an order of magnitude.
The many measurements taken during the July–August period mentioned above were later published in a paper by Kenneth L. Bowles, Gerard R. Ochs, and John L. Green in the NBS Journal of Research (1962), including the careful derivation of the radar equation (Bowles et al., 1962). They show that, within the accuracy of the measurements, most of the power profiles did in fact agree quantitatively with the theory. But there were exceptions: during the early hours of the morning, around sunrise and shortly after, measured cross sections were weaker than predicted for an ionospheric plasma in temperature equilibrium. An additional factor close to 1∕2 had to be applied. But this also agreed with concurrent theoretical expectations, namely the conjecture made by Fejer that at certain times and altitudes the electron temperature could be much higher than that of the ions and a refined incoherent scatter theory which included the effect of different electron and ion temperatures. The theory was refined by Fejer (1961), Rosenbluth and Rostoker (1962), Salpeter (1963), and later Farley (1966) to include the effect of different electron and ion temperatures. They showed that the scattered power is practically proportional to the inverse of the factor . Quantitative comparisons could not be made until it became possible to make independent electron temperature estimations through good spectral measurements of the scattered echoes, a difficult task at the time. The possibility that the electrons could have a different temperature than the ions, even though they occupied the same space, was explained based on the poor thermal contact between these two components as compared with that between the ions and the neutral background and by the fact than during the process of ionization the newly freed electrons would be detached with excess energy.
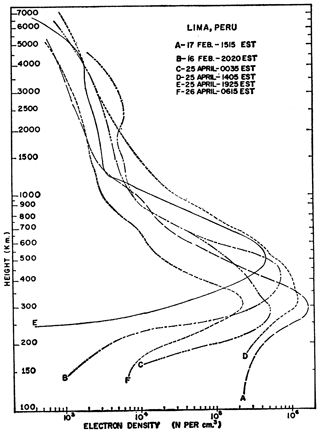
This last result meant that the technique could in principle now determine the Te∕Ti ratio, but it complicated the process of obtaining the electron density by simple power measurements, as originally proposed; spectral measurements were needed. As techniques were being developed to get around this difficulty, power profiles were being produced, now with megawatts of power and with the sensitivity of the full antenna. Several of these profiles, taken in the months of February to April 1962, were published by Bowles in a short paper in Science (Bowles, 1963a) that we reproduce in Fig. 14. The electron density profiles reached altitudes as high as 7000 km, so the sensitivity of the technique was established. The behavior of the electron density, simultaneously at all the altitudes above the maximum, was observed for the first time, ignoring the effect of Te∕Ti at that time, since this ratio was presumed to be close to unity above the F-region peak. Recently, Hysell et al. (2017) performed similar experiments, showing that it is still possible to obtain radar measurements from very high altitudes; however, the processing and analysis of the data have become more challenging due to the presence of clutter from satellites and space debris.
Converting power profiles to electron density profiles required the use of the radar equation with good knowledge of all the system parameters used. This would have been a tedious operation to carry out continuously. The solution was to calibrate the radar power with a known value of the electron density at a single given altitude. This could be easily obtained from an ionosonde, an instrument that had been used for years to determine the density in the lower part of the ionosphere. Simpler yet, one could use only the maximum density of the electron density profile, a parameter easily obtained by both techniques. The electron densities obtained prior to the arrival of the correlator were calibrated using this latter technique.
During September 1962 the first International Symposium on Equatorial Aeronomy (ISEA) was held in Huaychulo, Peru (see Cohen, 1963). We mention this not only because it was organized by the Jicamarca Radio Observatory and allowed sharing the success of the project with the scientific community but also because the 13th edition of ISEA was held and organized again in Peru on the occasion of the 50th anniversary of the observatory and, at the same time, on the occasion of the 50th anniversary of the symposium itself. The Jicamarca Radio Observatory was closely associated with the ISEA during all of these years.
The arrival of the digital correlator in March 1963 opened two new possibilities to obtain electron densities at all altitudes and times: (1) by digitally obtaining the autocorrelation function (ACF) of the backscattered echoes and (2) by measuring digitally the Faraday rotation experienced by these echoes. If the ACF of the incoherent scatter radar (ISR) signals is computed, we can in principle estimate the temperature of both electrons and ions by comparing the observations with the theory. Having the temperatures, two additional parameters of interest in their own right, one could then correct the power profile to obtain the electron density. But as far as obtaining the electron density only, the Faraday rotation alternative was simpler; the angle of rotation of a linearly polarized wave depends on the integrated electron density between the transmitter and the point of observation, i.e., the point selected by the range gate of the radar. It is independent of the composition and temperature(s) of the ionized gas. It did depend, though, on the angle and magnitude of the magnetic field with respect to the radar beam, but this was a factor that needed to be measured only once by some other means. By taking the difference in rotation angle between two contiguous altitudes, one could get the density independently of any of the state parameters of the radar.
The correlator, as its name indicates, was a digital device capable of finding statistically the autocorrelation, or the cross-correlation, between one or two random sequences. In the case of the radar, it was capable of doing this with selected samples of the backscattered signals. It is not our intention here to explain how this potential could contribute to the alternatives mentioned above, since it would take us too deeply into statistics and incoherent scatter theory. It suffices to say that the autocorrelation function of the scattered signals received, i.e., the cross-correlation of the signal with itself but at two (variable) consecutive times, is uniquely related to the signal power spectrum; thus it can provide the same information about temperature and composition as the latter. To this we should add that at 50 MHz, the frequency of the Jicamarca radar, it is easier to measure the autocorrelation function of the backscattered signals than to measure the corresponding frequency spectrum.
The correlator was also capable of measuring the angle of (Faraday) rotation of a linearly polarized backscattered wave, as mentioned before. It can be easily shown that this angle is equal to the half-phase angle of the complex correlation of the two circularly polarized components of the scattered signals from the same altitude range. Both measurements could be performed in real time.
The correlator was designed by George Sugar from the NBS. It was a clever design. It was built in Boulder, Colorado, in the electronic shops of the NBS using the newly developed transistor electronics. It is important to note that this correlator did more than correlate; it also acted as the radar controller, turning on and off the radar pulses (and pre-pulses) and the sample pulses. In fact it was really two radar controllers running in parallel but sometimes not in synchronization. For the so-called “double-pulse” measurements, pulse pairs, one by each controller, could be generated, with the spacing between the pairs varying cyclically.
A short description of the device is worth giving here in order to contrast its size and performance with a functionally similar modern device. The correlator consisted of two electronic standard racks going from the ground to the ceiling of the reception room (see Fig. 15; the correlator corresponds to the second and third racks from the left edge of the picture). It contained eight preset counters – each preset by three decade thumbwheel switches, four 5 bit plus-sign analog-to-digital converters (ADCs), a digital multiplier with a corresponding number of bits, a 5-kiloword magnetic-core memory, and a convenient number of flip-flops, AND gates, and OR gates. They all had their inputs and outputs centralized and available for interconnection in the back of an IBM patchboard with 1024 holes. The correlator was “programmed” by interconnecting the different inputs and outputs. The interconnections were made by prewiring a plugboard that fit into the patchboard. A plugboard had hundreds of wires (up to 512 or even more; see below) that would connect the output of one device to the input of another as desired for each particular experiment. There was a prewired plugboard, as the one shown in Fig. 16, for each experiment. One of them is also visible – plugged into the patchboard – in the lower central part of the picture of the correlator (see Fig. 15). Some of the most elaborate programs actually used all 2×1024 holes and had one or two extra circuit boards, and perhaps a few manual switches, mounted above the patchboard.
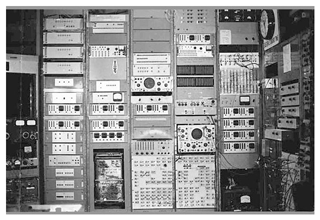
Figure 15The digital correlator at Jicamarca, which was an electronic system that was used to compute the correlation of the IS signals measured by the radar (picture provided by Jorge Heraud).
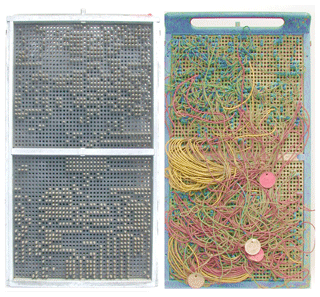
Figure 16Plugboard for programming the digital correlator used at Jicamarca in the early 1960s. The plugboard had 2×1024 holes, and some of the programs required the use and connection of every hole.
The memory was in a way the heart of the correlator. In each memory location the product of two values sampled by the ADCs was accumulated (averaged) in a repetitive way, once for each radar pulse sequence, performing in this way the cross-correlation of those two values. For simple power profiles the absolute values rather than the square of the receiver voltages were used. These were more convenient to use and were almost as good statistically. The preset counters were also used (through the plugboard) to produce the required sequence of control pulses; e.g., the pulses required by the radar transmitters and the sequence of pulses that sampled the different radar ranges from the output of the receivers as well as the control pulses required to fetch a value from the memory, perform a replace–add operation, and store the new value back in the memory. The numerical parameters required for the configuration of the experiment were set manually through the thumbwheel switches of the preset counters.
The clock rate of the correlator was 30 000 cycles per second. This matched the speed of the memory, allowing in one cycle a memory fetch and restoration. The restored value was, normally, a new accumulated value resultant from the sum of the fetched value and the output of the multiplier with the product of the new sampled values being averaged (correlated). This speed was quite an achievement in those days and was possible only by performing the operations with a hardwired special device like the correlator. In contrast to a modern computer, the correlator and radar controller could perform many operations during one clock cycle. This was the key concept that made it so powerful – and so challenging to program. And remember that there were usually two separate controllers sending out commands at the same time.
A clock and memory cycle corresponded to 5 km of the radar range, but the actual radar resolution was usually actually 10 km, since the autocorrelation or cross-correlation being estimated was a complex number and both the real and imaginary component of it had to be evaluated. Now one can perform the same operation with a much cheaper electronic card at speeds 5 or more orders of magnitude faster. The authors of this paper could not imagine at the time that a much more powerful device could be constructed today with such a small size and with such amazing speeds and even less so that they would be able to witness it.
The correlator would run repetitively in a given experiment for tens or hundreds of thousands of transmitter pulses. At the end of a run, the memory contents would have a corresponding number of accumulations for each of the cross products one wanted to average to obtain a statistical estimate of the correlations. The accumulated values in the memory were obtained graphically by means of a Polaroid camera, photographing the screen of an oscilloscope where the contents of the different memory locations were displayed in an orderly fashion. The recorded graphical values were then scaled by hand.
The scaled values, read from the graph, contained the values of the autocorrelation function of the echoes corresponding to each of the altitudes sampled or perhaps the power profile values. The analysis of the data, before the arrival of a PB250 computer in 1963 (see below), was performed by hand. To obtain electron and ion temperatures and ionic composition, the autocorrelation of the backscattered echoes of each altitude was plotted and compared with transparent overlays with pre-computed theoretical functions for different values of the searched parameters. The desired parameters were those corresponding to the theoretical curve that gave the best fit by eye.
The Faraday rotation angle was determined by measuring the phase shift of the complex cross-correlation of the echoes of two independent and simultaneous radar experiments, with one for each of two possible radar wave polarizations: right and left circular. Although physically the antenna consisted of two independent and orthogonal linearly polarized sub-antennas, occupying the same space, one could synthesize two circularly polarized ones. One or two of the four transmitters were assigned to each of the two circularly polarized antennas. On reception, the two independent backscattered echoes were fed to two separate receivers, digitized and cross correlated in the correlator. The cross-correlation was complex. Its real and imaginary component produced an altitude profile, which had to be scaled manually. The phase angles corresponding to the two complex components were computed manually, using a slide rule, and from the angle profile an electron density profile was obtained.
The above process was very tedious and could not keep up with the amount of data that the radar was capable of producing, even at very small use rates. Nevertheless, important progress was made with the use of the correlator alone in developing the Faraday and autocorrelation techniques, especially in identifying possible sources of systematic errors – which turned out to be numerous. Further details about these errors can be found in Pingree (1990).
Fortunately, this “manual” situation did not last too long; by early August 1963 a computer arrived. It was a minicomputer, a relatively fast one for the epoch, a Packard Bell PB250. It is interesting to note that this was the very first electronic computer to arrive and be used in Peru. Being fast for this epoch meant that a fix-point multiplication took about 400 µs and that a floating-point multiplication took about 3 ms. Its memory was an innovation at the time. It was a magnetostrictive acoustic delay line. Streams of bits, forming 22 bit words, were memorized by being fed into the input of an acoustical delay line and then received at its output and fed back in again at its input in a recirculating fashion every 3 ms. Most of the delay lines contained 256 words. With a 2 MHz clock, this meant that information that had just been fed into a delay line memory location would take about 3 ms to fetch. To be at all efficient, this required clever multi-thread programming; while a given instruction was waiting for an operand to be available, other instructions were executed to reduce the idle time. There was no high-level language compiler, not even an assembly language; it had to be programmed in machine language (octal words). Figure 17 contains a page of code as an example of a program for converting power to decibels.
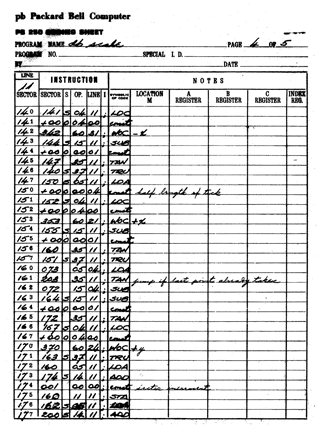
Figure 17Sample page of a program for the Packard Bell PB250 computer. This computer had to be programmed using machine language (octal words), and no high-level language compiler was available.
Nevertheless, slow and cumbersome as it may look to us today, the PB250 was the last piece of equipment that the JRO needed to produce the information it was originally intended to produce. Its arrival was a landmark in the history of the observatory.
One more (irritating) feature of the PB250 should be mentioned. The main memory, as we have said, consisted of 16 magneto-acoustic delay lines. The data or program “words” traveled down the line at the speed of sound (in the line) and were then fed back into the input. But the speed of sound depends on temperature, and the air conditioning in the early days was very limited and did not include the computer. Temperature varied throughout the day and from day to day. Often the computer would not work early in the morning; the individual lines had to be “tuned up”, one by one, using an oscilloscope.
Before we continue chronologically with further technical developments and other scientific contributions, we should stop to mention that by the time the radar was able to produce some scientific results, three additional NBS scientists had joined the observatory: Bob Cohen, Don Farley, and Will Klemperer. Bob Cohen arrived in 1961. He was a colleague of Ken Bowles and had worked with Ken in Peru during the IGY in the trans-equatorial propagation project and was an ionospheric expert. One of his contributions was related to the calibration of the first power profiles using ionosonde electron densities. Don Farley arrived in November 1961. He was one of the few theoretical scientists in the world who had worked in the development of the incoherent scatter plasma theory. Besides his expert advice related to the theory, his first contributions were related to the development of the techniques to measure temperatures and composition, mainly regarding the removal of instrumental errors. Will Klemperer arrived in August 1961 and was involved in radio astronomy projects that we will describe soon. The IGP team was increased with the arrival of Don Sterling in August 1963. Don was a US geologist with experience in computer programming. He became the expert in PB250 programming. Don Sterling, Ken Bowles, and Don Farley were the only ones capable of writing analysis programs for the PB250. Around this time Jorge Heraud went to Stanford, one of 10 Peruvian IGP engineers sent to the US to get their PhD.
The period between shortly before the arrival of the correlator and then of the PB250 was a period of both expectations and frustrations followed by some relief. This we can deduce from the following sentence in the Ken Bowles NBS report no. 7963 (Bowles, 1963b): “Even after the first theoretical papers were published the properties of incoherent scatter were thought to be relatively simple and thus subject to observational techniques which were relatively uncomplicated apart from the immensity of the antenna and transmitting equipment required.” And later on, he stated the following: “We are disappointed that the last six months have had to be devoted to additional development work rather than to assembling electron density profile data in quantities. Nevertheless we are relieved to find that it does still appear that incoherent scatter will indeed continue to be a practical means to measure these profiles.”
Reasons for the frustration came from finding that obtaining the Te∕Ti ratio from the autocorrelation function of the signals was not very simple: there were concerns about the possible existence of helium and/or molecular ions and unexpected asymmetries in the corresponding experimental spectrum or ACF. One can show that the presence of small percentages of helium or heavy ions will have similar effects on the ACF to a change in the Te∕Ti ratio, making the determination of any of those parameters ambiguous.
The solution, as far as obtaining reliable electron density profiles, was to use the Faraday rotation technique in the F region, where Te∕Ti can differ from unity, and the power profile above it. This technique was independent of the shape of the spectrum, but the first trials were not free of other problems. The arrival of the PB250 contributed greatly to the relief of earlier frustrations. It was capable of producing a Faraday profile 5 min after the data were taken, helping to diagnose the origin of the problems and to find ways of minimizing them. Among the sources of error found were external interferences and inaccuracies in the phase detectors. Both disappeared with the development of observational tricks like alternately flipping the phase of the transmitter pulses 180∘ and interchanging the role of the in-phase (real) and quadrature (imaginary) outputs of the phase detectors.
With the advent of reliable Faraday density profiles, the radar became capable of producing electron density profiles at all altitudes. The Faraday profiles were used in the lower F region and the power profiles at all altitudes. The region where the Te∕Ti ratio was unity (above 400 km during the daytime) was used to calibrate the power profile into electron density profiles. In the lower altitudes, they differed, and the difference was used to obtain the Te∕Ti ratio at those altitudes. Confidence in the technique was gained by comparing the lower-altitude results with results obtained with the well-established ionosonde technique mentioned before.
Now, having obtained the Te∕Ti ratio as described above, the potential to obtain other parameters of interest from the experimentally obtained autocorrelation functions was opened. There would be no longer the ambiguity of similar effects on the shape of the autocorrelation function caused either by the temperature ratio or by changes in composition. One could now obtain two additional parameters: ion composition and the electron temperature without ambiguity.
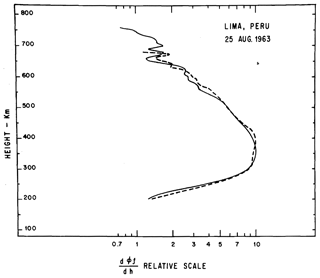
Difficult as it was to program the PB250, its practical use did not take long. By 25 August 1963, the first Faraday profiles were calculated online, just about a month after the computer's arrival. These first results are shown in Fig. 18. A few days later, several power and Faraday profiles were obtained along with the measurement of a few autocorrelation functions. In Fig. 19, we show some of these early results following the procedures sketched above.
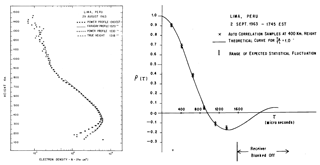
Figure 19In the left panel is a comparison of Faraday, scaled power, and true-height electron density profiles taken in the afternoon of 29 August 1963. We can notice that the effect of Te∕Ti greater than 1 at the lower heights. In the right panel are an example of incoherent scatter autocorrelation measurements and the fit to a theoretical function. We can observe the good agreement between the data and the theory (adapted from Bowles, 1963b).
We could say that the year after the arrival of the PB250 was spent making fine adjustments on the observational techniques and obtaining the first fully satisfactory measurements. By the time Ken Bowles decided to leave, sometime around September 1964, the instrument he had built was capable of obtaining profiles of electron density, Te∕Ti, electron temperature, and composition of the main ionic components of the ionosphere, [O+], [He+], and [H+], just as he had promised in his proposal (notwithstanding some reasonable physical assumptions about the helium and temperature behavior that needed to be considered). We show in Fig. 20 a contour plot of electron density as a function of altitude and time of day, corresponding to a 48 h run at the end of May 1964, one of three similar runs made before Ken's departure (Farley and Bowles, 1964). Figure 21 shows the full capability of the system taken at the end of July 1964. Apart from the plasma density, we can see the ion composition as a function of altitude as well as the temperature of the ions and the temperature ratio Te∕Ti.
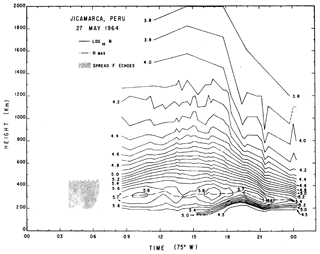
Figure 20A contour plot of electron density as a function of height and local time, measured on 27 May 1964 (reproduced from Farley and Bowles, 1964).
A good part of the success was due to the scientific and technical help of the people we have mentioned already and to new technicians that began as ordinary workers during the construction and were then trained at the observatory. These included Quírico Sibille, Jesús Córdova, Francisco Córdoba, Ramón Ilma, Augusto Zúñiga, and Santos Villegas, some of whom stayed at the observatory until their retirement. Others came with desired skills, like Diana Valdez, Tassiana Vilchez, Lucho Wu, Armin Hoempler, Jaime García, Moisés Vargas, Sixto Pinto, José Mechato, and Luis Pinchilotti.
We should mention that the presence of gyroresonance signatures on the measured IS signals, an important possibility that led to the proposal to construct the observatory at the magnetic Equator, was not observed. In fact it was proven, theoretically and independently by Farley (1964) and Dougherty (1964), that this was not surprising, at least in the region where O+ was the main constituent. This is a good example of how intuition can lead us to the wrong conclusion if it is not accompanied by the proper theory. Farley himself admits to having many discussions with Bowles about the reasons of why the gyroresonance was not observed. Farley was claiming that something was wrong with the experiment, and Bowles was claiming that something was wrong with the theory. Bowles turned out to be right. It was argued originally that since the collision frequency of the O+ ion with other ions was much less than the gyro frequency, its effect should be negligible. The wavelength of the radar frequency was ignored, but it turned out that it was an important factor. It was shown that no matter how small the ratio of collision frequency to gyro-frequency is, if the average spatial deviation of the ion from its collisionless first complete orbit is comparable to or larger than the wavelength of the radar divided by 4π, the gyro effect cannot be seen. This is the case for O+ at normal F-region densities and for the 6 m wavelength of the radar but not for H+. Indeed, a couple of years later, the gyroresonance of H+ was observed by Farley (1967). In any case, the possibility of obtaining the ionic composition was not affected by these negative findings; it could be obtained from the shape of the autocorrelation function at relatively longer delays, as we have discussed before (see Woodman, 1967).
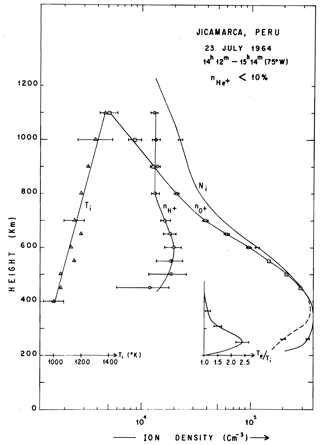
Figure 21Plasma density, ionic composition, temperature, and Te∕Ti profiles of the ionosphere above Jicamarca, measured on 23 July 1964 (reproduced from Farley and Bowles, 1964).
The scientific contributions of the Jicamarca Radio Observatory in its early years were not limited to the development of the technique and to furthering our knowledge of the ionosphere. The JRO also made important contributions to astronomy, thanks to the collaboration of Bill Klemperer. Even before the antenna was completed, sky noise measurements were made (Bowles, 1961a). When the antenna was completed several sky scans were made at different declinations (Bowles, 1961b). Some of the radio stars observed were identified for the first time. The Jicamarca antenna had an advantage over other radio telescopes in that it had the largest aperture in the world (Ochs, 1965), although angular scintillations turned out to be very severe at the JRO, at ∼0.5∘ at times.
Shortly after the antenna was completed and the full power of the transmitters was available, a successful experiment to obtain radar echoes from Venus was carried out. The observations were made between 28 November and 2 December 1962 under the leadership of Will Klemperer and were described in a 1964 paper by Klemperer, Ochs, and Bowles (see Klemperer et al., 1964). Despite the relatively short time for the observations (4 min) as compared with steerable radio telescopes, the radar power and antenna size provided sufficient sensitivity. It was observed that only the first 1∕40th of the ranges corresponding to the radius of Venus contributed to the echoes. This meant that the surface of Venus was smoother than the Moon. And from the fading rate of the signal, a rotational period of 180–280 d was estimated. It should be recalled that the rotation of Venus cannot be seen optically because of its cloudiness; only radars could see through the clouds and determine the rotation rate. Arecibo (operating at 440 MHz) soon took definitive measurements of the Venus rotation rate (e.g., Dyce et al., 1967).
Another astronomical experiment at Jicamarca was an attempt in 1964 to get echoes from the solar corona. This idea was actually included in Bowles' original proposal. Expectations were high, since the JRO had a comparable sensitivity to a special 38 MHz radar built for solar studies in the early 1960s in El Campo, Texas (James, 1966). But no echoes were detected; thus the reasons for an unsuccessful experiment remained unclear. No further attempts were made in the early years.
Another very interesting observation, although not related to the original objectives of the Jicamarca project, was the observation of synchrotron radiation on the occasion of the Starfish Prime high-altitude (∼400 km) nuclear explosion made on 9 July 1962 over Johnston Atoll in the South Pacific. Six minutes after the explosion very strong linearly polarized signals were received (Ochs et al., 1963). These were attributed to synchrotron radiation from very energetic electrons released by the explosion. Since these electrons precess around the globe with a speed that depends on their energy, it was possible to determine, from their arrival delay, their energy spectrum, which almost exactly matched the expected spectrum. Its number was also determined from the intensity of the signal. The synchrotron decayed very slowly and could still be detected more than a year after the explosion (Ochs, 1964).
One requirement for the incoherent scatter technique to work is that the ionospheric plasma must be in thermodynamic equilibrium (maximum entropy) or at least in quasi-equilibrium so that the ion and the electron gases can both be described by a temperature. Under this condition, the fluctuations in electron density from one spot to another are at a minimum. In fact, one way to think about and treat incoherent scatter is that the scattering comes about from the fluctuations at this ever-existing minimum. But there are occasions when the electron density presents fluctuations that are much larger than this minimum. This could be the consequence of plasma turbulence or instabilities, for example. On these occasions the scattering is much stronger, and we refer to it as coherent scattering.
Coherently scattered signals are so much stronger than the incoherent ones that their existence did not go unnoticed from the very beginning of radar operations. Coherently scattered echoes were observed and reported coming from different regions: from the D-region altitude around 75 km, from close to the peak of the E region around 105 km, from the top of the E region between 150 and 170 km, and from varying altitudes within the nighttime F region. The echoes from the F region were often mentioned in connection with the first reports of day-long electron density measurements, since they prevented incoherent scattered measurements from being made. But during the early years, the only coherently scattered echoes that were subject to intentional observations and to their study were those coming from around the E region peak.
The study of the backscattered echoes from the E Region, more specifically from what was known at the time as the equatorial sporadic E traces in ionosonde records, was a natural continuation of the studies made by Bowles and Cohen (1960) during their IGY trans-equatorial experiments and some previous lower-power radar echoes that they obtained in Huancayo. They continued their interest with observations made with the Jicamarca radar using a specially built antenna, an array of eight dipoles that could be steered to different zenith angles in the E–W vertical plane only. The echoes as received by the 50 MHz Jicamarca radar were extremely strong, being several orders of magnitude above the noise level and the level of incoherent scatter. The echoes were classified into two types: one identified with planar unstable waves and the other by plasma turbulence. The first echoes were identified with a modified two-stream plasma instability, also known now as the Farley–Buneman instability, honoring the theoretical explanation offered by Farley (1963). The other type was also explained by Farley and colleagues (e.g., Balsley and Farley, 1971; Farley and Balsley, 1973) as a consequence of a plasma turbulence generated by an unstable electron density gradient in the presence of an electrical field (a gradient-drift instability). In both cases they are related to the strong current that flows in those altitudes, the equatorial electrojet, also discovered in Peru a few years before (Chapman, 1951).
The research efforts along these lines include the doctoral thesis of Ben Balsley (he went back to graduate school in the mid-1960s) and later the thesis of Bela Fejer. The research still continues to this day and has taken a good portion of the professional life of Don Farley. The observations and research efforts along these lines are very extensive and worthy of a historical report on their own. We definitely cannot cover them here. We should mention, though, that much of what is known in the world about the electrojet irregularities has come from research done at Jicamarca (see Farley, 2009).
After the departure of Ken Bowles in September 1964, Don Farley was appointed as the new director of the observatory. Shortly before this, Phil McClure had joined the observatory. Will Klemperer left a few months after Bowles. Don Sterling and John Green stayed. That left four of them to be in charge of the future research and development work at the observatory. They inherited a working instrument, and the emphasis now was on the science it could produce, although there were still some refining touches needed for the processing techniques. In fact, one of Don Farley's initial activities was to document all the details that go into the radar signal processing in order to remove the instrumental biases and improve the accuracy of the results. He would eventually write three Radio Science papers (Farley, 1969a, b, c) that described all of these techniques, including Faraday rotation and profiles of electron density, Te and Ti, and ion composition. These papers are necessary reading for anyone that wants to use the radar for these purposes.
From the electron and ion temperature data, one could infer the energy input from the sun into the ionized gas and the temperature of the background neutral gas. Comparisons were also made with concurrent in situ satellite measurements of density and temperature. These did not always agree. Agreement eventually came later, with improved satellite instrumentation.
In 1966, two additional scientists, Vern Petersen and Tom Van Zandt, arrived at Jicamarca. Vern Peterson came in September and Tom Van Zandt in November. Vern was tasked to set up an airglow instrument to make concurrent airglow measurements in conjunction with the radar. Tom's activities and interests were related to the implications of Jicamarca's new observations on the physics of the ionosphere.
On 12 November of the same year, a total solar eclipse occurred over Jicamarca (Rishbeth, 1970). Incoherent scatter density measurements were made during that period. This was the first time that an eclipse had been observed with an incoherent scatter radar, thereby yielding electron densities both below and above the F-region peak.
Around this same time, the H+ gyroresonance was observed by Farley for the first time, confirming theoretical expectations (Farley, 1967). Since its period was much shorter and the ion density (collisions) much lower, H+ was not affected much by the ion–ion collisions, as we discussed for the case of O+. In fact the agreement with theory was perfectly within the accuracy of the measurements despite the fact that the theoretical correlation function was a very structured function with a large number of degrees of freedom. This is one of the observations that gave us so much confidence in the validity of the incoherent scatter theory.
Don Farley left for Cornell University in the fall of 1967, and the position of director was replaced by Tor Hagfors. Hagfors was one of the few radio scientists who had developed incoherent scatter theory (Hagfors, 1961). He had worked at Lincoln Laboratory doing astronomy and incoherent scatter, both theoretically and experimentally. While at Jicamarca, he developed and carried out a radio technique to measure the permittivity (ϵ) of the surface of the Moon (Hagfors et al., 1969). The results gave indirect information about the Moon's surface, i.e., how loosely compacted it was, prior to the first lunar landing.
Almost simultaneously following Hagfors' arrival, Ron Woodman joined the observatory. He had just graduated from Harvard University and was the first of a contingent of IGP engineers who had gone to the US to get their doctoral degree. Woodman's PhD thesis was on incoherent scatter theory including, for the first time, the effect of ion–ion collisions (Woodman, 1967). This was an important effect, as pointed out above, when explaining the observations of (or lack of) ion gyroresonance. The comparison with the theory of the experimental results of Farley's H+ gyroresonance experiment was conducted using Woodman's numerical computations. Woodman also developed a numerical technique for obtaining theoretical correlation functions that included the cases where the radar echoes were returned from regions close to perpendicular to the magnetic field lines. The classical way to do this calculation involved Fourier transforms from the time to the frequency domain. These transforms were difficult to perform numerically under such conditions. The Fourier transform required numerical integrations from minus to plus infinity of long-lived functions with the very high sampling rates required by the short structure of the electron and ion gyro frequencies. Woodman's approach avoided the transformations by staying in the time domain throughout the computations.
The possibility of obtaining theoretical correlation functions with pointing directions perpendicular to the magnetic field provided the potential for obtaining ionospheric drifts with very high accuracy. Indeed, radial velocities obtained experimentally using this technique produced accuracies of the order of 1 m s−1. Jicamarca was the only instrument in the world capable of making such accurate measurements. Since vertical drifts were closely related to zonal electric fields at the same altitudes, this accuracy translated into an accuracy of ±25 µV m−1.
Despite the limited capacity of the correlator and the PB250, the profiles of vertical drift velocities were obtained every 5 min. Measuring drift velocities using these limitations was possible via a separate technique developed by Woodman. Standard techniques to measure velocities in radar and other instruments involved the computation of frequency spectrums (a numerically demanding operation) and then the evaluation of its frequency shift (first moment). In contrast, Woodman's technique involved the measurement of the phase of a single point of the complex autocorrelation function at a given delay, a much simpler operation. This technique was later used in meteorological radars.
The first use of the F-region electric field measurement technique was the determination by Balsley (who had recently returned from graduate school) and Woodman that the zonal electric fields in the ionosphere had very large scales and that they were strongly coupled to the electric fields that drive the electrojet (Balsley and Woodman, 1969).
The first drift velocity profiles as a function of altitude were published in a paper by Woodman and Hagfors (1969), which included a detailed description of the technique and a theoretical estimate of the unavoidable statistical errors incurred.
July 1969 marked a very important event for the JRO. The entire facility was transferred from the NBS to the Instituto Geofísico del Perú. The reasoning underlying this transfer involved Juan Velasco Alvarado, then the president of Peru. Velasco had become anti-US as a consequence of the events following the nationalization by the Peruvian government of the International Petroleum Company (IPC), a US company. In one of his radio and televised speeches, he pointed out that he would not be responsible for the security of the US personnel living in Peru. The seven US scientists and engineers that were working at the observatory and their families were “advised” by the US embassy and NBS authorities to leave. A picture of the transfer ceremonies is shown in Fig. 22.
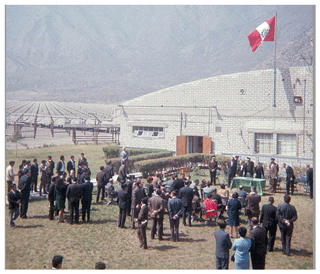
Figure 22Ceremony transferring Jicamarca Radio Observatory from the United States government to Peru in 1969 (picture taken by Ben Balsley).
Fortunately for the future of the observatory, the Peruvian engineers, technicians, and the only Peruvian JRO scientist, Ron Woodman knew how to operate the observatory. On the negative side, financing the JRO operating budget, which was more than USD 500 000 (USD 1969), was beyond any possibility (or willingness) of the Peruvian government to finance. Although there was no significant money for its operation, Peruvian labor laws forced the continuation of the Peruvian personnel in the institute's payroll. The personnel effort was dedicated to improving the reliability of the radar. An example of some of their accomplishments was a solution to an old problem with the continuous operation of the transmitter. Very often, the observatory's main breakers would trip when the transmitter “crowbar” was activated, with consequences for the continuity of the observations. The crowbar was a protection circuit for shorting the 20 kV transmitter power supply to prevent short-circuit currents from passing through and ruining the very expensive power triodes. Very simple but important changes in the design of the power supply were made. There has not been any crowbar incidence since.
In parallel with the transfer of Jicamarca to Peru, the US ionospheric and radio science scientific community quickly reacted. An informal group, the “Amigos de Jicamarca”, was formed under the leadership of Bill Gordon to gather support for the continuation of the operations of the observatory. Financial support was returned from the NBS (later the Environmental Science Service Administration – ESSA), which had been criticized for its overreaction to Velasco's negative comments. Additional funds were provided from the National Science Foundation (NSF), the Organization of American States (OAS), and the National Aeronautics and Space Administration (NASA).
Although these additional funds were incremented slowly, they enabled minimal operation of the radar and some further development of measuring techniques. One of these techniques allowed the measurement of the F-region horizontal drift velocities (e.g., Woodman, 1972). This technique used half of the antenna pointed 3∘ off zenith to the east and half to the west. The accuracy in measuring velocities in radial directions permitted the measurement of the small projection of the horizontal drift velocities in these two directions. Vertical and horizontal velocities were now obtained from the sum and difference of these two projections.
One additional developed capability was the measurement of the inclination of the magnetic field at F-region heights using incoherently scattered signals (e.g., Woodman, 1971). The technique took advantage of the very long correlation times of the echoes that came from the regions where the magnetic field was exactly perpendicular to the propagation direction of the radar probing waves. The angular position of this narrow region of perpendicularity was determined very accurately using (north–south) interferometric techniques. The direction towards perpendicularity permitted the determination of the inclination of the magnetic field with an accuracy of 1 arcmin at F-region altitudes, the same accuracy claimed by the existing field model published by NASA. Although this was derived from in situ satellite measurements, it was proven by Jicamarca to have an error of 1∘, which was 1 order of magnitude larger. A few years later, NASA admitted the error and accepted JRO measurements.
In order to obtain vertical drift velocities it was necessary to point the antenna perpendicular to the magnetic field, but to obtain Faraday rotation densities and temperatures it was necessary to point about 3∘ off the perpendicular direction. To switch the antenna from one pointing direction to the other took approximately 2 h. Normally, one would set up the antenna to measure either drifts or density and temperature for a particular observation. On 11 September 1969, there was an annular eclipse. The eclipse center of path crossed the longitude of Jicamarca 1∘ S (S – south) of the site. Thus, this provided the opportunity to measure the ionospheric effects of the eclipse, including as many parameters as Jicamarca could now measure. Both antenna positions were required, but the time to switch between the two was insufficient. The solution was to split the antenna into two parts, one pointing perpendicular to the magnetic field (to measure vertical drifts) and the other at the 3∘ S position (to measure densities and temperatures). An experiment was set up on this mode by Ron Woodman, and the results were used by Don Sterling and Bill Hanson (University of Texas at Dallas) to show the excellent agreement of the eclipse with a sophisticated model they had developed (see Sterling et al., 1972).
The same technique was used a few months later to register the ionospheric behavior in response to the great magnetic storm of 8 March 1970 (see Woodman et al., 1972). It was pure serendipity that Jicamarca was already observing in this mode, although it had become a mode of regular operation. Again, the vertical drift values were fed as additional information into the model mentioned. The measured electron density values compared very well with those obtained from the numerical model. The key to the success of both experiments was the fact that the actual vertical drift could be measured and used to force the model. These two events showed the importance and usefulness of Jicamarca's vertical drifts in the understanding of the dynamics and chemistry of the ionosphere.
We have mentioned that, during the nighttime, Jicamarca would often get coherently scattered echoes from the F region. Very early in the operation of the radar they were identified with an ionospheric phenomena known as equatorial spread F. The name came from the spread appearance of the traces produced in early ionosonde records. The phenomenon had been discovered in Huancayo in 1938, but the physical process that produced it was not well understood (Booker and Wells, 1938). The echoes were more of a nuisance than an object of study during all the early years of operating the observatory. This situation changed in 1970, when many days of observations showing the occurrence of the phenomena were analyzed in a paper by Farley, Balsley, Woodman, and McClure (see Farley et al., 1970) in the context of what was happening with the electron density profiles and the vertical drift velocity. One of the most important conclusions of the study was that none of the existing theories that had been put forward to explain that the phenomena would conform to what was being observed. More than 30 years had passed since its discovery at that time, but spread F was still poorly understood. Additional details of spread F studies over the years can be found in Woodman (2009).
One of the most important contributions of Jicamarca during this “late early” history was the realization that a radar with comparable powers and antenna area (power-aperture product) could obtain winds, waves, and turbulence parameters from tropospheric to mesospheric heights. It was developed in the early 1970s by Woodman and Guillen (1974), and it was later referred to as the MST (for mesosphere–stratosphere–troposphere) radar technique. A few radars were built around the world, motivated by the Jicamarca experience. It is an unusual example of the transfer of technology from a developing country to the developed world. Less powerful radars followed, capable of obtaining the same parameters but only at tropospheric and lower-stratosphere heights. They were referred to as stratosphere–troposphere (ST) radars or, more commonly now, as wind profilers. Many of these were built for either meteorological research or even operational purposes. Both techniques obtained their coherent echoes from temperature fluctuations in the tropospheric–stratospheric heights (ST radars) and also from electron density fluctuations in the mesosphere (MST radars); echoes were obtained at all heights from turbulent mixing of gradients in these parameters. The radars used the turbulent fluctuations as a tracer to determine the vector velocity of the medium at a large range of timescales, ranging from gravity (buoyancy) waves, through tides, to prevailing winds. We should emphasize “vector” in this last statement, since one could obtain the three components of the velocity vector, including the vertical component, which had not been obtained before with any other available technique. Power and spectral characteristics of the echoes could also be used to characterize energetic parameters of the very same turbulence that was used as a tracer (see Woodman, 2003).
A quantum jump in the control and processing electronics came about with the arrival of a third-generation minicomputer. In January 1971, a Datacraft minicomputer arrived at the observatory. At the beginning, its first task was to replace the PB250 that used the correlator as a “front end”. Many electronic projects followed the installation of the Datacraft. It became necessary to replace the functions of the correlator, namely its function as a radar controller and sampler. The conversion of the receiver and phase detector outputs from analogue to digital and the computation of the autocorrelation or cross-correlation functions of these outputs were accomplished with in-house technology.
A very flexible radar controller was built using an innovative design during this period. The digitalization was performed with a fast 8 bit ADC connected to the two outputs (in phase and quadrature) of two receivers through an analogue multiplexer. The real-time interface to the computer had to be designed and developed, a task that included the development of the operating system handlers. The next task was to write the real-time programs to perform the statistics (correlations and spectra), the analysis, and the graphics. These improvements of the radar system at Jicamarca facilitated the development of many more radar techniques in the following years. Range–time–intensity plots with a higher dynamic range than before were possible, and thus new ionospheric studies benefited from this. One of these studies was the work of Woodman and La Hoz (1976), which described in detail a set of range–time–intensity (RTI) maps of spread-F observations conducted with the Jicamarca radar. The observations showed that spread F can occur at the bottom side, at the topside and the steep bottom of the F region, and in the valley between the F and E regions; thus different manifestations of spread F should be classified into different types. The characteristics of the plume-like structures observed were interpreted as evidence of a Rayleigh–Taylor instability. It was proposed that bubbles or intruding fingers of low-density plasma in the lower ionosphere propagate nonlinearly to extend the instability to the top regions, a theory that was later verified by simulation studies (Zalesak et al., 1982).
The above comments outline the first of many ambitious electronic developing projects to be carried out at the observatory. These developments require a continuous effort for many years, owing to the rapid development of electronics. We can claim that the electronics laboratory of Jicamarca was the most advanced in Peru. We should mention here the names of the Peruvian engineers that made this possible: Alberto Guillen, Miguel Leiva, Walter Camacho, Herbert Goller, Otto Castillo, Cesar Gonzalez, Cesar La Hoz, Cesar Valladares, Mario Ierkic, and Fernando Villanueva. Four of them went into graduate schools at US universities (Cesar Gonzalez, Cesar La Hoz, Mario Ierkic, and Cesar Valladares). These early contributors were followed by others in the later years, which we do not cover in these notes of the early Jicamarca history.
We close this early history of Jicamarca with the end of Woodman's directorship in 1974 and his departure to the Max Planck Institute for Aeronomy, Germany. He was replaced as director by Carlos Calderon. When the radar was originally built, it was envisioned that this project would last for around 10 years, mainly because a displacement of the magnetic Equator was expected. However, nature proved us wrong; 5 decades after its construction, the JRO is still the most important facility for studying the equatorial ionosphere. Hundreds of publications and studies have been generated since the early days. Scientists and students from different parts of the world have visited the observatory during all these decades, running new experiments, proposing new configurations, and learning about the basics of aeronomy and radar technology. This would have not been possible without the dedicated effort of Peruvian engineers, technicians, and scientists, who have worked with great commitment not only on keeping the radar operational but also on making the observatory a unique place for scientific discovery and technological innovation. The future for the Jicamarca radar is promising; there are a lot of possibilities to be explored, many more experiments to be run, and new science to be discovered, all of which only depend on how far we push our imagination.
The incoherent scatter ionospheric measurements conducted with the Jicamarca radar can be downloaded from the Madrigal database at http://cedar.openmadrigal.org (Rideout, 2017) or at http://jro.igp.gob.pe/madrigal/ (Rideout, 2012).
RW is the main writer of the paper. He proposed the idea, organized the paper, contributed with most of the details and events described here, and wrote the initial draft.
DF contributed with memories and details of the events described in the paper; he also edited a few parts of the document.
BB mainly contributed with memories and details of the events described in the paper.
MM reviewed and edited the paper, added figures and references, and verified some of the details described here.
The authors declare that they have no conflict of interest.
This article is part of the special issue “History of geophysical institutes and observatories”. It is not associated with a conference.
We thank the personnel at the Jicamarca Radio Observatory for their wonderful work in maintaining and operating the Jicamarca radar for more than 50 years; without their dedication, scientific discovery at the observatory would not have been possible. Some of the pictures presented in this paper were taken or collected by Ken Bowles and given to the JRO during the 40th anniversary of the observatory. We honor his legacy and will remember his work.
The Jicamarca Radio Observatory is a facility of the Instituto Geofísico del Perú and is operated with support from the NSF grant AGS-1732209 through Cornell University.
This paper was edited by Kristian Schlegel and reviewed by Jorge Luis Chau and one anonymous referee.
Balsley, B. B. and Farley, D. T.: Radar studies of the equatorial electrojet at three frequencies, J. Geophys. Res., 76, 8341–8351, https://doi.org/10.1029/JA076i034p08341, 1971. a
Balsley, B. B. and Woodman, R. F.: On the control of the F-region drift velocity by the E-region electric field: experimental evidence, J. Atmos. Terr. Phys., 31, 865–867, https://doi.org/10.1016/0021-9169(69)90167-6, 1969. a
Blakely, R. J.: Potential Theory in Gravity and Magnetic Applications, Cambridge University Press, https://doi.org/10.1017/CBO9780511549816, 1995. a
Booker, H. G. and Wells, H. W.: Scattering of radio waves by the F-region of the ionosphere, Terrestrial Magnetism and Atmospheric Electricity, 43, 249–256, https://doi.org/10.1029/TE043i003p00249, 1938. a
Bowles, K. L.: Observation of Vertical-Incidence Scatter from the Ionosphere at 41 Mc/sec, Phys. Rev. Lett., 1, 454–455, https://doi.org/10.1103/PhysRevLett.1.454, 1958. a, b
Bowles, K. L.: Incoherent scattering by free electrons as a technique for studying the ionosphere and exosphere: Observations and theoretical considerations, NBS Report 6070, National Bureau of Standards, 1959. a
Bowles, K. L.: Progress Report #1 Lima Radar Observatory – International Cooperative Project – National Bureau of Standards and Instituto Geofísico del Perú, NBS Report 7201, National Bureau of Standards, 1961a. a, b, c, d, e, f, g
Bowles, K. L.: Progress Report #2 Lima Radar Observatory – International Cooperative Project – National Bureau of Standards and Instituto Geofísico del Perú, NBS Report 7208, National Bureau of Standards, 1961b. a, b, c
Bowles, K. L.: Measuring Plasma Density of the Magnetosphere, Science, 139, 389–391, https://doi.org/10.1126/science.139.3553.389, 1963a. a, b
Bowles, K. L.: On the accuracy of electron density measurements using Incoherent backscatter. A Report on Progress at the Jicamarca Radar observatory, Lima, Peru, during the period 1 March 1963 through 1 September 1963, NBS Report 7963, National Bureau of Standards, 1963b. a, b, c, d
Bowles, K. L. and Cohen, R. S.: A study of the Equatorial Electrojet by Radio Techniques, in: Journal of Geophysical Research, 65, 2476–2477, 41st Annual Meeting, AGU, Washington, D.C., 1960. a, b
Bowles, K. L., Ochs, G. R., and Green, J. L.: On the absolute intensity of incoherent scatter echoes from the ionosphere, J. Res. NBS D. Rad. Sci., 66D, 395–407, 1962. a, b, c
Chapman, S.: The equatorial electrojet as detected from the abnormal electric current distribution above Huancayo, Peru and elsewhere, Arch. Met. Geoph. Biokl. A., 4, 368–390, https://doi.org/10.1007/BF02246814, 1951. a
Cohen, R.: International Symposium on Equatorial Aeronomy – Introduction, J. Geophys. Res., 68, 2359–2361, https://doi.org/10.1029/JZ068i009p02359, 1963. a
Dougherty, J. P.: Model Fokker-Planck equation for a plasma an its solution, Phys. Fluid., 7, 1788–1799, https://doi.org/10.1063/1.2746779, 1964. a
Dougherty, J. P. and Farley, D. T.: A theory of incoherent scattering of radio waves by a plasma, P. Roy. Soc. Lond. A, 259, 79–99, 1960. a
Dyce, B. R., Pettengill, G. H., and Shapiro, I. I.: Radar determination of the rotations of Venus anad Mercury, Astron. J., 72, 351–359, 1967. a
Farley, D. T.: A plasma instability resulting in field-aligned irregularities in the ionosphere, J. Geophys. Res., 68, 6083–6097, https://doi.org/10.1029/JZ068i022p06083, 1963. a
Farley, D. T.: The Effect of Coulomb Collisions on Incoherent Scattering of Radio Waves by a Plasma, J. Geophys. Res., 69, 197–200, https://doi.org/10.1029/JZ069i001p00197, 1964. a
Farley, D. T.: A theory of incoherent scattering of radio waves by a plasma 4. The effect of unequal ion and electron temperatures, J. Geophys. Res., 71, 4091–4098, https://doi.org/10.1029/JZ071i017p04091, 1966. a
Farley, D. T.: Proton Gyroresonance Observed in Incoherent Scattering from the Ionosphere, Phys. Fluid., 10, 1584–1586, https://doi.org/10.1063/1.1762326, 1967. a, b
Farley, D. T.: Incoherent scatter power measurements; a comparison of various techniques, Radio Sci., 4, 139–142, https://doi.org/10.1029/RS004i002p00139, 1969a. a
Farley, D. T.: Faraday rotation measurements using incoherent scatter, Radio Sci., 4, 143–152, https://doi.org/10.1029/RS004i002p00143, 1969b. a
Farley, D. T.: Incoherent scatter correlation function measurements, Radio Sci., 4, 935–953, https://doi.org/10.1029/RS004i010p00935, 1969c. a
Farley, D. T.: The equatorial E-region and its plasma instabilities: a tutorial, Ann. Geophys., 27, 1509–1520, https://doi.org/10.5194/angeo-27-1509-2009, 2009. a
Farley, D. T. and Balsley, B. B.: Instabilities in the Equatorial Electrojet, J. Geophys. Res., 78, 227–239, https://doi.org/10.1029/JA078i001p00227, 1973. a
Farley, D. T. and Bowles, K. L.: Observations of the Equatorial ionosphere using incoherent backscattering. A Report on Progress at the Jicamarca Radar Observatory, Lima, Peru, during the period 1 April 1964 through 30 September 1964, NBS Report 8489, National Bureau of Standards, 1964. a, b, c
Farley, D. T., Dougherty, J. P., and Barron, D. W.: A theory of incoherent scattering of radio waves by a plasma II. Scattering in a magnetic field, P. Roy. Soc. Lond. A, 263, 238–258, 1961. a
Farley, D. T., Balsley, B. B., Woodman, R. F., and McClure, J. P.: Equatorial spread-F: Implications of VHF radar observations, J. Geophys. Res., 75, 7199–7216, https://doi.org/10.1029/JA075i034p07199, 1970. a
Fejer, J. A.: Scattering of radio waves by an ionized gas in thermal equilibrium, Can. J. Phys., 38, 1114–1133, https://doi.org/10.1139/p60-119, 1960. a
Fejer, J. A.: Scattering of radio waves by an ionized gas in thermal equilibrium in the presence of a uniform magnetic field, Can. J. Phys., 39, 716–740, https://doi.org/10.1139/p61-081, 1961. a, b
Gordon, W. E.: Incoherent Scattering of Radio Waves by Free Electrons with Applications to Space Exploration by Radar, P. IRE, 46, 1824–1829, https://doi.org/10.1109/JRPROC.1958.286852, 1958. a
Hagfors, T.: Density Fluctuations in a Plasma in a Magnetic Field, with Applications to the Ionosphere, J. Geophys. Res., 66, 1699–1712, https://doi.org/10.1029/JZ066i006p01699, 1961. a, b
Hagfors, T., Green, J. L., and Guillen, A.: Determination of the albedo of the moon at the wavelength of 6m, Astron. J., 74, 1214–1219, 1969. a
Hysell, D. L., Milla, M. A., and Woodman, R. F.: High-altitude incoherent-scatter measurements at Jicamarca, J. Geophys. Res.-Space, 122, 2292–2299, https://doi.org/10.1002/2016JA023569, 2017. a
James, J. C.: Radar Studies of the Sun at 38 Mc/s, Astrophys. J., 146, 356–366, 1966. a
Klemperer, W. K., Ochs, G. R., and Bowles, K. L.: Radar Echoes from Venus at 50 Mc/sec, Astron. J., 69, 22–28, https://doi.org/10.1086/109223, 1964. a
Ochs, G. R.: Further observations of synchrotron radiations decay, J. Geophys. Res., 69, 1014–1016, https://doi.org/10.1029/JZ069i005p01014, 1964. a
Ochs, G. R.: The large 50 Mc/s dipole array at Jicamarca radar observatory, NBS Report 8772, National Bureau of Standards, 1965. a, b
Ochs, G. R., Farley, D. T., Bowles, K. L., and Bandyopadhay, P.: Observations of synchrotron radio noise at the magnetic equator following the high-altitude nuclear explosion of July 9, 1962, J. Geophys. Res., 68, 701–711, https://doi.org/10.1029/JZ068i003p00701, 1963. a
Pineo, V. C. and Briscoe, H. W.: Discussion of incoherent backscatter power measurements at 440 Mc/s, J. Geophys. Res., 66, 3965–3966, https://doi.org/10.1029/JZ066i011p03965, 1961. a
Pingree, J. E.: Incoherent scatter measurements and inferred energy fluxes in the equatorial F-region ionosphere, PhD thesis, Cornell University, Ithaca, NY, 1990. a
Rideout, W. M.: Madrigal Database at Jicamarca Radio Observatory, retrieved available at: http://jro.igp.gob.pe/madrigal/ (last access: 24 September 2019), 2012. a
Rideout, W. M.: Madrigal CEDAR Database, available at: http://cedar.openmadrigal.org (last access: 24 September 2019), 2017. a
Rishbeth, H.: Eclipse effects in the ionosphere, Nature, 226, 1099–1100, https://doi.org/10.1038/2261099a0, 1970. a
Rosenbluth, M. N. and Rostoker, N.: Scattering of electromagnetic waves by a nonequilibrium plasma, Phys. Fluid., 5, 776–788, https://doi.org/10.1063/1.1724446, 1962. a
Salpeter, E. E.: Electron density fluctuations in a plasma, Phys. Rev., 120, 1528–1535, https://doi.org/10.1103/PhysRev.120.1528, 1960. a
Salpeter, E. E.: Plasma Density Fluctuations in a Magnetic Field, Phys. Rev., 122, 1663–1674, https://doi.org/10.1103/PhysRev.122.1663, 1961. a
Salpeter, E. E.: Density Fluctuations in a Nonequilibrium Plasma, J. Geophys. Res., 68, 1321–1333, https://doi.org/10.1029/JZ068i005p01321, 1963. a
Sterling, D. L., Hanson, W. B., and Woodman, R. F.: Synthesis of data obtained at Jicamarca, Peru, during the September 11, 1969, Eclipse, Radio Sci., 7, 279–289, https://doi.org/10.1029/RS007i002p00279, 1972. a
Tikhonravov, M. K.: The creation of the first artificial Earth satellite: Some historical details, J. Brit. Inter. Soc., 47, 191–194, 1994. a
Woodman, R.: RADAR | MST and ST Radars and Wind Profilers, in: Encyclopedia of Atmospheric Sciences, edited by: Holton, J. R., 1825–1833, Academic Press, Oxford, https://doi.org/10.1016/B0-12-227090-8/00332-8, 2003. a
Woodman, R. F.: Incoherent scattering of electromagnetic waves by a plasma, PhD thesis, Harvard University, Cambridge, Massachusetts, 1967. a, b
Woodman, R. F.: Inclination of the Geomagnetic Field Measured by an Incoherent Scatter Technique, J. Geophys. Res., 76, 178–184, https://doi.org/10.1029/JA076i001p00178, 1971. a
Woodman, R. F.: East-west ionospheric drifts at the magnetic equator, in: Proceedings of Space Research XII, Akademie Verlag, 969–974, 1972. a
Woodman, R. F.: Spread F – an old equatorial aeronomy problem finally resolved?, Ann. Geophys., 27, 1915–1934, https://doi.org/10.5194/angeo-27-1915-2009, 2009. a
Woodman, R. F. and Guillen, A.: Radar Observations of Winds and Turbulence in the Stratosphere and Mesosphere, J. Atmos. Sci., 31, 493—505, https://doi.org/10.1175/1520-0469(1974)031<0493:ROOWAT>2.0.CO;2, 1974. a
Woodman, R. F. and Hagfors, T.: Methods for the Measurement of Vertical Ionospheric Motions near the Magnetic Equator by Incoherent Scattering, J. Geophys. Res., 74, 1205–1212, https://doi.org/10.1029/JA074i005p01205, 1969. a
Woodman, R. F. and La Hoz, C.: Radar observations of F region equatorial irregularities, J. Geophys. Res., 81, 5447–5466, https://doi.org/10.1029/JA081i031p05447, 1976. a
Woodman, R. F., Sterling, D. L., and Hanson, W. B.: Synthesis of Jicamarca data during the great storm of March 8, 1970, Radio Sci., 7, 739–746, https://doi.org/10.1029/RS007i007p00739, 1972. a
Zalesak, S. T., Ossakow, S. L., and Chaturvedi, P. K.: Nonlinear equatorial spread F: the effect of neutral winds and background Pedersen conductivity, J. Geophys. Res., 87, 151–166, https://doi.org/10.1029/JA087iA01p00151, 1982. a
- Abstract
- Historical context
- Scope
- The beginning
- First encouraging results
- The antenna
- The transmitter
- The building
- The control and processing system
- The early science and improvements of incoherent scatter theory
- A digital correlator arrives
- Slide rule computations and curve fitting by eye
- A minicomputer arrives
- Finally electron densities, temperatures, Te∕Ti, and composition can be determined
- The gyroresonances
- Radio and radar astronomy
- Coherent echoes
- Staff changes and further important experiments
- Transfer of the Jicamarca Radio Observatory to the Instituto Geofísico del Perú
- New observing techniques
- Final notes and conclusion
- Data availability
- Author contributions
- Competing interests
- Special issue statement
- Acknowledgements
- Financial support
- Review statement
- References


